


Introduction
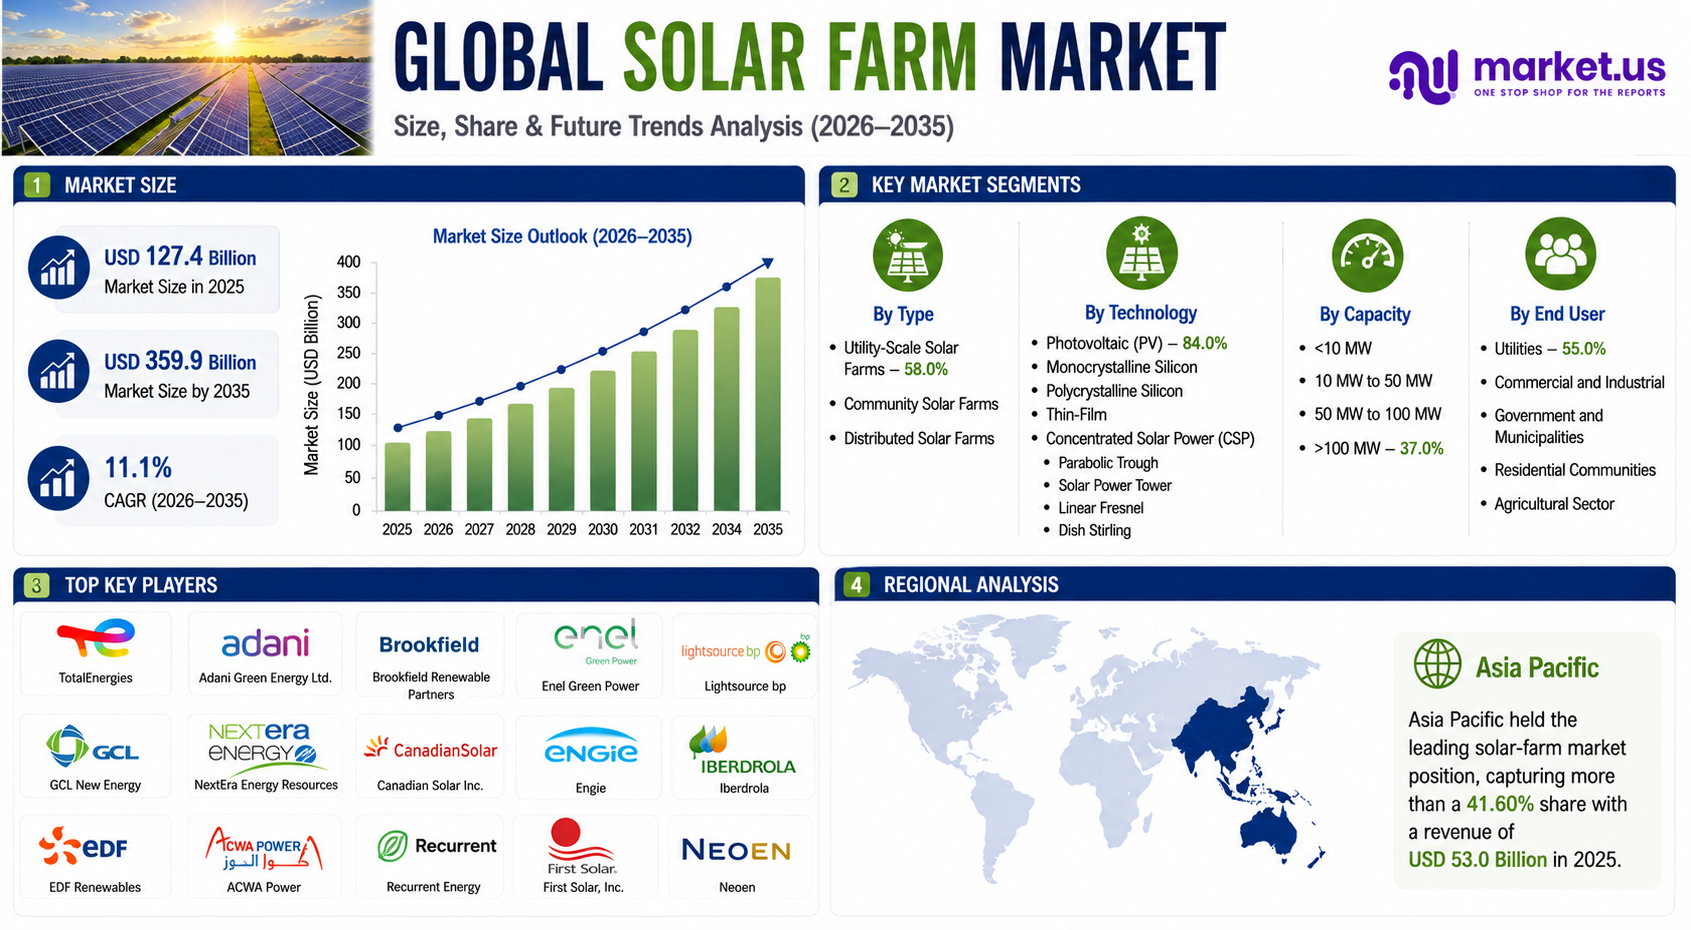
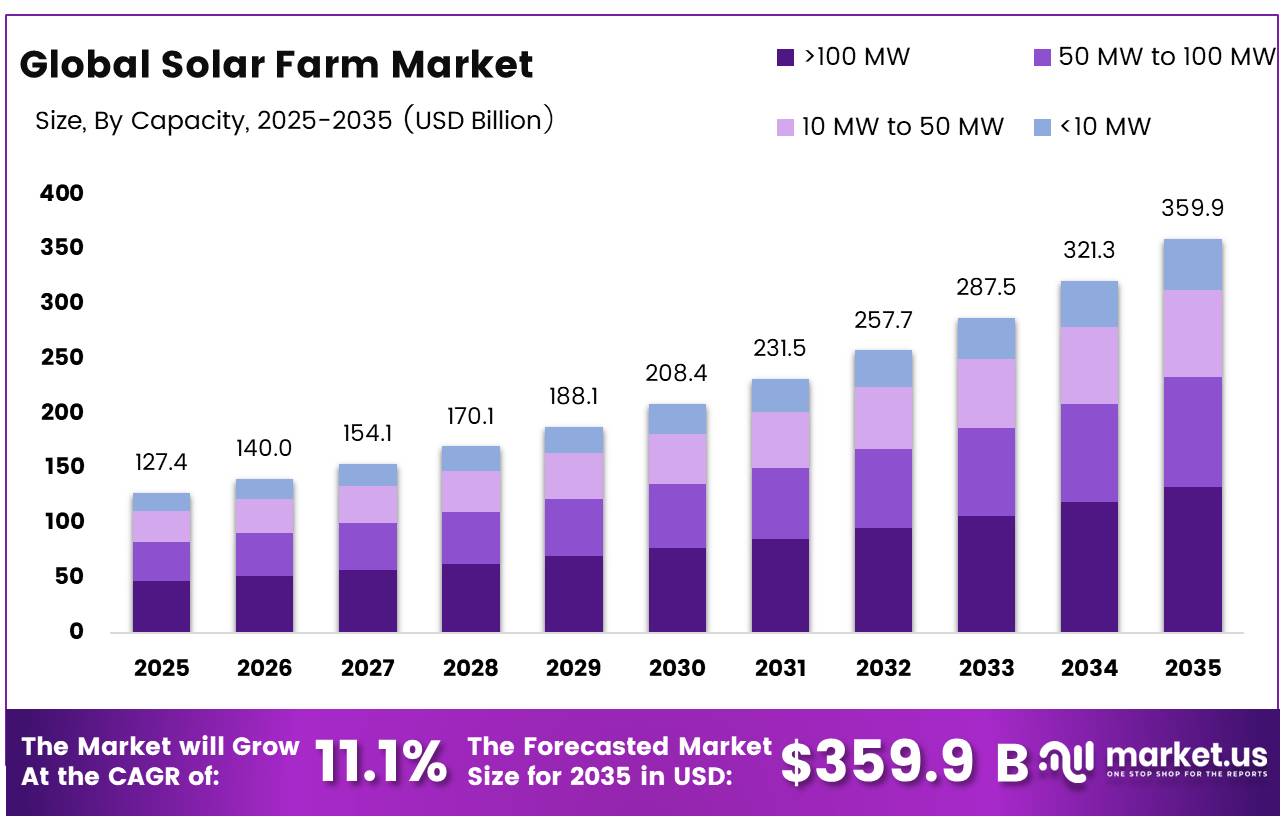
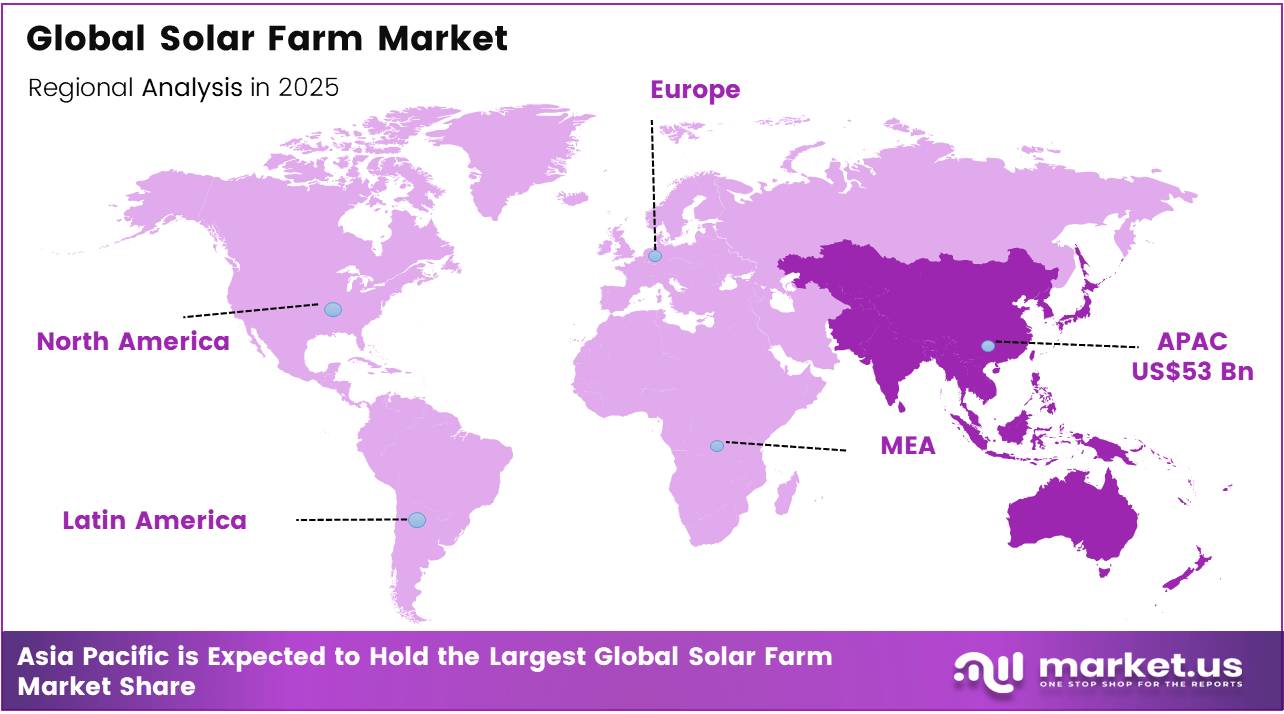
In 2025, the Global Solar Farm Market was valued at USD 127.4 billion. It is projected to grow at a CAGR of 11.1% from 2026 to 2035, reaching nearly USD 359.9 billion by 2035. Asia Pacific led the market with a 41.6% share and generated approximately USD 53.0 billion in revenue.
Solar farms play an important role in the renewable energy sector by converting large land areas into grid-connected electricity. These projects combine photovoltaic modules, inverters, tracking systems, and substations to supply power at utility scale.
Market demand is being supported by rising electricity consumption, energy-security concerns, and policies promoting low-emission power generation. In 2025, global solar photovoltaic generation increased by 620 TWh, compared with 450 TWh in 2024, raising solar’s share of worldwide electricity generation to around 8%.
- Government funding is also supporting technology development and domestic manufacturing. The U.S. Department of Energy allocated USD 217 million for solar laboratory research, USD 44 million for thin-film photovoltaic development, and USD 27 million for silicon manufacturing and dual-use solar projects.
Future growth opportunities are expected in solar-plus-storage, agrivoltaics, module recycling, project repowering, and digital plant controls. Global renewable electricity generation is forecast to rise by 60%, increasing from 9,900 TWh in 2024 to 16,200 TWh by 2030. Solar PV is expected to contribute more than half of this growth, while renewables may meet over 90% of the increase in global electricity demand between 2025 and 2030.
Key Takeaways
- The global Solar Farm market was valued at USD 127.4 billion in 2025.
- The global market is projected to grow at a CAGR of 11.1% and is estimated to reach USD 359.9 billion by 2035.
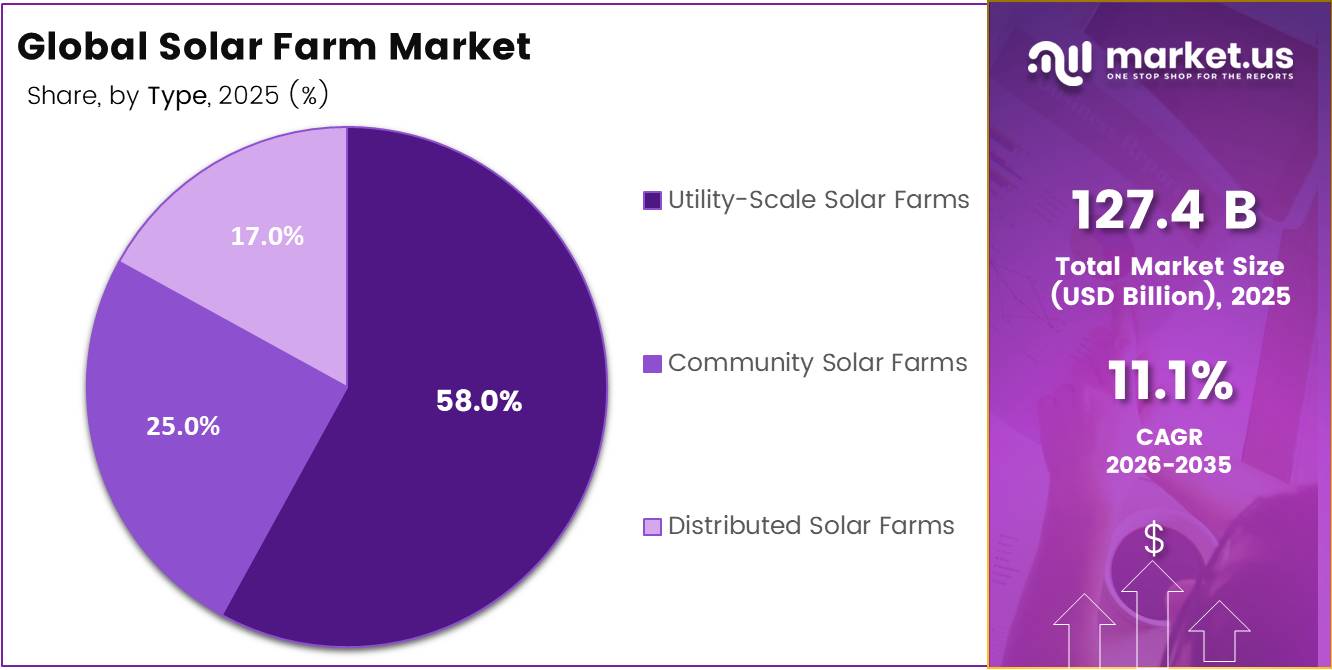
- On the basis of type, the Utility-Scale Solar Farms dominated the market, constituting 58.0% of the total market share.
- Based on the technology, the Photovoltaic (PV) dominated the Solar Farm market, with a substantial market share of around 84.0%.
- Among the By Capacity, the >100 MW held a major share in the Solar Farm market, 37.0% of the market share.
- Among the end user, the Utilities is the most considerable within the market, accounting for around 55.0% of the revenue.
- In 2025, the Asia Pacific was the most dominant region in the Solar Farm market, accounting for 41.6% of the total global consumption.
Market Segmentation Overview
Type Analysis
Utility-Scale Solar Farms dominate because they deliver large volumes of centralized electricity.
Utility-scale solar farms held the leading market position, accounting for more than 58.00% of the market. Their dominance was supported by their ability to generate large amounts of electricity and supply it directly to centralized power grids. In the United States, utility-scale solar photovoltaic capacity increased from 122,060.1 MW in 2024 to 149,798.5 MW in 2025. These facilities generated approximately 296,000 GWh of electricity during 2025, representing annual growth of 34%.
Technology Analysis
Photovoltaic technology leads because of its flexibility and scalability.
Photovoltaic technology held the dominant position, capturing more than 84.00% of the Solar Farm Market. PV systems can be installed across projects of different sizes and combined with battery storage to support more reliable electricity delivery. In January 2025, the U.S. Department of Energy finalized a USD 289.7 million loan guarantee to support the installation of up to 1,000 photovoltaic and battery systems across as many as 27 states.
Capacity Analysis
Above 100 MW projects dominate grid-scale solar development.
Solar farms with capacities above 100 MW held the leading market position, accounting for more than 37.00% of the market. These projects benefit from centralized construction, high-volume electricity generation, and stronger integration with battery storage. In January 2025, the U.S. Bureau of Land Management approved a 400 MW solar facility covering approximately 2,469 acres in Nevada, showing the scale of development supported by this category.
End-User Analysis
Utilities dominate because they purchase electricity at grid scale.
Utilities held the leading position in the Solar Farm Market, capturing more than 55.00% of the total share. Their dominance was supported by large-scale electricity procurement and the integration of solar projects into centralized power networks. In 2024, the U.S. electric power sector generated 216,715 thousand MWh from solar photovoltaic systems, while independent power producers contributed 185,257 thousand MWh.
Drivers
Rising Electricity Demand Accelerates Utility-Scale Solar Farm Development
The International Energy Agency reported that global solar photovoltaic generation increased by 620 TWh in 2025, compared with an increase of 450 TWh in 2024. Total solar generation reached nearly 2,700 TWh, supplying more than 8% of global electricity. Solar PV is expected to add more than 600 TWh of electricity annually through 2030, making large solar farms increasingly important for meeting future power requirements.
According to the U.S. Energy Information Administration, utility-scale solar photovoltaic capacity increased from 122,060.1 MW in 2024 to 149,798.5 MW in 2025. Utility-scale solar facilities generated approximately 296,000 GWh during 2025, representing annual growth of 34%. The agency expects utility-scale solar generation to rise from 290 billion kWh in 2025 to 424 billion kWh by 2027. This expansion encourages developers to construct larger solar farms and pair them with battery storage to support evening demand and improve grid reliability.
Government funding is also helping the industry respond to rising electricity needs. The U.S. Department of Energy lists USD 217 million for its FY2025–27 solar laboratory programme, USD 44 million for thin-film photovoltaic development, and USD 27 million for silicon manufacturing and dual-use PV projects. The department is also targeting an unsubsidized utility-scale solar electricity cost of USD 0.02 per kWh by 2030. These initiatives support stronger technology, domestic manufacturing, grid integration, and lower project costs, strengthening the long-term outlook for solar farms.
Business Opportunities
Solar-Plus-Storage Projects Create New Revenue And Grid Opportunities
The scale of storage deployment shows how quickly this opportunity is developing. According to the International Energy Agency’s Global Energy Review 2026, the world installed 108 GW of new battery storage capacity in 2025, representing growth of 40% from 2024. Around 80% of the new capacity was installed at utility scale, while global installed battery capacity became 11 times larger than in 2021. The IEA estimates that worldwide energy-storage capacity must increase sixfold to approximately 1,500 GW by 2030 to support the rapid expansion of solar and wind generation.
The United States provides a clear example of this business shift. The U.S. Energy Information Administration expected developers to add 32.5 GW of utility-scale solar and 18.2 GW of battery storage during 2025. Together, solar and storage represented 81% of planned new generating capacity. Actual time-adjusted utility-scale battery capacity reached 33,209.3 MW in 2025, up from 19,945.1 MW in 2024.
Government approvals are creating investable project pipelines. In January 2025, the U.S. Bureau of Land Management approved Nevada’s Rough Hat Clark project, combining a 400 MW solar facility with 700 MW of battery storage across approximately 2,469 acres. Projects of this scale show that storage is becoming a central part of solar-farm design. Developers that combine generation, storage, digital controls, and grid services can improve project value while offering customers cleaner and more reliable electricity.
Emerging Trends
Agrivoltaics Combines Farming With Utility-Scale Solar Power Generation
Agrivoltaics is emerging as an important solar-farm trend because it allows electricity generation and agricultural activity to continue on the same land. Solar panels can be positioned above crops, between planting rows, or across grazing areas, helping developers reduce land-use disputes while farmers retain productive use of their property. The U.S. Department of Energy estimates that ground-mounted solar could require about 5.7 million acres by 2035 and as much as 10 million acres by 2050. Although this represents only 0.3% and 0.5% of the contiguous United States, development is often concentrated near transmission infrastructure and farming communities, making dual-use project design increasingly valuable.
Deployment data shows that agrivoltaics is moving beyond small research sites. The National Renewable Energy Laboratory reported that U.S. agrivoltaic installations expanded from 27,000 acres and 4.5 GW in 2020 to more than 60,000 acres and 10 GW by November 2024. Nearly 600 sites were operating nationwide. More than 400 included native vegetation or pollinator habitats, over 200 used livestock grazing, and 35 supported crop production. These projects can improve land productivity, provide shade for animals and plants, and create lease or electricity income for agricultural landowners.
Government funding is helping this model reach utility scale. The Department of Energy committed USD 15 million to agrivoltaics research covering farmer economics, community benefits, and development costs. Under the USDA New ERA programme, more than USD 13 million is supporting a 26 MW agrivoltaic facility in Colorado. It is expected to supply nearly 6,600 homes and reduce emissions by over 60,000 tons annually. Another USDA investment of nearly USD 262 million supports a 760 MW renewable portfolio that includes 160 MW from agrivoltaics. These investments show that future solar farms may operate as both power plants and productive agricultural landscapes.
Use Cases
Utility-Scale Electricity Supply: The primary use of a solar farm is supplying large volumes of electricity to regional power grids. These projects are generally developed by utilities and independent power producers under long-term electricity contracts. U.S. utility-scale solar photovoltaic capacity reached 149,798.5 MW in 2025, rising from 122,060.1 MW in 2024. Utility-scale solar farms generated approximately 296,000 GWh of electricity during 2025, representing annual growth of 34%. Solar photovoltaic and solar-thermal plants together supplied around 7% of total U.S. utility-scale electricity. These figures demonstrate the growing role of centralized solar farms in meeting residential, commercial, and industrial power demand.
Solar-Plus-Storage Power Delivery: Solar farms are increasingly combined with batteries so that electricity generated during the day can be supplied after sunset or during periods of high demand. Battery systems also help operators reduce output fluctuations and provide grid-balancing services. The Rough Hat Clark project approved in Nevada combines a 400 MW solar farm with a 700 MW battery storage system across approximately 2,469 acres. The Bureau of Land Management stated that renewable projects approved during the related federal programme represented 13.5 GW of capacity, enough to supply nearly 6 million homes.
Agriculture and Solar Power Integration: Agrivoltaic solar farms allow electricity production and farming to continue on the same site. Panels can be placed above crops, between planting areas, or across land used for sheep and cattle grazing. U.S. agrivoltaic capacity increased from 4.5 GW across 27,000 acres in 2020 to approximately 10 GW across more than 60,000 acres by November 2024. Nearly 600 agrivoltaic sites were operating across the country, covering livestock grazing, crop production, greenhouses, native vegetation, and pollinator habitats. This approach helps developers reduce land-use conflicts while providing farmers with additional lease or electricity income.
Shared Community Electricity Access: Community solar farms provide electricity to several households, businesses, schools, or public facilities through subscription arrangements. They are useful for customers who rent properties, live in apartments, or cannot install rooftop panels. By June 2024, the United States had approximately 7.87 GW of operating community solar capacity across 44 states and localities, including the District of Columbia. The median capacity-weighted net present value of residential subscriptions was around USD 0.27 per watt, indicating potential long-term bill savings. Among the 24 jurisdictions with community-solar legislation, 20 included provisions supporting low-income participation.
Landfill and Brownfield Redevelopment: Solar farms can turn closed landfills, former mines, and contaminated industrial land into productive energy assets. These sites often have limited alternative development value but may already be located near roads and grid infrastructure. In 2024, U.S. Superfund sites contained 140 solar installations with a combined capacity of 1,847 MW. Across all renewable technologies, 161 installations at 110 Superfund sites provided 1,988 MW, enough capacity to power more than 280,000 homes annually. Separately, an EPA-supported Ohio programme includes 63 MW of solar and 10 MW of battery storage across five former landfill and brownfield locations, with more than 200 jobs expected.
Regional Analysis
Asia Pacific Leads While Europe Expands Rapidly
Asia Pacific held the largest share of the Global Solar Farm Market, accounting for more than 41.60% of the total market. Its leadership was supported by large utility-scale projects, expanding transmission infrastructure, and a strong solar manufacturing base.
China remained a major contributor to regional growth. By the end of 2025, the country’s solar power capacity reached 1.2 billion kW, while new installations during the year totaled 317 million kW. This strong project activity helped Asia Pacific maintain its leading market position.
Europe emerged as the growing regional market, supported by energy-security policies, competitive renewable-energy auctions, and efforts to reduce dependence on imported fossil fuels. These factors encouraged investment in new solar farms, grid improvements, and energy-storage systems.
Recent Developments
In September 2025, Iberdrola brought a 316 MW photovoltaic plant into operation in Salamanca, Spain. Developed with an investment of approximately EUR 200 million, the project includes more than 460,000 solar modules. The facility is capable of supplying renewable electricity to around 155,000 homes while reducing annual carbon dioxide emissions by nearly 75,000 tonnes.
Conclusion
The Solar Farm Market is expected to maintain strong long-term growth as governments, utilities, and industrial users require larger volumes of affordable and low-emission electricity. Solar PV recorded the largest annual increase of any power source in 2025, adding around 600 TWh and taking total global solar generation to nearly 2,700 TWh, or more than 8% of worldwide electricity output. Solar also represented 75% of the record 800 GW of renewable capacity added during the year, showing its central role in new power development.
The market outlook remains positive because solar generation is forecast to increase by more than 600 TWh annually through 2030, while its share of global electricity could rise from around 8% in 2025 to 15% by 2030. Growth will increasingly depend on battery storage, stronger transmission networks, digital plant controls, agrivoltaics, and the reuse of brownfields and low-value land. In the United States, the Department of Energy is targeting an unsubsidized utility-scale solar cost of USD 0.02 per kWh by 2030, which could further improve project economics.
Looking for data tailored to your specific market, region, or business need? Request a custom report or consultation — write to us at [email protected]




















