


Report Overview
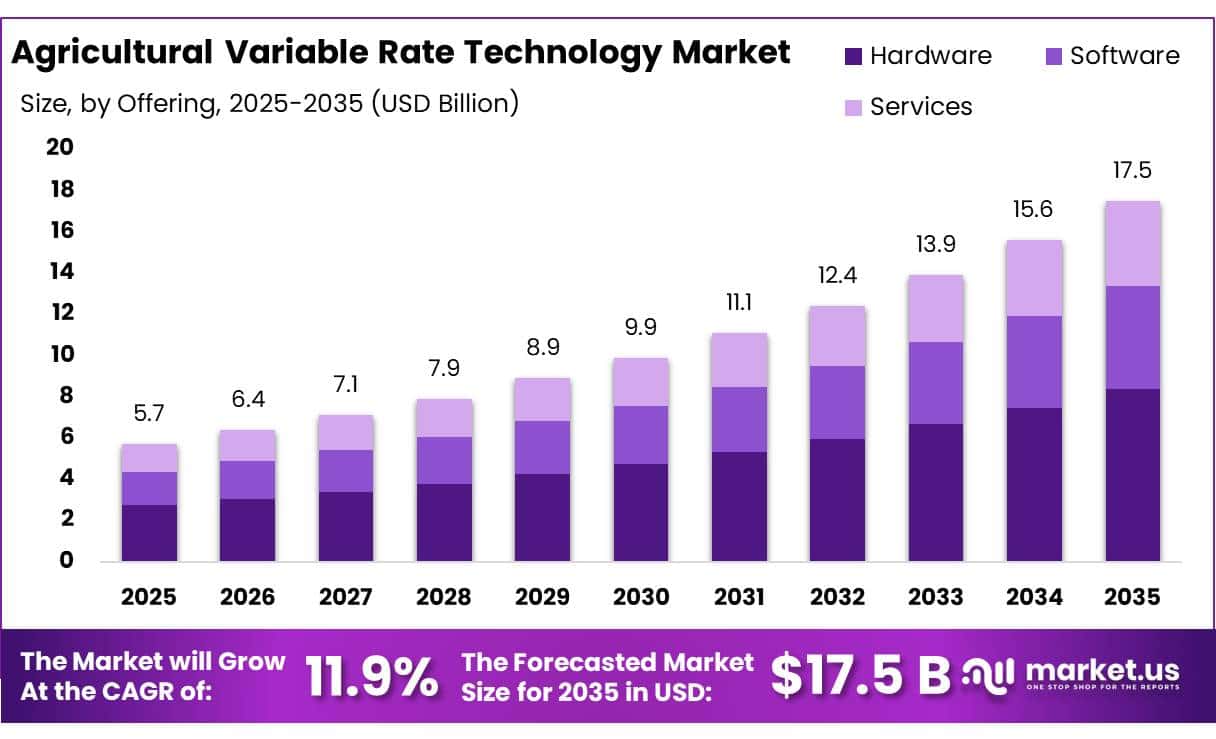
The Global Agricultural Variable Rate Technology Market size is expected to be worth around USD 17.5 Billion by 2035, from USD 5.7 Billion in 2025, growing at a CAGR of 11.9% during the forecast period from 2026 to 2035. In 2025, North America held a dominant market position, capturing more than a 38.60% share, holding USD 0.5 Billion revenue.
Agricultural Variable Rate Technology (VRT) is a part of precision agriculture, allowing seed, fertilizer, lime, pesticides and irrigation inputs to be applied at different rates within a field. It combines GPS guidance, field maps, sensors, controllers, prescription software and variable-rate applicators to match input use with soil and crop conditions. USDA explains that VRT can improve input efficiency, lower production costs and reduce environmental impacts by adjusting applications while machinery moves through a field.
- USDA data show that VRT was used on 37.4% of U.S. corn planted acres in 2016, compared with 11.5% in 2005. Adoption also reached 25.3% of soybean acres in 2018, 22.7% of cotton acres in 2019 and 18.8% of winter wheat acres in 2017. More USDA farm-level data show that guidance autosteering was used by 70% of large-scale crop farms in 2023, while 68% used yield monitors, yield maps or soil maps, creating a strong digital base for wider VRT deployment.
Rising input costs are an important driver. USDA reported in March 2025 that fertilizer represented 33% to 44% of corn operating costs and 34% to 45% of wheat operating costs since 2020. Anhydrous ammonia prices had previously exceeded $1,600 per ton and urea surpassed $1,000 per ton during the 2022 price peak. Even with greater price stability in early 2025, input-cost exposure continues to encourage growers to place fertilizer only where agronomic response is expected.
Environmental pressure supports adoption. The U.S. Environmental Protection Agency states that about 12 million tons of nitrogen and 4 million tons of phosphorus fertilizer are applied annually to crops in the continental United States. EPA identifies precision agriculture as a method that can significantly reduce fertilizer use and nutrient runoff. In June 2025, EPA also selected 4 organizations for $3.71 million in grants to improve nutrient management in the Western Lake Erie Basin.
Government-backed digitalisation is creating further opportunity. The European Commission’s CAP 2023–27 includes digitalisation strategies across EU countries and specifically supports precision farming. In April 2025, the Commission opened €140 million of Digital Europe calls, including €55 million for generative AI applications in public administration and the agri-food sector. The proposed post-2027 CAP also reserves at least €300 billion for farmer support, including farm modernisation and new technologies.
Key Takeaways
- Agricultural Variable Rate Technology Market size is expected to be worth around USD 17.5 Billion by 2035, from USD 5.7 Billion in 2025, growing at a CAGR of 11.9%.
- Hardware held a dominant market position, capturing more than a 47.90% share.
- Map-Based VRT held a dominant market position, capturing more than a 72.00% share.
- Fertilizer VRT held a dominant market position, capturing more than a 45.20% share.
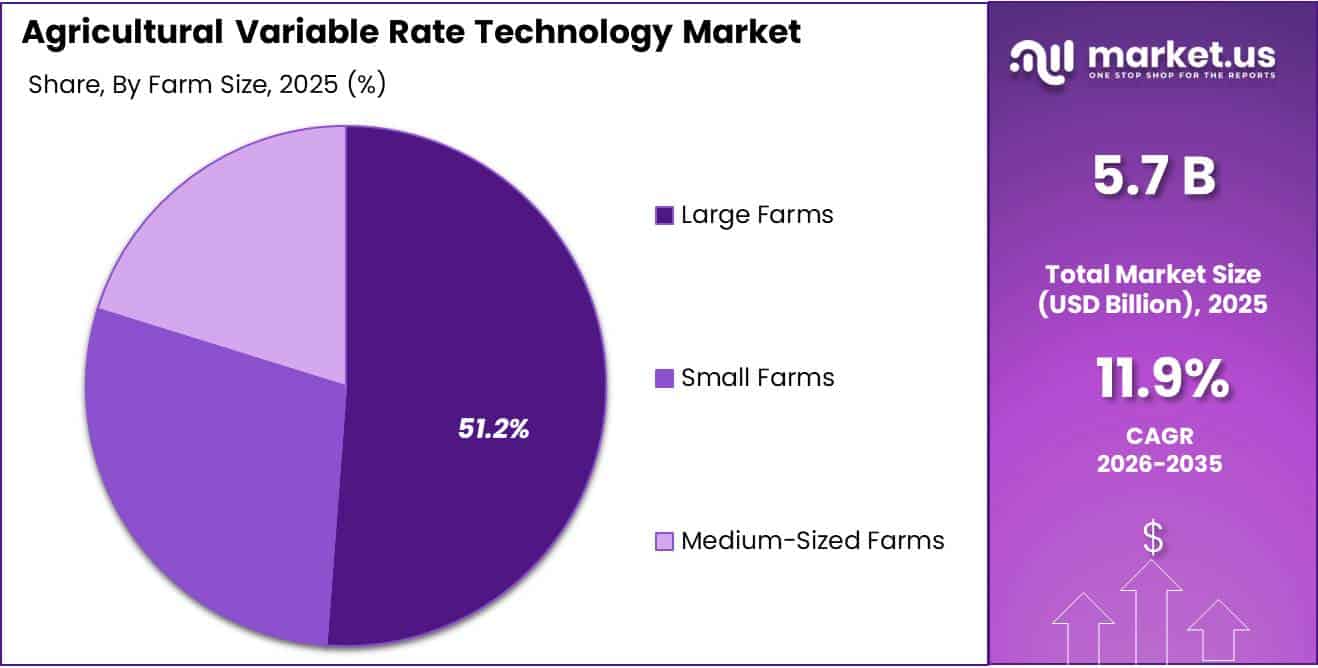
- Large Farms held a dominant market position, capturing more than a 51.20% share.
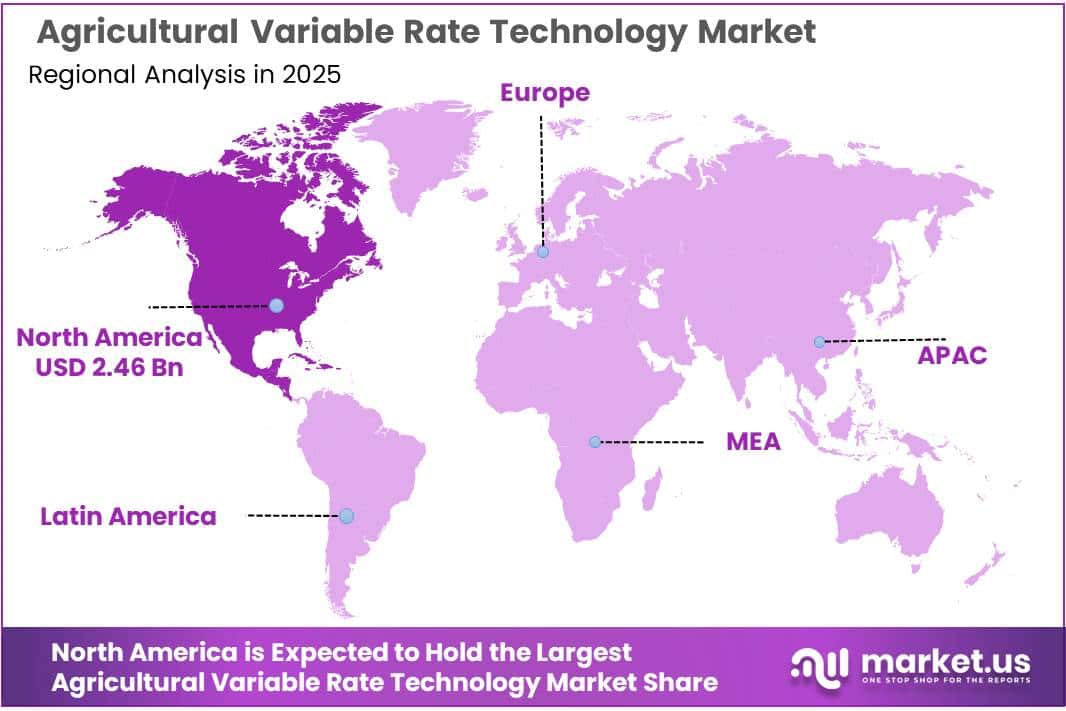
- North America held a dominant position in the Agricultural Variable Rate Technology Market, capturing more than a 43.20% share and reaching 2.46 BN in value.
By Offering Analysis
Hardware Leads with 47.90% Share as Sensors, Controllers and Variable-Rate Equipment Become Core Farm Technologies
In 2025, Hardware held a dominant market position, capturing more than a 47.90% share. Hardware remained central to Agricultural Variable Rate Technology because site-specific application depends on GPS receivers, sensors, electronic controllers, flow meters, cameras, variable-rate nozzles and application machinery working directly in the field. USDA NASS reported that 22% of U.S. farms used precision-agriculture practices in 2025, including GPS guidance, yield monitoring, soil mapping and variable-rate input applications. At the same time, 68% of farms used desktop or laptop computers and 82% used smartphones, supporting stronger connectivity between field hardware and farm-management systems.
Hardware demand is also supported by measurable input savings. A USDA Agricultural Research Service project reported in 2025 that an intelligent variable-rate sprayer using laser sensing and automated flow controls reduced pesticide volume by 58%, reduced non-target ground losses by 41%, and lowered annual insecticide and fungicide spending by about $114 per acre while maintaining crop protection performance. These operating benefits strengthen the case for investment in sensors, nozzle controllers and automated variable-rate application equipment.
Software is becoming an increasingly important offering in the Agricultural Variable Rate Technology Market because it converts soil maps, yield information, satellite imagery, sensor readings and weather data into application prescriptions. These platforms help growers identify field variability and instruct connected equipment to change fertilizer, seed, pesticide or irrigation rates automatically. The software layer is therefore becoming more valuable as farms connect machinery, sensors and field records within a single digital operating system.
By Technology Analysis
Map-Based VRT Leads with 72.00% Share as Field Mapping Supports Planned Input Application
In 2025, Map-Based VRT held a dominant market position, capturing more than a 72.00% share. Map-Based VRT remained widely used because it combines GPS positioning, soil maps, historical yield maps, satellite imagery and prescription files to determine where seed, fertilizer and crop-protection inputs should be applied. USDA Agricultural Research Service findings published in 2025, based on 247 farmer responses, showed that 93% used some form of digital agricultural technology. Long-term adoption exceeded ten years for 52% of respondents using yield mapping, while 35% reported long-term use of variable-rate technologies. These figures show the established role of mapped field information in precision farming.
USDA ARS research during 2025 also developed a Yield Performance Index using multiple years of mapped crop-yield information. The system separates areas with low and unstable yields from consistently productive zones, allowing growers to create more targeted management plans. This strengthens Map-Based VRT because fertilizer, seed and soil amendments can be directed toward areas where they provide greater value.
Sensor-Based VRT is becoming increasingly important as growers move from predetermined prescription maps toward real-time input decisions. Optical cameras, laser sensors, soil-moisture probes and crop-canopy sensors can identify changing field conditions while machinery is operating and immediately adjust spray, fertilizer or irrigation rates.
By Application Analysis
Fertilizer VRT Leads with 45.20% Share as Farms Focus on Precise Nutrient Use
In 2025, Fertilizer VRT held a dominant market position, capturing more than a 45.20% share. Fertilizer VRT remains widely used because it enables nitrogen, phosphorus, potassium and other nutrients to be applied according to soil fertility, yield potential and crop requirements across individual field zones. GPS maps, prescription software and variable-rate controllers allow equipment to automatically raise or lower fertilizer application while moving across the field.
High fertilizer expenses strengthen the business case for this technology. USDA Economic Research Service reported in March 2025 that fertilizer accounted for 33%–44% of corn operating costs and 34%–45% of wheat operating costs. U.S. fertilizer production expenses were also forecast at approximately US$29.236 billion in 2025. These costs encourage producers to reduce overlapping applications and place nutrients more closely according to crop requirements.
Seeding VRT is gaining importance in the Agricultural Variable Rate Technology Market as producers increasingly adjust planting density according to soil characteristics, moisture availability and historical field performance. Instead of maintaining one seed population across an entire field, variable-rate planters use prescription maps, GPS positioning and electronic seed meters to change seed placement and population automatically.
By Farm Size Analysis
Large Farms Lead with 51.20% Share as Scale Makes Variable-Rate Investment More Economical
In 2025, Large Farms held a dominant market position, capturing more than a 51.20% share. Large farms remain major users of Agricultural Variable Rate Technology because their broader acreage makes GPS guidance, prescription mapping, automated controllers and variable-rate seed and fertilizer equipment economically practical. These farms can spread technology costs across larger production areas while gaining value from lower overlaps, reduced input waste and more consistent field operations.
Government data support this strong technology orientation. USDA Economic Research Service reported that guidance autosteering was used by 70% of large-scale crop-producing farms, while yield monitors, yield maps and soil maps were used by 68%. Variable-rate technology itself was used by 45% of large-scale farms, compared with lower adoption among smaller operations.
Small Farms are gradually expanding their use of Agricultural Variable Rate Technology as affordable sensors, smartphones, cloud software and compact GPS-based equipment reduce traditional adoption barriers. Smaller farms often face tighter capital budgets, making modular technologies and retrofit controllers more attractive than large integrated machinery packages. VRT can help these operations apply fertilizer, seed and crop-protection products according to field conditions rather than using one uniform application rate.
By Crop Type Analysis
Cereals and Grains Lead with 43.00% Share as Large Acreage Supports Precision Input Management
In 2025, Cereals and Grains held a dominant market position, capturing more than a 43.00% share. Cereals and grains remain a major application area for Agricultural Variable Rate Technology because corn, wheat, barley and other broad-acre crops require substantial quantities of seed, fertilizer and crop-protection inputs. Variable-rate systems allow growers to change application levels according to soil fertility, yield potential and field variability, helping improve input efficiency across large production areas.
Government statistics show the scale supporting this segment. USDA NASS estimated U.S. corn production at a record 17.0 billion bushels in 2025, up 14% from 2024, while average yield reached a record 186.5 bushels per acre. USDA ERS also reported that U.S. farmers produced approximately 1.98 billion bushels of wheat in 2025/26 from 37.2 million harvested acres. These large production areas create favorable conditions for GPS guidance, variable-rate fertilizer spreading, prescription seeding and sensor-based crop management.
Oilseeds and Pulses are becoming an important crop segment for Agricultural Variable Rate Technology as soybean, canola, sunflower, peanut, lentil and pulse growers seek more accurate control over seeding density, fertilizer use and crop-protection applications. Variable-rate planting can adjust population according to soil productivity, while prescription-based nutrient application helps avoid unnecessary input use in lower-yielding field zones.
Key Market Segments
By Offering
- Hardware
- Software
- Services
By Technology
- Map-Based VRT
- Sensor-Based VRT
By Application
- Fertilizer VRT
- Seeding VRT
- Crop-Protection Chemical VRT
- Irrigation VRT
- Others
By Farm Size
- Small Farms
- Medium-Sized Farms
- Large Farms
By Crop Type
- Cereals and Grains
- Oilseeds and Pulses
- Fruits and Vegetables
- Commercial Crops
- Others
Driver Analysis
Input-Cost Pressure Strengthens VRT ROI
Input inflation is converting VRT from an agronomic upgrade into a margin-protection tool: USDA forecasts U.S. farm production expenses at $492.8 billion in 2026, 4.5% above 2025, with fertilizer, lime and soil-conditioner spending increasing 15.3% and fuel and oil increasing 28.8%. The economic mechanism is direct—prescription-based seed, nutrient and crop-protection rates reduce expenditure in low-response zones while protecting yield potential in high-response zones—and historical USDA farm-level modeling associated VRT with 3.7%–3.9% lower production cost, including about $21–$22 per acre when combined with soil or yield mapping.
Adoption headroom remains material: VRT covered 37.4% of U.S. corn acres in 2016, 25.3% of soybean acres in 2018 and 22.7% of cotton acres in 2019, while larger farms consistently adopted faster because they spread fixed costs over more output; separately, only 27% of U.S. farms and ranches reported any precision-agriculture practice in 2023. The estimated +2.4 percentage-point CAGR effect therefore reflects a near-term replacement and retrofit cycle concentrated in high-acreage grain, oilseed and cotton operations, where rising input bills shorten payback periods and increase demand for rate controllers, section control, prescription software and compatible applicators.
Drivers Impact Analysis
| Driver | (~) % Impact on CAGR Forecast | Geographic Relevance | Impact Timeline |
|---|---|---|---|
| Input-cost pressure strengthens VRT ROI | +2.4 pp | North America core; Brazil, Argentina, Western Europe, Australia | Short term (≤ 2 years) |
| AI sensing enables real-time variable application | +2.1 pp | North America core; EU; Brazil; Australia | Medium term (2–4 years) |
| Subsidies and input rules de-risk adoption | +1.8 pp | EU-27; India; United States | Short term (≤ 2 years) |
| Geospatial data and farm connectivity expand prescriptions | +1.5 pp | United States, Canada, EU, India; Brazil corridors | Medium term (2–4 years) |
| Water stress and climate volatility reward site specificity | +1.3 pp | South Asia, MENA, U.S. West, Southern Europe, Australia | Long term (≥ 4 years) |
| Retrofit, interoperability and pay-per-acre models widen access | +1.1 pp | North America, EU, Brazil; India service clusters | Medium term (2–4 years) |
Restraint Analysis
High CapEx and Farm Debt
VRT adoption is restrained when precision hardware competes with fertilizer, fuel, seed, labor, and debt-servicing requirements for the same farm cash flow: U.S. farm production expenses are forecast to reach $492.8 billion in 2026, up $21.2 billion or 4.5% from 2025, while fertilizer, lime, and soil-conditioner spending is projected to rise 15.3% to $39.6 billion and fuel-and-oil spending 28.8% to $21.6 billion.
At the same time, U.S. farm-sector debt is forecast to rise 4.6% to $605.1 billion in 2026, while the debt-to-asset ratio increases from 13.34% in 2025 to 13.54%; this raises lender scrutiny of payback periods for GPS receivers, rate controllers, sensors, ISOBUS terminals, drones, and subscription software.
The resulting -2.3 percentage-point CAGR deduction reflects delayed equipment upgrades, greater demand for low-cost retrofits over new integrated machines, and slower conversion of trial users into multi-year software contracts; machinery-market softness reinforces this risk, as 67.5% of surveyed U.S. dealers reported new-equipment sales declines of at least 2% during 2025.
Restraint Impact Analysis
| Restraint | (\~) % Impact on CAGR Forecast | Geographic Relevance | Impact Timeline |
|---|---|---|---|
| High CapEx and Farm Debt | -2.3 pp | North America core; EU; Australia; Brazil | Short term (≤ 2 years) |
| Small-Farm ROI Mismatch | -1.9 pp | India; Southeast Asia; Africa; LATAM | Long term (≥ 4 years) |
| Connectivity and Cloud Gaps | -1.6 pp | U.S. rural areas; Canada; India; Brazil corridors | Medium term (2–4 years) |
| Interoperability Lock-In | -1.4 pp | North America; EU; Australia; Brazil | Medium term (2–4 years) |
| Data Ownership and Cyber Risk | -1.1 pp | North America; EU; developed APAC | Medium term (2–4 years) |
| Skills, Service and Calibration Gaps | -1.0 pp | India; LATAM; Africa; EU periphery | Short term (≤ 2 years) |
Opportunity Analysis
Outcome-Based VRT SaaS
The largest untapped monetization opportunity is to replace equipment-led sales and flat annual software licenses with outcome-linked contracts that charge per treated hectare, per verified input dollar saved, or per yield-risk reduction delivered; this is not a baseline driver because most VRT revenues remain tied to machinery, displays, controllers, and standard subscriptions rather than audited agronomic outcomes. Only 27% of U.S. farms or ranches reported using precision-agriculture practices in 2023, leaving a large conversion pool for vendors that eliminate up-front decision risk through guaranteed savings, shared-value pricing, and seasonal contracts.
A practical model would retain a low platform fee while taking 10%–20% of independently verified fertilizer, seed, water, or crop-protection savings, with a 50-hectare customer generating materially higher lifetime value when prescriptions, verification maps, agronomy support, and application logs are bundled into a recurring service. The +2.2 percentage-point CAGR upside reflects improved farmer conversion, lower perceived CapEx, expansion of gross margin from hardware resale toward software and data services, and lower customer acquisition cost when dealers can sell a cash-flow-positive operating model rather than justify a multi-year equipment payback.
Opportunity Impact Analysis
| Opportunity | (\~) % Potential CAGR Upside | Geographic Relevance | Execution Window |
|---|---|---|---|
| Outcome-based VRT SaaS | +2.2 pp | North America; EU; Australia; Brazil | Short term (≤ 2 years) |
| Smallholder service networks | +2.0 pp | India; Southeast Asia; Africa; LATAM | Medium term (2–4 years) |
| Carbon MRV integration | +1.7 pp | EU; U.S.; Canada; Australia; Brazil | Medium term (2–4 years) |
| Satellite-native prescriptions | +1.6 pp | India; Brazil; Africa; APAC emerging markets | Medium term (2–4 years) |
| Insurance and lender analytics | +1.3 pp | U.S.; Canada; EU; Brazil | Medium term (2–4 years) |
| Precision-stack M&A roll-ups | +1.1 pp | North America; EU; developed APAC | Short term (≤ 2 years) |
Challenges Analysis
Mixed-Fleet Integration Complexity
VRT deployments increasingly span tractors, sprayers, seeders, combines, drones, soil probes, weather stations, GNSS receivers, imagery platforms, and farm-management software purchased across 10–20-year replacement cycles, producing persistent integration burden even when each component functions independently; GAO identifies the absence of uniform standards as a barrier because lack of compatibility hampers integration across precision-agriculture technologies.
The operating penalty emerges through duplicated displays, controller retrofits, proprietary file conversion, multiple cloud subscriptions, non-standard task logs, and technician time spent validating machine–implement response rather than applying prescriptions; a 500-hectare enterprise operating three machinery brands can require separate data exports for planting, application, and harvest unless APIs and ISO 11783/ISOBUS functions are validated at implement level.
The -1.5 percentage-point medium-term drag reflects longer commissioning cycles, slower dealer throughput, inconsistent annual renewal of software modules, and elevated customer-support cost; suppliers must prioritize open APIs, common agronomic data schemas, cross-brand certification, and retrofit kits that allow growers to retain legacy machinery rather than postpone VRT adoption until complete fleet replacement.
Challenges Impact Analysis
| Challenge | (\~) % CAGR Friction Drag | Geographic Relevance | Mitigation Horizon |
|---|---|---|---|
| Mixed-Fleet Integration Complexity | -1.5 pp | North America; EU; Brazil; Australia | Medium term (2–4 years) |
| Precision-Service Talent Gap | -1.3 pp | North America; EU; India; LATAM | Long term (≥ 4 years) |
| Rural Data Infrastructure Gaps | -1.2 pp | U.S. rural areas; Canada; India; Brazil | Medium term (2–4 years) |
| GNSS Reliability and Cybersecurity | -0.9 pp | Europe; North America; APAC corridors | Medium term (2–4 years) |
| Agronomic Model Localisation | -0.9 pp | India; Africa; LATAM; Southeast Asia | Long term (≥ 4 years) |
| Component Supply Volatility | -0.8 pp | Global; APAC manufacturing hubs | Short term (≤ 2 years) |
Geopolitical Impact Analysis
War-Driven Input Costs Accelerate Demand for Precision Application
The Russia–Ukraine war and continuing Middle East conflict are reshaping the Agricultural Variable Rate Technology market by increasing fertilizer, fuel, machinery and logistics costs. These pressures are making input efficiency more important for commercial farms. Variable-rate fertilizer, seeding and spraying systems can help growers apply inputs only where field conditions require them, reducing waste while protecting margins.
The European Commission reported that EU nitrogen fertilizer prices in April 2026 were 71% above the 2024 average, while natural gas availability can determine about 70% of nitrogen-fertilizer production costs. The Commission also noted that fertilizer prices had remained volatile since Russia’s invasion of Ukraine and rose again during the 2026 Middle East crisis.
The World Bank reported that its fertilizer price index increased by more than 12% in the first quarter of 2026 and projected an increase of more than 30% for the full year. This environment supports demand for GPS-guided spreaders, sensors, prescription software and automated rate controllers. However, high equipment costs and uncertain farm income can delay adoption, especially among smaller producers. Government support for precision farming and input-efficiency programs may therefore become increasingly important over the coming production cycles.
Regional Insights
North America Leads with 43.20% Share and 2.46 BN Value, While Asia Pacific Accelerates Smart-Farming Adoption
In 2025, North America held a dominant position in the Agricultural Variable Rate Technology Market, capturing more than a 43.20% share and reaching 2.46 BN in value. The region benefits from large mechanized farms, GPS-enabled equipment, strong digital connectivity, and widespread use of precision input management.
- USDA reported that 22% of U.S. farms used precision-agriculture practices in 2025, including GPS guidance, soil mapping and variable-rate applications. Adoption reached 50% in North Dakota and 41% in South Dakota, two major crop-producing states. In addition, 85% of U.S. farms had internet access, 82% used smartphones, and 74% had cellular internet connections, supporting connected VRT equipment and cloud-based prescription platforms.
Asia Pacific is developing as a fast-growing regional market as governments increase support for smart machinery, sensors, digital field management and precision input application. China’s National Smart Agriculture Action Plan 2024–2028 promotes intelligent water and fertilizer management, digital farm machinery, crop monitoring and AI-based decision systems. By the end of 2028, China aims to develop and promote more than 20 agricultural algorithms, general software tools or SaaS services, creating opportunities for VRT controllers, sensors and farm-management platforms.
Key Regions and Countries Insights
- North America
- US
- Canada
- Europe
- Germany
- France
- The UK
- Spain
- Italy
- Rest of Europe
- Asia Pacific
- China
- Japan
- South Korea
- India
- Australia
- Rest of APAC
- Latin America
- Brazil
- Mexico
- Rest of Latin America
- Middle East & Africa
- GCC
- South Africa
- Rest of MEA
Key Players Analysis
Deere & Company strengthens its Agricultural Variable Rate Technology position through GPS guidance, Rate Controller systems, ExactShot and See & Spray technology. During 2025, See & Spray operated across more than 5 million acres, cutting non-residual herbicide use by nearly 50% and saving about 31 million gallons of spray mixture. Deere generated US$45.684 billion in worldwide net sales and revenues during fiscal 2025. Its Production & Precision Agriculture business continues integrating cameras, machine learning, prescription mapping and automated application control.
Trimble Inc. supports Agricultural Variable Rate Technology through GNSS positioning, correction services, guidance and connected precision-agriculture technologies. In March 2025, Trimble and PTx Trimble introduced IonoGuard, designed to maintain RTK GNSS positioning during solar and ionospheric disturbances that peak roughly every 11 years. Precision positioning supports accurate seeding, spraying and fertilizer-rate control. Trimble generated US$3.587 billion in revenue during 2025, including US$2.452 billion from subscriptions and services, while annualized recurring revenue reached US$2.39 billion.
AGCO Corporation has expanded its variable-rate technology business through PTx, combining Precision Planting, PTx Trimble and other precision-agriculture technologies. In 2025, PTx introduced 14 new products covering planting, crop protection and harvesting, while its global PTx Elite dealer network exceeded 70 locations. PTx generated approximately US$860 million in revenue during 2025, with AGCO targeting US$2 billion in annual precision-agriculture revenue by 2029. SymphonyVision can reduce chemical use by as much as 55% through targeted, camera-guided application.
Top Key Players Outlook
- Deere & Company
- Trimble Inc.
- AGCO Corporation
- CNH Industrial N.V.
- Topcon Positioning Systems, Inc.
- Hexagon AB
- Ag Leader Technology
- TeeJet Technologies
- Kubota Corporation
- Valmont Industries, Inc.
- Lindsay Corporation
- Farmers Edge Inc.
- CropX Technologies Ltd.
- Bayer AG (Climate FieldView)
- Sentera Inc.
Recent Developments
- In August 2026, CNH formed a strategic alliance with Bourgault Industries covering precision seeding, air drills, digital controls and high-capacity air carts for North America, Australia and other markets. CNH reported US$18.10 billion in 2025 revenue, US$12.39 billion in Agriculture net sales and US$1.025 billion in R&D expenses.
- In January 2026, Hexagon reported full-year 2025 net sales of approximately €5.4 billion, with around 24,500 employees across 50 countries. These investments and acquisitions strengthen Hexagon’s ability to expand variable-rate fertilization, planting, machine guidance and autonomous field operations.
Report Scope
| Report Features | Description |
|---|---|
| Market Value (2025) | USD 5.7 Bn |
| Forecast Revenue (2035) | USD 17.5 Bn |
| CAGR (2026-2035) | 11.9% |
| Base Year for Estimation | 2025 |
| Historic Period | 2020-2024 |
| Forecast Period | 2026-2035 |
| Report Coverage | Revenue Forecast, Market Dynamics, Competitive Landscape, Recent Developments |
| Segments Covered | By Offering (Hardware, Software, Services), By Technology (Map-Based VRT, Sensor-Based VRT), By Application (Fertilizer VRT, Seeding VRT, Crop-Protection Chemical VRT, Irrigation VRT, Others), By Farm Size (Small Farms, Medium-Sized Farms, Large Farms), By Crop Type (Cereals and Grains, Oilseeds and Pulses, Fruits and Vegetables, Commercial Crops, Others) |
| Regional Analysis | North America – US, Canada; Europe – Germany, France, The UK, Spain, Italy, Rest of Europe; Asia Pacific – China, Japan, South Korea, India, Australia, Singapore, Rest of APAC; Latin America – Brazil, Mexico, Rest of Latin America; Middle East & Africa – GCC, South Africa, Rest of MEA |
| Competitive Landscape | Deere & Company, Trimble Inc., AGCO Corporation, CNH Industrial N.V., Topcon Positioning Systems, Inc., Hexagon AB, Ag Leader Technology, TeeJet Technologies, Kubota Corporation, Valmont Industries, Inc., Lindsay Corporation, Farmers Edge Inc., CropX Technologies Ltd., Bayer AG (Climate FieldView), Sentera Inc. |
| Customization Scope | Customization for segments, region/country-level will be provided. Moreover, additional customization can be done based on the requirements. |
| Purchase Options | We have three licenses to opt for: Single User License, Multi-User License (Up to 5 Users), Corporate Use License (Unlimited User and Printable PDF) |





































