Report Overview
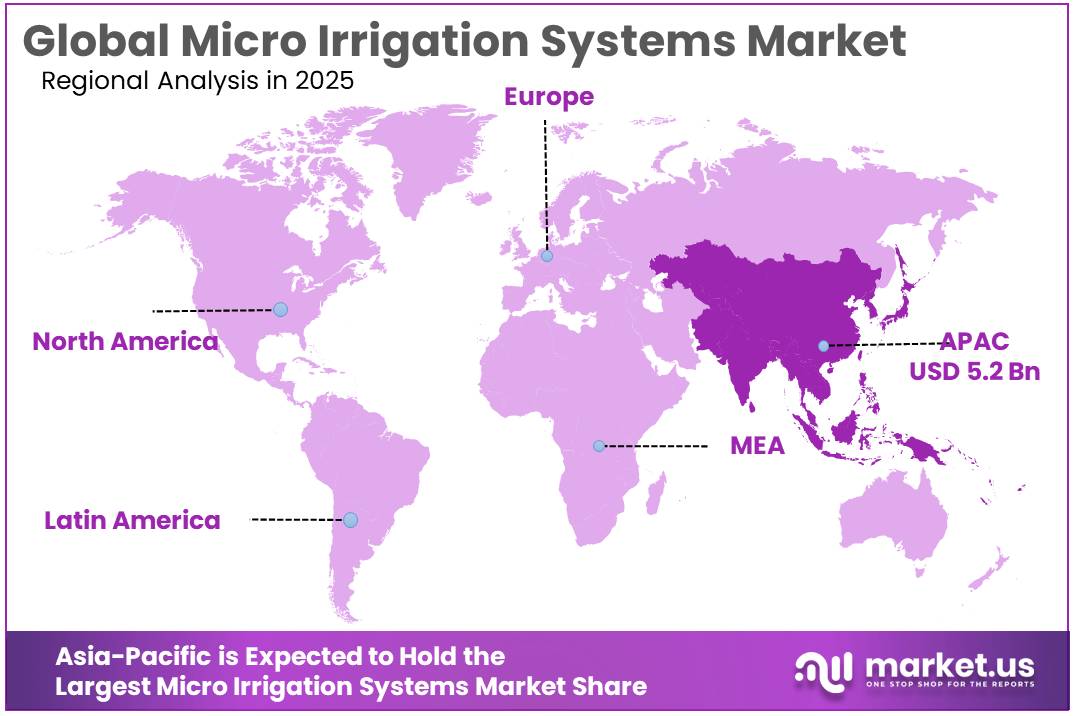
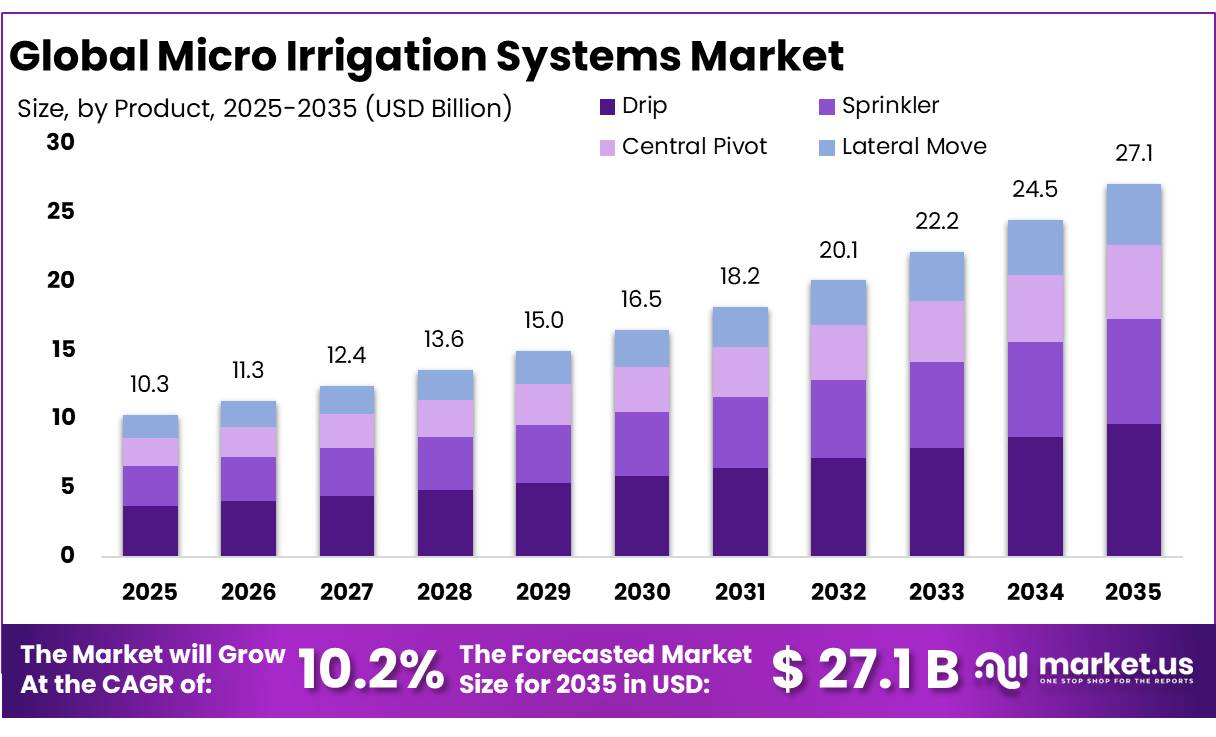
In 2025, the Global Micro Irrigation Systems Market was valued at USD 10.3 billion, and between 2026 and 2035, this market is estimated to register a CAGR of 10.2%, reaching about USD 27.1 billion by 2035. Asia-Pacific held a dominant market position, capturing more than a 51.45% share, holding USD 5.2 billion in revenue.
Micro irrigation systems are becoming a core part of modern precision agriculture because they deliver water directly to crop root zones through drip lines, emitters, subsurface pipes, and micro-sprinklers. Their importance is increasing as water availability becomes less predictable. FAO’s latest AQUASTAT update shows that agriculture accounts for around 72% of global freshwater withdrawals, while renewable freshwater availability per person has fallen by 7% over the past decade. In several water-stressed countries, more than 90% of cultivated land is already equipped for irrigation, highlighting the growing need for efficient water-delivery technologies.
- In July 2026, the Irrigation Association reported that the U.S. irrigation industry contributes more than USD 30 billion in economic output and supports over 200,000 jobs. Technology development is continuing at the same time, with the association’s latest New Product Contest attracting 22 new irrigation products and technologies, including new pressure-compensated dripline solutions for agricultural applications. This innovation is pushing micro irrigation beyond simple pipes toward integrated filtration, fertigation, pressure management, monitoring, and automated control systems.
Key Takeaways
- Micro Irrigation Systems Market was valued at USD 10.3 billion, this market is estimated to register a CAGR of 10.2%, reaching about USD 27.1 billion by 2035.
- Drip held a dominant market position, capturing more than a 35.67% share of the Micro Irrigation Systems Market by product.
- Plantation Crops held a dominant market position, capturing more than a 38.67% share.
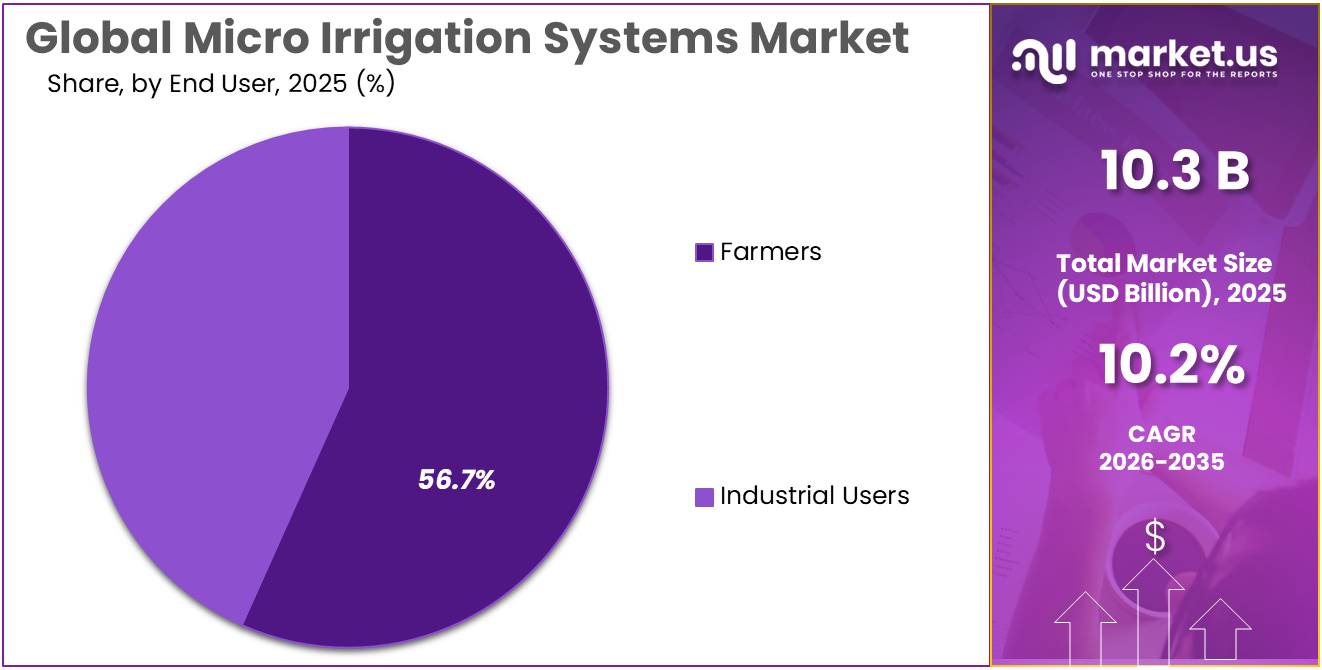
- Farmers held a dominant market position, capturing more than a 56.78% share of the Micro Irrigation Systems Market.
- Asia-Pacific held a dominant position in the Micro Irrigation Systems Market, capturing more than a 51.45% share and generating around USD 5.2 billion.
Commercial adoption is being driven by the need to reduce water losses, control pumping costs, and irrigate difficult terrain more consistently. A recent Rivulis agricultural project in Azerbaijan installed a complete drip irrigation system across 1,250 hectares of hazelnut production. The grower had originally planned to begin with 200 hectares, but expanded the initial order to 400 hectares after the system design was developed. The project combined dripline, filtration, valves, pumps, automation, and fertigation, showing how suppliers are increasingly selling complete irrigation platforms rather than individual components
- Government water-conservation programs are providing another strong industry driver. In June 2026, the U.S. Bureau of Reclamation selected USD 38.9 million in WaterSMART Water and Energy Efficiency Grants for 31 projects across 10 western states. These projects are intended to improve water efficiency and water-supply reliability through infrastructure modernization. Such programs can support demand for automated valves, flow measurement, pipelines, controls, efficient pumping systems, and improved irrigation distribution.
Public funding is increasingly reaching smaller water-management projects as well. In March 2026, the Bureau of Reclamation selected USD 3.7 million for 36 small-scale water-efficiency projects across 13 western states. This creates opportunities for suppliers offering affordable modular systems that combine hardware with digital controls. Over the longer term, micro irrigation is likely to become increasingly connected with precision agriculture as growers seek lower water losses, better nutrient delivery, reduced operating effort, and greater resilience to drought.
By Product Analysis
Drip Irrigation Leads with a 35.67% Market Share
In 2025, Drip held a dominant market position, capturing more than a 35.67% share of the Micro Irrigation Systems Market by product. Its leadership is supported by the ability to supply water close to the crop root zone, limit unnecessary surface wetting, and improve control over irrigation in water-stressed farming areas. Government research also supports its performance.
- In 2025, the USDA Agricultural Research Service reported that mobile drip irrigation produced 35% greater watermelon yields than low-elevation spray application in field research conducted in Texas. USDA NRCS also documented the installation of drip irrigation on a 40-acre pumpkin field in Utah during 2025, showing growing practical adoption of high-efficiency drip systems.
Sprinkler is the fastest growing segment in the Micro Irrigation Systems Market. Its growth is supported by its suitability for large and uneven agricultural fields, flexible water distribution, and compatibility with automated irrigation equipment. Sprinkler systems can provide relatively uniform application while reducing runoff when properly designed and managed. Their ability to support crop irrigation, climate control, and the application of nutrients or agricultural chemicals also increases their usefulness across different farming operations.
By Crop Type Analysis
Plantation Crops Lead with a 38.67% Share as Precision Irrigation Supports Perennial Farming
In 2025, Plantation Crops held a dominant market position, capturing more than a 38.67% share of the Micro Irrigation Systems Market by crop type. Plantation crops such as coffee, cocoa, coconut, tea, and rubber require controlled and regular water supply over long production cycles, which supports the use of drip and other micro-irrigation systems. Government data also shows the importance of irrigation in major plantation crops.
- The USDA Foreign Agricultural Service forecast Brazil’s coffee production for 2025/26 at 65 million 60-kg bags, while robusta/conilon output was projected at 24.1 million bags, supported partly by effective irrigation techniques. This shows how better irrigation management can help plantation growers maintain production and manage changing rainfall conditions.
Orchard Crops is the fastest growing segment in the Micro Irrigation Systems Market by crop type. In 2025, adoption continued to strengthen because fruit orchards need controlled moisture around individual trees for healthy root development, flowering, and fruit formation. Drip and micro-sprinkler systems are well suited to orchard layouts because water can be delivered directly to selected root zones instead of wetting the entire field. This approach can also support fertilizer application through irrigation systems and make watering easier across widely spaced trees.
By End User Analysis
Farmers Lead with 56.78% Share as Efficient Irrigation Cuts Water Use
In 2025, Farmers held a dominant market position, capturing more than a 56.78% share of the Micro Irrigation Systems Market by end user. Farmers remain the main users because drip and micro-irrigation systems help deliver water directly to crop root zones, improve field-level water control, and support production during dry conditions.
- In 2025, USDA NRCS reported that a Utah farmer installed drip irrigation across a 40-acre pumpkin field with support from the Environmental Quality Incentives Program. The farmer estimated that the system could save nearly 80 feet of water during the season compared with the previous flood-irrigation approach. Such measurable water savings, together with government financial and technical assistance, continue to encourage farmers to move toward precision irrigation systems.
Industrial Users are an expanding end-user segment in the Micro Irrigation Systems Market. In 2026, adoption is being supported by larger commercial agricultural operations, nurseries, managed growing facilities, and other users that need accurate and repeatable water delivery. Micro-irrigation helps these operations control water application around specific production areas while reducing unnecessary runoff and evaporation.
Key Market Segments
By Product
- Sprinkler
- Drip
- Central Pivot
- Lateral Move
By Crop Type
- Plantation Crops
- Orchard Crops
- Field Crops
- Forage & Grass
- Others
By End User
- Farmers
- Industrial Users
Driver Analysis
Water stress and allocation controls
Water scarcity is the largest near-term demand trigger because agriculture accounts for roughly 72% of global freshwater withdrawals, placing irrigation systems directly in the path of water-allocation restrictions, groundwater controls, drought emergency measures, and higher pumping costs. Micro irrigation shifts irrigation from field-level distribution to controlled root-zone application: a well-designed and maintained system can reach about 90% application efficiency, versus historically below 50% for conventional surface irrigation, although farm-level “water savings” must be measured against actual consumptive use rather than simply reduced withdrawals.
The strongest conversion pipeline is therefore expected in water-stressed, commercially farmed corridors India’s groundwater-dependent belts, China’s northern agricultural regions, the U.S. West, the Mediterranean, and MENA where drought changes irrigation from a seasonal operating decision into a compliance- and continuity-critical asset.
Drivers Impact Analysis
| Driver | (~) % Impact on CAGR | Geographic Relevance | Impact Timeline |
|---|---|---|---|
| Water stress and allocation controls | +2.1 pts | MENA, India, China, U.S. West, Mediterranean EU | Short term (≤ 2 years) |
| Subsidies and conservation compliance | +1.6 pts | India, EU, U.S., Morocco, China | Short term (≤ 2 years) |
| High-value horticulture expansion | +1.4 pts | APAC, Mediterranean EU, Latin America, MENA | Medium term (2–4 years) |
| Automation, fertigation and sensors | +1.3 pts | North America, EU, Israel, Australia, China | Medium term (2–4 years) |
| Climate-resilient protected cultivation | +1.1 pts | Gulf, China, India, EU, Latin America | Medium term (2–4 years) |
| Reclaimed-water irrigation networks | +0.8 pts | Israel, Gulf, Spain, California, Australia | Long term (≥ 4 years) |
Restraint Analysis
Upfront Cost and Weak Credit
Micro-irrigation is capital-intensive at the moment of adoption because a functional installation requires laterals, emitters, main and sub-main pipes, filters, pressure regulators, valves, pumps or pump integration, fittings, field design, and labour before the first revenue benefit is realized; this disproportionately excludes smallholders with seasonal income and limited collateral. Evidence from recent irrigation-adoption work in Andhra Pradesh identifies limited subsidy availability and high upfront cost as material adoption barriers, while IFPRI’s 2026 assessment emphasizes that investment price is only one constraint alongside water access, information, local supply, and repair availability.
The financing pressure has intensified amid higher farm production costs and tighter liquidity: USDA reported that real U.S. farm debt was forecast to rise 3.2% in 2026, versus 1.0% growth in equity, illustrating how debt growth can outpace balance-sheet improvement even in a developed market. Commercially, the result is delayed CapEx, smaller-than-optimal installations, and a bias toward low-cost thin-wall drip rather than higher-margin pressure-compensating, filtered, automated systems; the estimated -2.0-point CAGR drag is most pronounced in India, Sub-Saharan Africa, Southeast Asia, and Latin America, where equipment finance, land tenure documentation, and predictable crop cash flows remain uneven.
Restraint Impact Analysis
| Restraint | (~) % Impact on CAGR | Geographic Relevance | Impact Timeline |
|---|---|---|---|
| Upfront cost and weak credit | -2.0 pts | India, Africa, LATAM, SE Asia | Short term (≤ 2 years) |
| Subsidy-payment delays | -1.4 pts | India, MENA, LATAM, Africa | Short term (≤ 2 years) |
| Clogging and upkeep burden | -1.3 pts | India, MENA, Africa, China | Medium term (2–4 years) |
| Fragmented farm parcels | -1.1 pts | South Asia, SE Asia, Africa, EU South | Long term (≥ 4 years) |
| Input-cost and freight volatility | -0.9 pts | Import-dependent APAC, MENA, Africa, LATAM | Short term (≤ 2 years) |
| Weak digital-service coverage | -0.8 pts | Rural Africa, India, LATAM, SE Asia | Medium term (2–4 years) |
Opportunity Analysis
Irrigation-as-a-Service
A provider could retain ownership of the pump, filter, controller, and drip network; recover capital through 3–5 crop cycles; bundle maintenance and agronomy; and use flow-meter data to control default risk, creating recurring revenue rather than a one-time equipment gross margin. Existing evidence from Uganda shows public programmes subsidizing 25%–75% of micro-scale irrigation equipment costs, while private solar-irrigation providers in Ghana have used pay-as-you-own models, validating the commercial need for staged payment rather than cash purchase.
The modeled +2.0-point upside arises from expanding addressable demand among smallholders and tenant growers, improving installation conversion, and increasing lifetime revenue per farm, but success requires manufacturers to partner with MFIs, insurers, fintech firms, input distributors, and local service operators rather than carrying unsecured receivables directly on their own balance sheets.
Opportunity Impact Analysis
| Opportunity | (~) % Potential CAGR | Geographic Relevance | Execution Window |
|---|---|---|---|
| Irrigation-as-a-Service | +2.0 pts | India, Africa, LATAM, SE Asia | Short term (≤ 2 years) |
| Reclaimed-water packages | +1.6 pts | Gulf, Spain, Israel, California, Australia | Medium term (2–4 years) |
| Broadacre subsurface drip | +1.5 pts | U.S., Brazil, Australia, China, India | Medium term (2–4 years) |
| Agronomy-data subscriptions | +1.3 pts | North America, EU, Israel, China, Australia | Short term (≤ 2 years) |
| Controlled-environment systems | +1.2 pts | Gulf, China, India, EU, North America | Medium term (2–4 years) |
| Circular aftermarket roll-ups | +0.8 pts | EU, North America, APAC core | Long term (≥ 4 years) |
Challenges Analysis
Hydraulic Design Variability
FAO technical guidance identifies water source, pumping equipment, control valves, filtration, mains, sub-mains, laterals, emitters, and fertigation equipment as interdependent system components, while pressure losses occur through hoses, fittings, elevation changes, pipe friction, and flow variation across laterals.
A poorly designed system may still be sold and commissioned, but non-uniform delivery can reduce crop consistency, increase energy consumption, and generate grower dissatisfaction that weakens replacement and referral demand; an internal scenario model indicates that a 10%–15% shortfall in application uniformity can erase much of the expected water-saving value for a high-value crop block.
The estimated -1.3-point friction is therefore most material in India, Africa, MENA, and Latin America, where heterogeneous small plots and variable pumping conditions increase engineering complexity; mitigation requires digital design tools, standardized hydraulic audits, pressure-compensating configurations, dealer certification, and post-installation uniformity testing rather than competing solely on per-hectare hardware price.
Challenges Impact Analysis
| Challenge | (~) % CAGR Friction Drag | Geographic Relevance | Mitigation Horizon |
|---|---|---|---|
| Hydraulic Design Variability | -1.3 pts | India, Africa, MENA, LATAM | Medium term (2–4 years) |
| Installer Skills Gap | -1.2 pts | India, Africa, SE Asia, LATAM | Long term (≥ 4 years) |
| Water Quality Uncertainty | -1.1 pts | MENA, India, China, Africa, Australia | Medium term (2–4 years) |
| Component Quality Fragmentation | -1.0 pts | APAC, Africa, LATAM, MENA | Medium term (2–4 years) |
| Seasonal Supply Volatility | -0.9 pts | Import-dependent APAC, Africa, MENA, LATAM | Short term (≤ 2 years) |
| Data Interoperability Gaps | -0.7 pts | North America, EU, China, Australia | Medium term (2–4 years) |
Geopolitical Impact Analysis
War Disruptions Raise Costs but Accelerate Irrigation Reconstruction
Ongoing wars are creating a mixed impact on the Micro Irrigation Systems Market. The 2026 Middle East conflict disrupted shipping and energy flows through the Strait of Hormuz, increasing pressure on transport, plastics, pumps, fertilizers, and other farm inputs used alongside irrigation equipment.
- UNCTAD reported that ship transits through Hormuz fell by more than 95% during the disruption, showing how quickly agricultural supply chains can be affected. Higher logistics and energy costs can raise installation and operating expenses for drip and sprinkler systems, especially in import-dependent countries.
Conflict is also damaging irrigation assets directly. FAO reported in 2026 that about 87% of agricultural wells in Gaza remained damaged, limiting farmers’ ability to restore irrigated crop production. In Ukraine, war-related damage and water-security concerns are pushing investment toward rebuilding and modernizing irrigation.
- In April 2026, Ukraine’s government increased compensation for eligible irrigation and land-reclamation costs in frontline territories to as much as 80%.
These conditions are creating short-term supply and affordability problems for micro-irrigation suppliers, but they are also generating longer-term demand for efficient systems, replacement equipment, water-saving technologies, and reconstruction projects where damaged agricultural infrastructure must be restored. This should keep resilient irrigation investment increasingly important across vulnerable farming regions.
Regional Insights
Asia-Pacific Leads Micro Irrigation Systems Market with 51.45% Share and USD 5.2 Billion Revenue
In 2025, Asia-Pacific held a dominant position in the Micro Irrigation Systems Market, capturing more than a 51.45% share and generating around USD 5.2 billion in revenue. The region’s leadership is supported by its large agricultural base, increasing pressure on freshwater resources, and wider government investment in efficient irrigation infrastructure. China remains an important contributor to this trend.
- In September 2025, government data showed that China’s water-saving irrigation area had reached 638 million mu, while land covered by drip and micro-sprinkler irrigation exceeded 100 million mu. Average irrigation water use also declined to 342 cubic metres per mu, reflecting stronger adoption of water-efficient farming systems.
In Australia, the government completed a USD 124 million-equivalent irrigation modernization project in July 2025 covering more than 190,000 hectares of irrigated agricultural land, including upgraded meters, automated regulators, channels, and pipelines. In 2026, FAO also noted that agriculture accounts for more than 90% of total water withdrawals in several Asia-Pacific countries, strengthening the need for precision irrigation technologies. These conditions continue to support strong demand for drip, micro-sprinkler, automation, and water-management systems across the region.