


Report Overview
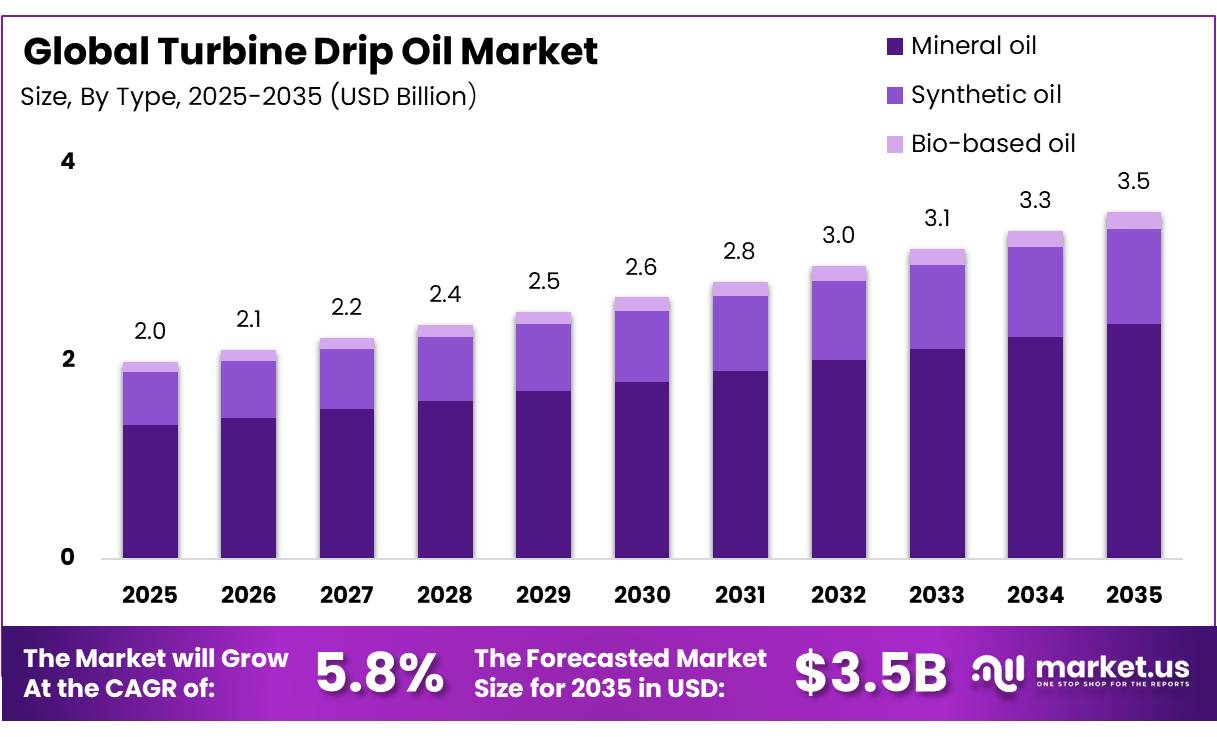
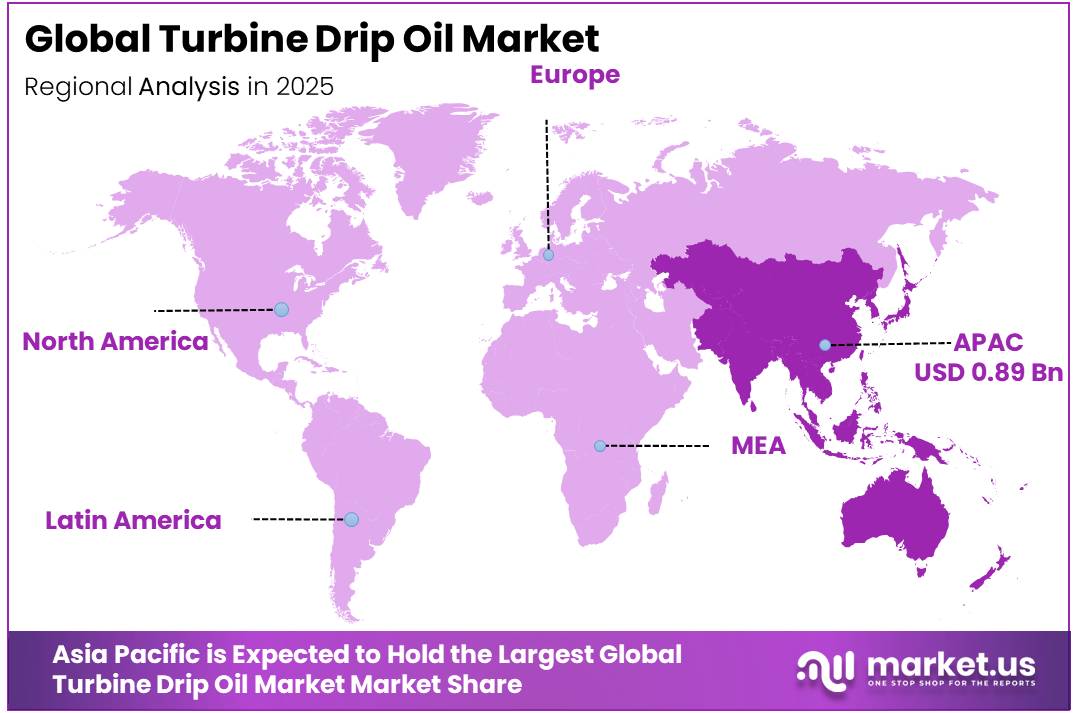
In 2025, the Turbine Drip Oil Market was valued at USD 2.0 Billion, and between 2026 and 2035, this market is estimated to register a CAGR of 5.8%, reaching about USD 3.5 Billion by 2035. Asia-Pacific held a dominant market position, capturing more than a 44.60% share, holding USD 0.89 Billion in revenue.
Turbine drip oil is a specialized lubricant formulated to coat and protect turbine bearings, shafts, and gears from corrosion, oxidation, and wear during shutdown or standby periods when a turbine’s primary lubrication circulation system is inactive. It is used across steam, gas, and wind turbines deployed in power generation, industrial processing, and marine propulsion applications. As global electricity generation infrastructure expands and turbine fleets age, protective drip lubrication during idle cycles is becoming an integral part of turbine maintenance and reliability programs worldwide.
- According to the International Renewable Energy Agency (IRENA), global renewable power capacity reached 4,448 gigawatts (GW) in 2024, following an addition of 585 GW, representing 15.1% growth over the previous year. Within this total, wind energy capacity reached 1,133 GW and hydropower capacity reached 1,283 GW by the end of 2024. This expanding generation base enlarges the pool of equipment requiring protective drip lubrication.
Driving factors include rising installed turbine capacity, extended equipment lifecycles, and greater focus on corrosion prevention during downtime. The International Energy Agency (IEA) projects that renewable power generation capacity will rise from 4,250 GW to nearly 10,000 GW by 2030 under its Stated Policies Scenario, following the addition of more than 560 GW of new renewables capacity in 2023 alone. This sustained buildout creates growth opportunities for manufacturers supplying protective drip oil formulations.
Government initiatives supporting turbine deployment reinforce this addressable base. The United States Department of Energy allocated 29.795 million dollars in fiscal year 2025 for its Wind Energy Technologies Office, funding research and development activities intended to reduce costs and improve reliability of wind turbine systems. Such public investment across major global economies is expected to steadily sustain long term demand for protective lubrication products including turbine drip oil.
Key Takeaways
- The Global Turbine Drip Oil Market was valued at USD 2.0 billion in 2025.
- The global turbine drip oil market is projected to grow at a CAGR of 5.8% and is estimated to reach USD 3.5 billion by 2035.
- On the basis of grade, Premium dominated the market, constituting 51.0% of the total market share.
- Based on the type, Mineral Oil dominated the market, accounting for 67.8% of the total market share.
- Based on the application, Lubrication dominated the market, accounting for 61.0% of the total market share.
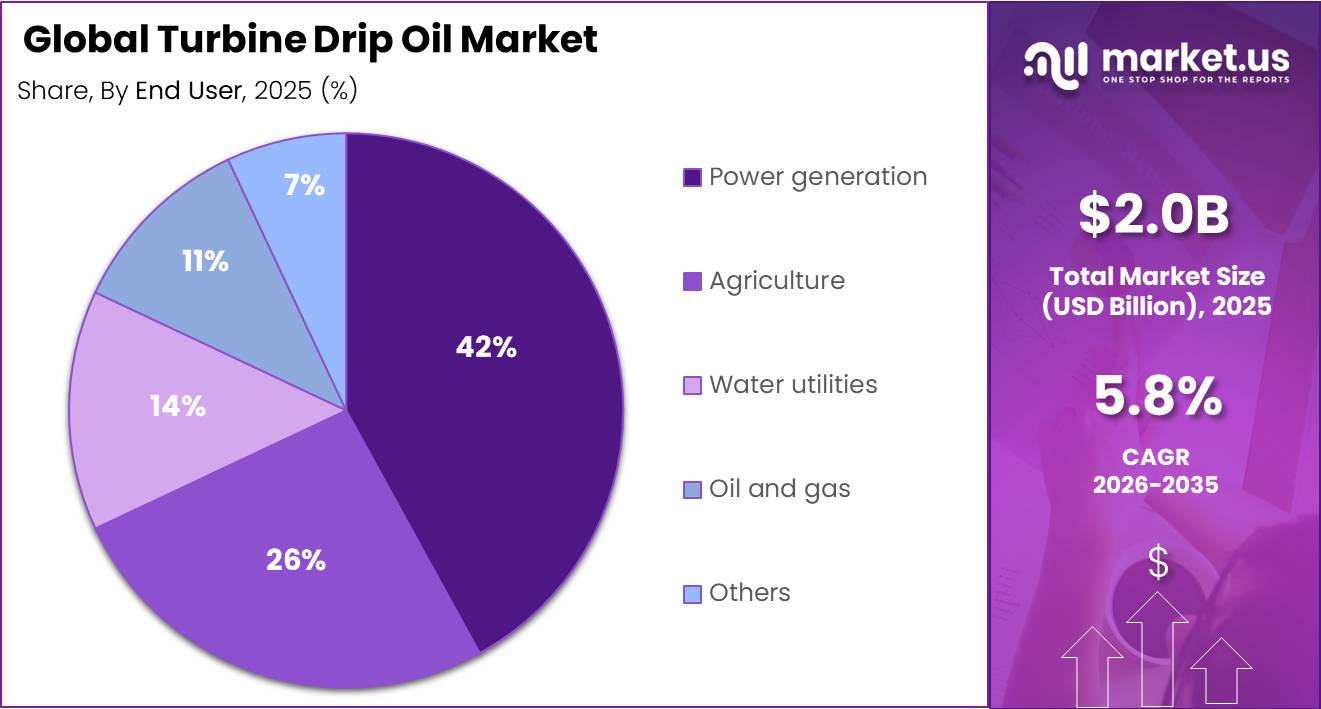
- Based on the end user, Power Generation dominated the market, accounting for 42.0% of the total market share.
- In 2025, Asia Pacific was the most dominant region in the turbine drip oil market, accounting for 44.6% of the global market.
By Grade
Premium dominates with 51% share due to its higher performance and longer equipment protection.
In 2025, Premium held a dominant market position, capturing more than a 51% share of the Turbine Drip Oil Market. The segment maintained its leadership because premium-grade turbine drip oils are widely preferred for critical turbine systems that require reliable lubrication, strong oxidation resistance, and stable performance during continuous operation. End users in power generation and other industrial facilities increasingly prioritize lubricant quality to support equipment reliability and reduce unplanned maintenance.
The Traditional/Conventional segment is expected to witness the fastest growth during the forecast period, supported by its continued use across cost-sensitive industrial operations where standard lubrication performance is sufficient.
By Type
Mineral oil dominates with 67.8% share owing to its broad industrial acceptance and dependable lubrication performance.
In 2025, Mineral oil held a dominant market position, capturing more than a 67.8% share of the Turbine Drip Oil Market. The segment remained the preferred choice because mineral oil-based turbine drip oils offer dependable lubrication, stable operating performance, and wide compatibility with a broad range of turbine systems. Their long-standing use across industrial facilities, power generation plants, and utility operations has supported consistent demand.
The Synthetic oil segment is expected to register the fastest growth during the forecast period, supported by increasing demand for lubricants that can perform under more demanding operating conditions. Industrial operators are gradually adopting synthetic formulations to improve oxidation stability, extend lubricant service intervals, and support equipment operating at higher temperatures and varying load conditions.
By Application
Lubrication dominates with 61% share as reliable turbine performance depends on continuous lubrication.
In 2025, Lubrication held a dominant market position, capturing more than a 61% share of the Turbine Drip Oil Market. The segment led the market because lubrication is the primary function of turbine drip oil, helping reduce friction, minimize component wear, and maintain smooth operation of rotating equipment. Continuous lubrication is essential for protecting bearings and other moving parts in turbine systems used across power generation, water utilities, and industrial operations. Recommendations from equipment manufacturers and energy industry maintenance practices continue to emphasize proper lubrication to improve equipment reliability and support consistent operating performance.
The Machine oil segment is expected to witness the fastest growth during the forecast period, supported by the increasing use of turbine drip oils in a wider range of industrial machinery beyond conventional turbine systems. Growing attention to equipment reliability, routine maintenance, and longer service life is encouraging industrial operators to use specialized oils for machine components that require dependable lubrication.
By End User
Power generation dominates with 42% share due to the continuous need for reliable turbine lubrication.
In 2025, Power generation held a dominant market position, capturing more than a 42% share of the Turbine Drip Oil Market. The segment accounted for the largest share because turbines are critical assets in electricity generation and require continuous lubrication to maintain safe and efficient operation. Turbine drip oil plays an important role in reducing friction, protecting moving components, and supporting reliable performance during long operating hours.
The Agriculture segment is expected to witness the fastest growth during the forecast period, supported by the increasing use of rotating machinery, irrigation equipment, and engine-driven systems that require dependable lubrication. Farm operators are placing greater attention on preventive maintenance to improve equipment efficiency and reduce downtime during peak agricultural activities. As agricultural mechanization continues to expand and maintenance practices become more structured, the use of turbine drip oil and related lubricants across farming operations is expected to grow steadily in the coming years.
Key Market Segments
By Grade
- Premium
- Traditional/conventional
By Type
- Mineral oil
- Synthetic oil
- Bio-based oil
By Application
- Lubrication
- Machine oil
- Others
By End User
- Agriculture
- Water utilities
- Power generation
- Oil and gas
- Others
Driver Analysis
Gas turbine backlog and peaker cycling lift drip-oil demand
Global electricity demand grew 3.0% in 2025 after 4.4% growth in 2024, while gas generation remained one of the principal balancing resources for fast-rising power loads and intermittent renewable supply, increasing operating pressure on turbine lubrication systems. On the OEM side, GE Vernova reported a 100 GW gas turbine backlog in Q1 2026 versus 83 GW at the end of 2025 and indicated potential expansion toward 110 GW by year-end, showing that the serviceable installed base requiring turbine oil circulation, top-up, leakage control, and outage-related fluid replacement is still rising.
This matters for the turbine drip oil market because each incremental gas turbine commissioned or returned to higher utilization creates recurring demand for seal-area losses, reservoir replenishment, flushing, and contamination management rather than only one-time fill demand; commercially, suppliers capture value through higher-frequency supply contracts, bundled filtration, and outage-linked fluid services, especially in North America, the Middle East, and APAC where new gas capacity continues to support grid reliability.
Drivers Impact Analysis
| Driver | (~) % Impact on CAGR | Geographic Relevance | Impact Timeline |
|---|---|---|---|
| Gas turbine backlog and peaker cycling lift drip-oil demand | +1.9% | North America core, Middle East, APAC gas-build corridors, selective EU balancing markets | Short term (≤ 2 years) |
| Wind gearbox monitoring and failure prevention expand specialty oil consumption | +1.6% | EU wind belt, China, U.S. onshore repower clusters, Latin America spill-over | Short term (≤ 2 years) |
| Stricter emissions, wastewater, and chemical compliance accelerate higher-grade lubricant replacement | +1.3% | U.S. utility fleet, EU industrial power assets, OECD service markets | Medium term (2-4 years) |
| Digital oil-condition monitoring shifts buying from volume refill to premium managed fluids | +1.5% | North America, EU, Japan, South Korea, advanced APAC service hubs | Medium term (2-4 years) |
| Renewable variability raises turbine starts, thermal stress, and oil change intensity | +1.4% | EU balancing markets, U.S. ERCOT/PJM/CAISO zones, APAC grids with fast solar growth | Short term (≤ 2 years) |
| Aging steam and hydro turbine fleets sustain retrofit and leakage-control oil demand | +1.1% | Eastern Europe, India, Southeast Asia, Latin America, legacy North America sites | Long term (≥ 4 years) |
Restraint Analysis
Base-oil supply disruptions and price spikes
Group I closures in Europe and capacity rationalization in parts of Asia and the Americas have tightened availability, while higher-value petrochemical streams and fuel margins pull refinery yields away from base oils, contributing to periodic spot price spikes that can exceed 20–30% over quarterly averages for certain viscosity grades and force turbine drip oil blenders into short-notice re-sourcing and reformulation.
For turbine drip oil, which often relies on narrow-cut base stocks to maintain consistent drip rates, volatility in base-oil availability translates directly into elevated production costs, longer lead times, and the need to hold additional safety inventory, compressing gross margins by several hundred basis points and causing some O&M teams to delay non-essential oil changes or switch temporarily to multi-purpose lubricants that do not meet optimal turbine specifications, thereby shaving an estimated 2 percentage points off the otherwise achievable CAGR through price-driven demand destruction and project deferrals.
Restraint Impact Analysis
| Restraint | (~) % Impact on CAGR Forecast | Geographic Relevance | Impact Timeline |
|---|---|---|---|
| Base-oil supply disruptions and price spikes | -2.0% | North America core, EU, APAC refining hubs | Short term (≤ 2 years) |
| Environmental and chemical compliance cost escalation | -1.6% | EU, North America, OECD Asia | Medium term (2-4 years) |
| OEM standard tightening and qualification delays | -1.4% | EU wind belt, U.S., China, Japan | Medium term (2-4 years) |
| Global logistics, tariff, and freight volatility | -1.3% | Global, with higher friction on EU–APAC and Asia–Americas corridors | Short term (≤ 2 years) |
| Customer substitution to extended-drain synthetics | -1.2% | North America, EU, high-spec APAC markets | Long term (≥ 4 years) |
| Working-capital and credit constraints in end-user O&M budgets | -1.1% | Emerging Asia, Latin America, Africa, smaller EU utilities | Short term (≤ 2 years) |
Opportunity Analysis
Wind O&M lubrication-as-a-service bundles
The white space is to contract with major wind asset owners so that lubrication vendors take responsibility for all drivetrain lubrication tasks drip oil supply, centralized lubrication system calibration, oil analysis, and corrective interventions priced on a per‑MW or per‑turbine per‑year basis on top of fluid costs, capturing a slice of an O&M pool where corrective maintenance alone accounts for roughly a third of spend.
If by 2030–2035 even 15–20% of the global wind fleet potentially 120,000–160,000 turbines contracts such bundles, and each contract drives 20–30% higher lifetime revenue per turbine for lubrication vendors with 300–500 basis‑point incremental margins, the market could realize around a 2.2 percentage‑point CAGR uplift relative to a baseline that assumes only commodity lubricant sales into wind with no structured service monetization.
Opportunity Impact Analysis
| Opportunity | (~) % Potential CAGR Upside | Geographic Relevance | Execution Window |
|---|---|---|---|
| Wind O&M lubrication-as-a-service bundles | +2.2% | EU wind belt, North America, China, India | Short term (≤ 2 years) |
| ESG-grade low-toxicity drip oils and green financing | +1.9% | EU, UK, North America core, OECD Asia | Medium term (2-4 years) |
| Integrated digital lubrication platforms for multi-asset fleets | +2.4% | North America, EU, Japan, South Korea, GCC | Medium term (2-4 years) |
| OEM-coengineered life-extension retrofit kits | +1.8% | Eastern Europe, Latin America, India, Southeast Asia | Long term (≥ 4 years) |
| Cross-segment expansion into high-heat industrial drip systems | +1.7% | APAC industrial hubs, global heavy industry belts | Long term (≥ 4 years) |
| Consolidation and roll-up of regional drip-oil specialists | +1.8% | North America mid-tier, EU regional, APAC local players | Medium term (2-4 years) |
Challenges Analysis
Volatile lubricant supply chains
Base‑oil availability is periodically constrained by refinery turnarounds, shifting yield priorities, and outages, while shipping disruptions and corridor bottlenecks—such as multi‑week delays tied to Red Sea risks or canal constraints—can extend transit times by 10–20 days and introduce spot freight surcharges that move delivered cost by 10–30% on short notice for certain lanes.
For turbine drip oil suppliers, this means production plans must incorporate 15–30% higher buffer inventory in critical regions, additive portfolios must be diversified to maintain performance specs when primary suppliers are offline, and pricing must be recalibrated more frequently; at the same time, the need to carry more working capital and accept occasional rush logistics eats into 100–300 basis points of margin and effectively shaves around 1.4 percentage points from otherwise addressable CAGR, a drag that is likely to persist for 2–4 years until new refining, storage, and logistics capacity plus broader supply‑chain diversification strategies restore a more stable operating baseline.
Challenges Impact Analysis
| Challenge | (~) % CAGR Friction Drag | Geographic Relevance | Mitigation Horizon |
|---|---|---|---|
| Volatile lubricant supply chains | -1.4% | North America core, EU, APAC logistics corridors | Medium term (2-4 years) |
| Aging turbines and complex maintenance | -1.2% | Global legacy fleets, especially EU, India, Latin America | Long term (≥ 4 years) |
| Evolving environmental compliance maze | -1.1% | EU regulatory hubs, U.S., OECD Asia | Long term (≥ 4 years) |
| Limited lubrication engineering talent | -1.0% | Global, acute in emerging APAC and MEA | Long term (≥ 4 years) |
| OEM approval and compatibility complexity | -0.9% | North America, EU, China, Japan | Medium term (2-4 years) |
| Long turbine equipment lead times | -0.8% | U.S. demand hotspots, global gas-turbine corridors | Medium term (2-4 years) |
Geopolitical Impact Analysis
Geopolitical tensions reshape turbine drip oil supply chains and increase operating costs.
The ongoing conflict in the Middle East has continued to influence the Turbine Drip Oil Market in 2026 by creating uncertainty across global crude oil and refined petroleum supply chains. Turbine drip oil is produced from base oils and additives that depend on stable refinery operations and reliable international logistics.
- According to the International Energy Agency (IEA), around 20% of global oil supply normally moves through the Strait of Hormuz, making the region a critical route for lubricant feedstocks and refined petroleum products. Continued disruptions have increased shipping risks, insurance costs, and delivery times for industrial lubricants used in power generation and heavy industries.
The IEA also confirmed that 32 member countries approved the release of 400 million barrels of emergency oil stocks to support market stability during the disruption in march 2026. While these measures have helped ease immediate supply pressure, lubricant manufacturers continue to face higher procurement and transportation costs. End users are responding by extending preventive maintenance schedules and optimizing lubricant usage to improve equipment reliability.
Regional Analysis
Asia Pacific Dominates with 44.60% Share and USD 0.89 Billion.
Asia Pacific stands as the dominating region in the global turbine drip oil market, commanding a 44.60% share and a valuation of USD 0.89 billion, reflecting the region’s dense concentration of power generation infrastructure and industrial turbine installations. This regional dominance is supported by the pace of electricity demand and generation capacity growth across major Asia Pacific economies.
- According to the International Energy Agency (IEA), China’s gross electricity demand approached the 10,000 terawatt-hour (TWh) mark by the end of 2024. China alone accounted for 54% of the total growth in global electricity demand recorded during 2024. Southeast Asia also recorded strong momentum, with electricity consumption increasing by more than 7% in 2024, compared with about 4% growth in 2023.
On the generation side, China contributed almost two thirds of all renewable power capacity connected to the electricity grid worldwide in 2024, driving continued expansion of turbine-based generation assets across the wider region. This sustained growth of gas, steam, and renewable power turbines has expanded the installed base of equipment requiring protective drip lubrication during standby and shutdown cycles.
Key Regions and Countries
- North America
- The US
- Canada
- Europe
- Germany
- France
- The UK
- Spain
- Italy
- Russia & CIS
- Rest of Europe
- APAC
- China
- Japan
- South Korea
- India
- ASEAN
- Rest of APAC
- Latin America
- Brazil
- Mexico
- Rest of Latin America
- Middle East & Africa
- GCC
- South Africa
- Rest of MEA
Key Players Analysis
Leading companies in the Turbine Drip Oil Market focus on improving lubricant performance, expanding specialty product portfolios, and strengthening supply chain reliability to maintain their competitive position. A major priority is the development of premium turbine drip oils with improved oxidation stability, corrosion protection, water separation, and long service life to support modern steam, gas, and hydro turbines.
Manufacturers continue refining base oil formulations and additive technologies to meet the operating requirements of power plants, industrial facilities, and utility operators. They also invest in advanced blending facilities, quality assurance systems, and technical testing to ensure consistent product performance under demanding operating conditions. Close collaboration with turbine manufacturers and industrial maintenance teams helps suppliers deliver application-specific lubrication solutions while supporting preventive maintenance programs and equipment reliability.
Companies including Exxon Mobil Corporation, Shell plc, Chevron Corporation, TotalEnergies SE, FUCHS SE, China Petroleum & Chemical Corporation (Sinopec), PetroChina Company Limited, and Mystik Lubricants (CITGO) continue expanding their global distribution networks and strengthening customer support services. Many manufacturers are increasing production efficiency through process modernization while securing stable base oil and additive supplies to reduce the impact of raw material price fluctuations.
The Major Players in The Industry
- Exxon Mobil Corporation
- Shell plc
- Chevron Corporation
- BP p.l.c.
- TotalEnergies SE
- FUCHS SE
- China Petroleum & Chemical Corporation – Sinopec
- PetroChina Company Limited
- Indian Oil Corporation Limited
- Phillips 66
- Petro-Canada Lubricants Inc. – HF Sinclair
- CHS Inc. – Cenex
- CITGO Petroleum Corporation
- Royal Manufacturing Co.
- Mystik Lubricants – CITGO
Key Development
- In March 2026, CITGO Petroleum Corporation reported that its Lubricants business unit delivered its best annual financial performance since 2008 for full-year 2025, generating a Lubricants segment EBITDA of USD 40 million, alongside strong safety performance with only one OSHA recordable incident for the year. The result reflects continued momentum in CITGO’s industrial and private-label lubricants operations across its blending and packaging plants.
- In April 2026, FUCHS SE completed its full acquisition of the OPET FUCHS joint venture, taking 100% ownership of the Istanbul-headquartered lubricants company, including its production plant in Aliaga, Izmir, Turkey. The transaction, based on an agreement signed in February 2026, strengthens FUCHS’s presence in the Turkish industrial, OEM, mining, and automotive aftermarket lubricants sectors; the unit, now operating as FUCHS Lubricants Türkiye, employs around 250 people and is expected to generate revenue of approximately EUR 100 million in the current financial year.
Report Scope
| Report Features | Description |
|---|---|
| Market Value (2025) | USD 2.0 Bn |
| Forecast Revenue (2035) | USD 3.5 Bn |
| CAGR (2026 2035) | 5.8% |
| Base Year for Estimation | 2025 |
| Historic Period | 2020-2024 |
| Forecast Period | 2026-2035 |
| Report Coverage | Revenue Forecast, Market Dynamics, Competitive Landscape, Recent Developments |
| Segments Covered | By Grade (Premium, Traditional/Conventional), By Type (Mineral Oil, Synthetic Oil, Bio-based Oil), By Application (Lubrication, Machine Oil, Others), By End User (Agriculture, Water Utilities, Power Generation, Oil and Gas, Others) |
| Regional Analysis | North America The US & Canada; Europe Germany, France, The UK, Spain, Italy, Russia & CIS, Rest of Europe; APAC China, Japan, South Korea, India, ASEAN & Rest of APAC; Latin America Brazil, Mexico & Rest of Latin America; Middle East & Africa GCC, South Africa, & Rest of MEA |
| Competitive Landscape | Exxon Mobil Corporation, Shell plc, Chevron Corporation, BP p.l.c., TotalEnergies SE, FUCHS SE, China Petroleum & Chemical Corporation (Sinopec), PetroChina Company Limited, Indian Oil Corporation Limited, Phillips 66, Petro-Canada Lubricants Inc. (HF Sinclair), CHS Inc. (Cenex), CITGO Petroleum Corporation, Royal Manufacturing Co., and Mystik Lubricants (CITGO). |
| Customization Scope | Customization for segments, region/country level will be provided. Moreover, additional customization can be done based on the requirements. |
| Purchase Options | We have three licenses to opt for: Single User License, Multi User License (Up to 5 Users), Corporate Use License (Unlimited Users and Printable PDF) |





































