


Report Overview
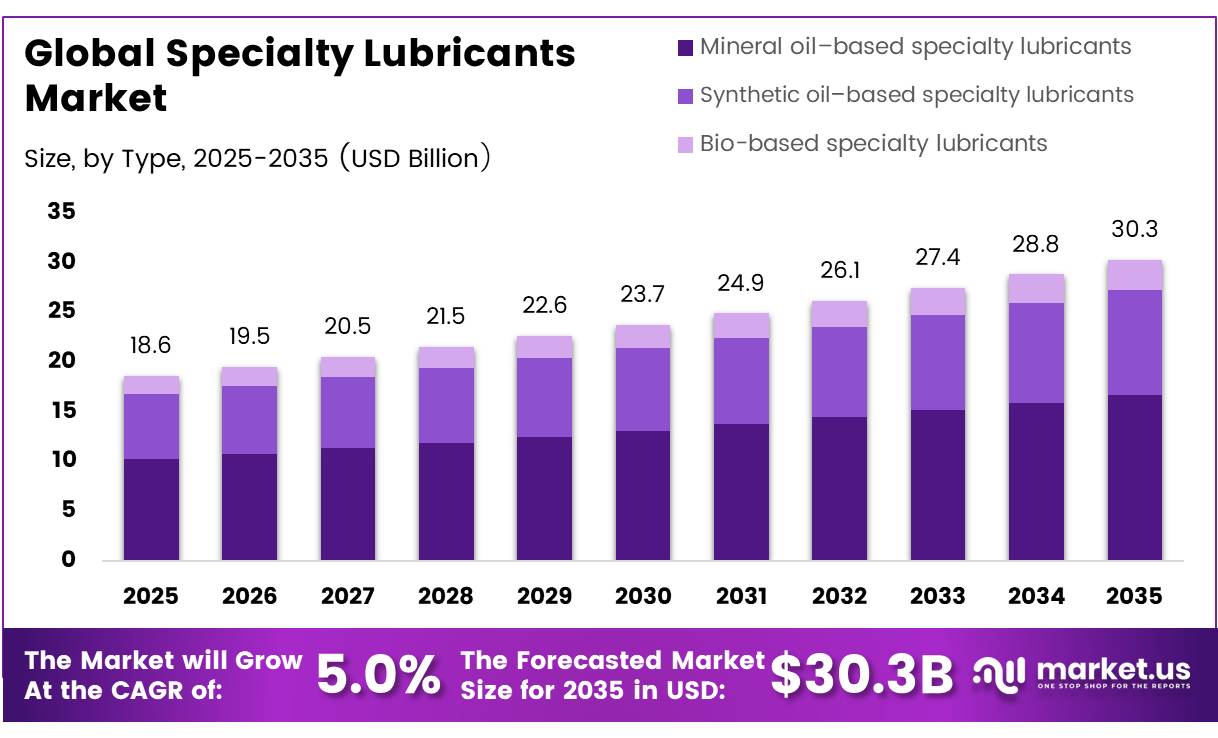
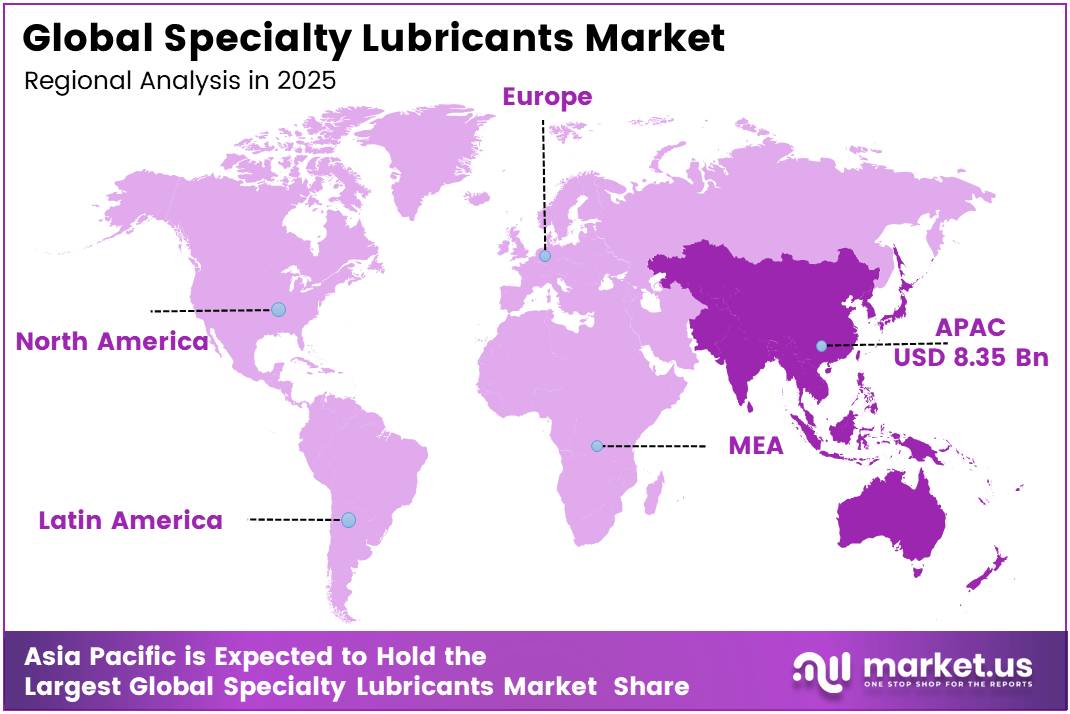
In 2025, the Global Specialty Lubricants Market was valued at US$18.6 billion, and between 2026 and 2035, this market is estimated to register a CAGR of 5.0%, reaching about US$30.3 billion by 2035. In 2025, Asia Pacific led the market, achieving over 40.6% share with a revenue of US$ 8.35 Billion.
The specialty lubricants market represents a critical segment of the global industrial and automotive value chain, enabling friction reduction, thermal management, and equipment protection across high-performance applications where standard lubricants are insufficient. Demand is closely tied to the accelerating electrification of transportation, expansion of precision manufacturing, and growth of renewable energy infrastructure, where increasingly demanding operating conditions require formulation-specific solutions.
Lithium-based greases, synthetic base oils, and bio-derived lubricants represent the primary product categories, with additive chemistry playing a decisive role in extending service intervals, improving load-bearing capacity, and meeting evolving OEM performance certifications.
- The International Energy Agency reported that global electric vehicle sales surpassed 14 million units in 2023, representing approximately 18% of total new car sales globally, with EV-compatible drivetrain fluids and dielectric greases emerging as the fastest-growing specialty lubricant application category within the automotive segment.
Key Takeaways
- The global specialty lubricants market was valued at USD 18.6 billion in 2025.
- The global specialty lubricants market is projected to grow at a CAGR of 5.0% and is estimated to reach USD 30.3 billion by 2035.
- On the basis of end-user, the automotive & transportation sector dominated the global specialty lubricants market, constituting 35.2% of the total market share in 2025.
- Based on the type, mineral oil–based specialty lubricants dominated the global specialty lubricants market, with a substantial market share of around 55.2% in 2025.
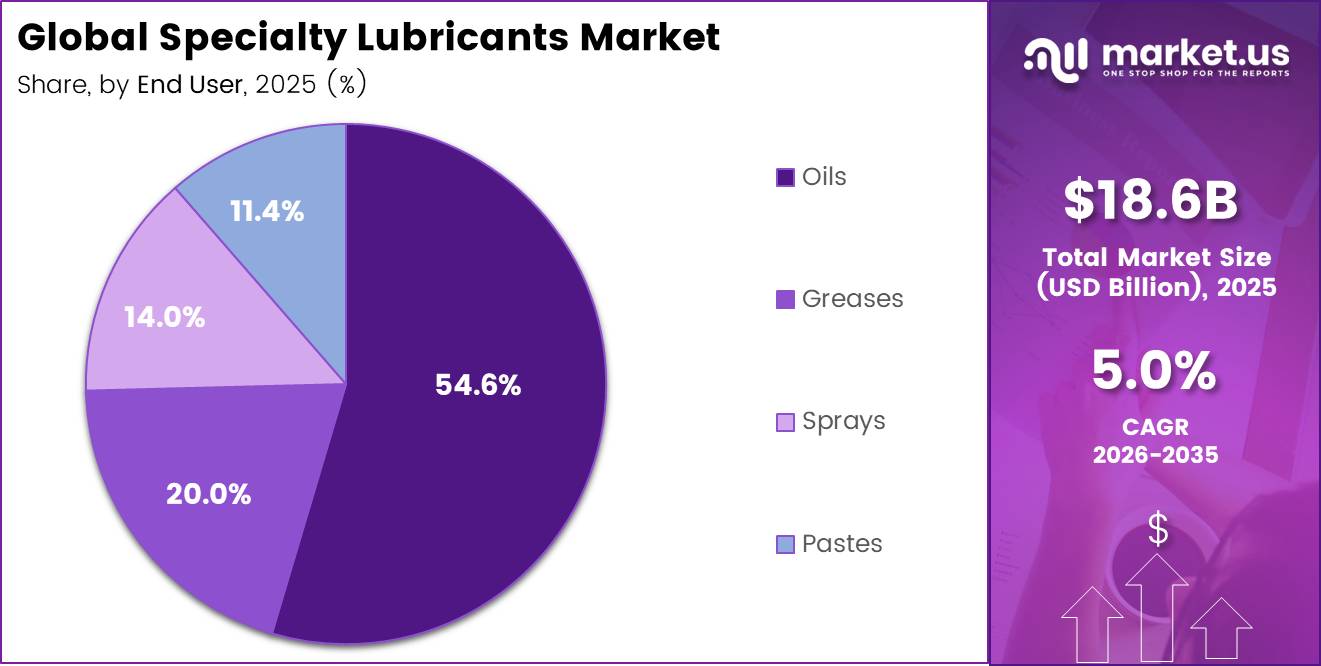
- Based on the form, oils led the global specialty lubricants market, comprising 54.6% of the total market in 2025.
- In 2025, Asia Pacific was the most dominant region in the specialty lubricants market, accounting for 40.6% of the total global consumption.
Consumption and production capacity are heavily concentrated in the Asia Pacific region, which accounts for approximately 40.6% of global specialty lubricant demand, driven by the scale of China’s automotive manufacturing base, India’s expanding industrial machinery sector, and the integrated petrochemical supply chains across Japan and South Korea.
China alone represents the world’s largest single lubricants market by volume, reinforced by its dominance in EV production and battery gigafactory construction. Japan and South Korea retain leadership in high-performance synthetic and semiconductor-compatible lubricant technologies, while India and Southeast Asia are progressively expanding local blending and formulation capabilities under domestic manufacturing incentive frameworks.
- According to the World Economic Forum’s Advanced Manufacturing report, global industrial robot installations reached a record 553,052 units in 2022, with cumulative operational stock surpassing 3.9 million units each requiring precision-grade specialty lubricants for joint, gearbox, and bearing applications across multi-shift production cycles.
Material and formulation innovation is accelerating toward fully synthetic, low-viscosity, and ceramic-additive-enhanced lubricants to meet the thermal endurance and electrical insulation requirements of next-generation EV powertrains, wind turbine drivetrains, and semiconductor fabrication equipment. Simultaneously, expanding regulatory frameworks mandating biodegradable and food-grade certified lubricants across European and North American markets are broadening application requirements and reinforcing long-term structural demand for advanced specialty lubricant technologies globally.
Type Analysis
Mineral oil–based specialty lubricants represents dominant Segment in the Market.
Mineral oil–based specialty lubricants retain majority market share of 55.2% because they serve as the cost-efficient backbone of the installed industrial base across Asia, the Middle East, and Latin America, regions where equipment vintages are older, OEM specifications are less demanding, and total-cost-of-ownership models are less sophisticated.
The Group II and Group III hydrocracked mineral oil segments, commercially positioned as semi-synthetic alternatives at competitive price points, have benefited from capacity expansions at Saudi Aramco’s base oil refining complex in Yanbu, which increased Group II production capacity by approximately 500,000 metric tons per annum in 2024–2025, maintaining supply adequacy and price competitiveness that continues to defend mineral oil’s volume share against synthetic encroachment.
Synthetic lubricants are capturing disproportionate value share in 2025–2026 as OEM drain interval specifications lengthen and as new-generation machinery platforms, wind turbines, EV powertrains, industrial robots, operate at temperature and load conditions that exceed mineral oil performance envelopes. Vestas Wind Systems’ updated maintenance specifications for its V236-15.0 MW offshore turbine platform, released in 2025, mandate fully synthetic gear oils with oxidation stability ratings that no mineral-based formulation can meet
Form Analysis
Oil dominates the Form segment.
Oil formulations dominate the market with 54.6% share because they are compatible with the widest range of lubrication delivery systems, centralized circulation systems, splash lubrication, oil mist systems, and because they can be changed, filtered, and monitored in service without equipment disassembly. The industrial oil segment has also benefited from the growth of oil condition monitoring services, which use sensor technology and laboratory analysis to extend drain intervals, a value-added service model that Shell Lubricants and TotalEnergies have aggressively commercialized through their B2B managed lubrication programs in 2024–2025, deepening customer lock-in and increasing per-account revenue.
Grease is the fastest-growing lubricant form because it is the preferred lubrication solution for sealed-for-life bearing applications, a design philosophy now standard across EV wheel-end assemblies, wind turbine pitch and yaw bearings, and industrial robot joints. The structural shift toward sealed, maintenance-free designs in new equipment platforms is creating a one-time transition demand surge: as legacy equipment is replaced, regreasing points that previously consumed oil products are converted to grease-lubricated sealed units, permanently shifting demand between form categories.
End Use Analysis
Specialty lubricants Are Mostly Utilized in the Automotive & transportation Sector.
The automotive and transportation segment’s with 35.2% share commanding market position is a function of both volume and regulatory intensity. The scale of the installed vehicle base, over 1.4 billion vehicles globally per the International Organization of Motor Vehicle Manufacturers (OICA), creates a structurally recurring demand base that no other end-user segment can match.
For instance, Toyota Motor Corporation’s global service fill specification for its hybrid vehicle lineup mandates a dedicated low-viscosity synthetic engine oil, 0W-8 grade which was initially developed under JASO standards in 2020 and saw expanded global adoption following API approval in September 2023 across all markets, a single OEM requirement that generates recurring certified lubricant demand across tens of millions of vehicles annually.
Industrial machinery and manufacturing is the market’s growth engine in 2025–2026, propelled by the global reshoring of semiconductor fabrication, battery gigafactory construction, and aerospace component manufacturing, all of which operate high-precision equipment requiring specialty lubricants with tight viscosity tolerances and contamination-control specifications.
The U.S. CHIPS and Science Act’s $52 billion semiconductor manufacturing investment program has directly funded the construction of TSMC, Samsung, and Intel facilities in Arizona, Texas, and Ohio respectively, each requiring ultra-clean lubricants for cleanroom-compatible equipment. These facilities represent entirely new, high-value lubricant demand nodes with zero legacy supplier relationships, making them commercially open territory.
Key Market Segments
By Type
- Mineral oil–based specialty lubricants
- Synthetic oil–based specialty lubricants
- Bio‑based specialty lubricants
By Form
- Oils
- Greases
- Sprays
- Pastes
By End Use
- Automotive & transportation
- Industrial machinery & manufacturing
- Construction & heavy equipment
- Food & beverage
- Aerospace & defense
- Others
Driver Analysis
EV thermal management and e-drive fluids demand
Specialty lubricants are gaining incremental share from electrification because EVs replace part of the conventional engine-oil pool with smaller-volume but higher-value fluids used for e-axles, reduction gears, thermal loops, greases, and dielectric cooling systems; this raises revenue intensity per liter even when drain-fill volumes are lower. Global motor vehicle production reached about 96.4 million units in 2025, up 3.9% from 2024, with Asia-Pacific producing roughly 59.2 million units and accounting for more than 61% of output, which matters because China, India, Japan, and Korea are the deepest scaling corridors for EV platforms and component localization.
The market effect is not just more vehicles; it is a formulation shift toward lower conductivity, copper compatibility, oxidation stability, and broader temperature tolerance, which pushes OEM approvals, additive complexity, and validation cycles upward. IMF projected global growth at 3.3% for 2026, supporting fleet replacement and industrial capex, while the center of automotive production remains East Asia, making APAC the main monetization zone for premium EV fluids through 2028
Drivers Impact Analysis
| Driver | (~) % Impact on CAGR Forecast | Geographic Relevance | Impact Timeline |
|---|---|---|---|
| EV thermal management and e-drive fluids demand | +1.4% | China, India, EU, North America core | Medium term (2-4 years) |
| Industrial efficiency, uptime, and food/pharma compliance upgrades | +1.1% | EU, North America core, Japan, Korea, India industrial belts | Short term (≤ 2 years) |
| PFAS and broader chemical compliance reform in high-performance formulations | +0.9% | EU core, North America spill-over, advanced APAC export corridors | Medium term (2-4 years) |
| Aerospace recovery and next-gen turbine/hydraulic lubricant qualification | +0.8% | North America core, EU, Middle East hubs, India spill-over | Medium term (2-4 years) |
| Crude oil normalization and refining capacity shifts improving premium blend economics | +0.7% | APAC corridors, U.S. Gulf, EU import-dependent markets | Short term (≤ 2 years) |
| Automotive production rebound and high-load commercial equipment utilization | +1.0% | China, India, ASEAN, Mexico, Central Europe | Short term (≤ 2 years) |
Restraint Analysis
Base oil/feedstock volatility
Specialty lubricants remain structurally exposed to petroleum-linked input swings because even high-value synthetic and semi-synthetic formulations still depend on base stocks, refinery intermediates, and additive packages whose pricing resets against crude and refined-product spreads; in 1Q26, Brent moved from $61/b to $118/b, while U.S. diesel reached $5.40/gal and New York Harbor distillate crack spreads averaged $1.42/gal versus a 2021-25 average of $0.68/gal, signaling a sharp escalation in hydrocarbon conversion economics rather than a temporary spot anomaly.
For specialty suppliers, that translates into an estimated 8-14% uplift in raw-material basket costs on quarterly contracts, roughly 150-300 basis points of EBITDA margin compression when pass-through lags by one to two quarters, and a demand-side drag where OEMs and industrial buyers postpone lubricant upgrades, requalify cheaper alternatives, or extend drain intervals, which together justifies about a -1.4 percentage point deduction to 2026 baseline CAGR in markets most tied to imported feedstocks or merchant base-oil procurement.
Restraint Impact Analysis
| Restraint | (~) % Impact on CAGR Forecast | Geographic Relevance | Impact Timeline |
|---|---|---|---|
| Base oil/feedstock volatility | -1.4% | North America core, EU, APAC importers | Short term (≤ 2 years) |
| PFAS/regulatory reformulation pressure | -1.1% | EU core, UK alignment markets, premium export corridors | Medium term (2-4 years) |
| Industrial chemical cost inflation | -0.9% | North America, EU, Northeast Asia | Short term (≤ 2 years) |
| Logistics and transit disruption | -0.8% | Europe-Middle East-Asia corridors, import-dependent APAC | Short term (≤ 2 years) |
| End-user CapEx deferrals | -0.7% | EU manufacturing belt, North America heavy industry, China-linked export chains | Medium term (2-4 years) |
| Compliance and wastewater burden | -0.6% | EU core, advanced industrial clusters globally | Long term (≥ 4 years) |
Opportunity Analysis
Wind gearbox reliability fluids
This qualifies as an untapped opportunity because current baseline lubricant demand counts only normal industrial activity, while wind-turbine gearbox reliability fluids represent a targeted adjacent vertical built on lowering lifetime failure costs in a sector with chronic drivetrain stress and high maintenance penalties. The value pool is attractive because lubricant spend is tiny relative to gearbox replacement or crane-based service events, so a formulation that extends drain intervals by 30% to 50% or reduces unscheduled drivetrain interventions by even 5% to 10% can support price premiums of 20% to 35% while still offering strong customer ROI; that makes this a specification-upgrade and service-attachment opportunity, not a generic volume-growth story.
With wind fleets aging in the U.S. and EU while India and China continue adding installed capacity, suppliers that combine fluid chemistry, oil analytics, and warranty-backed performance contracts could unlock around 0.7 percentage points of incremental CAGR above baseline by converting turbine operators from transactional procurement to reliability-led lifecycle purchasing.
Opportunity Impact Analysis
| Opportunity | (~) % Potential CAGR Upside | Geographic Relevance | Execution Window |
|---|---|---|---|
| EV thermal fluids platforms | +1.4% | China, EU, U.S., Korea | Short term (≤ 2 years) |
| EAL marine conversion | +0.9% | North America core, EU ports, Asia shipyards | Short term (≤ 2 years) |
| Wind gearbox reliability fluids | +0.7% | U.S., EU, China, India | Medium term (2-4 years) |
| Semiconductor fab chem-lube bundles | +1.1% | U.S., Taiwan, Korea, Japan, EU | Medium term (2-4 years) |
| PFAS-free reformulation premium | +0.8% | EU core, UK, North America | Medium term (2-4 years) |
| Aerospace electrification niches | +0.6% | EU, U.S., advanced APAC | Long term (≥ 4 years) |
Challenges Analysis
Additive Chain Fragility
Specialty lubricants depend on small-volume, high-function additive packages whose risk lies in concentration rather than total market tonnage, with antioxidants, antiwear chemistries, corrosion inhibitors, viscosity modifiers, and specialty esters frequently sourced through a narrow set of qualified plants and export corridors, so even when end-market demand remains intact the operational friction emerges through long replenishment tails, partial-order fulfillment, and reformulation risk; government evidence of rising industrial chemical and basic inorganic chemical producer prices in 2026, together with freight-system dependence documented by BTS commodity-flow and port-performance frameworks, implies that a 5% to 8% disruption in upstream additive output can translate into 10% to 15% service-level deterioration for niche finished lubricants because many SKUs cannot be substituted one-for-one, resulting in 2 to 6 week lead-time extensions, 1% to 3% batch rescheduling losses, and expedited logistics cost uplifts of 15% to 40%, which supports a modeled -1.1 percentage point CAGR friction drag until suppliers broaden dual-qualification programs, regionalize critical additive inventories, and reduce single-plant dependency in the U.S. Gulf, EU chemical nodes, and Northeast Asia.
Challenges Impact Analysis
| Challenge | (~) % CAGR Friction Drag | Geographic Relevance | Mitigation Horizon |
|---|---|---|---|
| Feedstock Cost Whiplash | -1.4% | North America core, EU blending hubs, APAC import markets | Medium term (2-4 years) |
| Additive Chain Fragility | -1.1% | EU regulatory hubs, U.S. Gulf Coast, China-Korea-Japan corridor | Medium term (2-4 years) |
| Formulation Talent Bottleneck | -0.8% | North America core, Western Europe, advanced APAC manufacturing clusters | Long term (≥ 4 years) |
| Qualification Cycle Elongation | -0.9% | Automotive and industrial OEM clusters in NA, EU, Japan, Korea | Long term (≥ 4 years) |
| Compliance Data Burden | -0.7% | EU regulatory hubs, North America core, export-facing APAC suppliers | Medium term (2-4 years) |
| Logistics Resilience Gaps | -1.0% | U.S. port gateways, EU inland corridors, Southeast Asia shipping lanes | Short term (≤ 2 years) |
Geopolitical Impact Analysis
Red Sea disruption is repricing the Asia-Europe supply corridor.
The Houthi attacks on commercial shipping in the Red Sea, which escalated through late 2023 and have persisted into 2025 despite U.S. and allied naval operations under Operation Prosperity Guardian, have forced the majority of Asia-Europe container traffic onto the Cape of Good Hope route, adding 10–14 days of transit time and 20–30% to freight costs per container.
For specialty lubricant shipments originating from Asian blending facilities destined for European industrial customers, this freight inflation is particularly damaging because specialty lubricant margins are narrower than commodity chemical margins, and because time-sensitive deliveries to automotive assembly plants and industrial maintenance schedules cannot absorb extended lead times without triggering costly production disruptions. UNCTAD’s 2025 review of Red Sea trade disruption impacts estimated a structural 15% increase in delivered cost for manufactured goods transiting this corridor, a figure that lubricant importers in Europe are now embedding into multi-year supply contracts through force majeure and freight adjustment clauses.
The ripple effect on sourcing strategy is already visible. Japanese specialty chemical producers, including NOK Corporation and Kyodo Yushi, have accelerated plans to establish European blending and packaging operations, reducing exposure to trans-oceanic freight volatility by localizing final-stage production closer to end-market customers. This nearshoring impulse mirrors a parallel trend in the United States, where the USTR’s Section 301 tariff maintenance on Chinese chemical and petrochemical imports, reaffirmed and in some categories expanded under the Biden-to-Trump administration transition, has made Chinese-origin base oil and additive imports structurally less competitive, redirecting U.S. formulators toward Middle Eastern and Southeast Asian supply alternatives.
Regional Analysis
Asia Pacific Held the Largest Share of the Global Specialty Lubricants Market
Asia Pacific’s market dominance reflects the geographic concentration of global manufacturing. China alone accounts for approximately 28% of global manufacturing output per the UNIDO Industrial Development Report 2024, and the region’s enormous and still-expanding automotive parc reinforces this position. India’s Production Linked Incentive (PLI) scheme for automotive components and advanced chemistry cell batteries, which allocated ₹181 billion in incentives across 2024–2026, is generating new precision manufacturing capacity that pulls premium lubricant demand into previously underserved industrial corridors in Maharashtra, Gujarat, and Tamil Nadu.
Latin America is the market’s fastest-growing regional story, driven by Brazil’s reindustrialization agenda under the Nova Indústria Brasil program, a BRL 300 billion industrial policy framework launched in 2024 targeting domestic manufacturing capacity expansion in defense, health, agribusiness, and green energy sectors. Each targeted sector generates distinct specialty lubricant demand, agribusiness machinery in Brazil’s expanding Cerrado frontier requires high-performance hydraulic and gear oils for harvesters operating in extreme heat conditions; wind energy construction in the Brazilian Northeast requires turbine greases and the expanding refinery and petrochemical complex in Comperj creates on-site industrial lubricant demand.
Key Regions and Countries Covered
- North America
- The US
- Canada
- Europe
- Germany
- France
- The UK
- Spain
- Italy
- Russia & CIS
- Rest of Europe
- APAC
- China
- Japan
- South Korea
- India
- ASEAN
- Rest of APAC
- Latin America
- Brazil
- Mexico
- Rest of Latin America
- Middle East & Africa
- GCC
- South Africa
- Rest of MEA
Key Players Analysis
Specialty lubricant manufacturers focus on strengthening technological differentiation, production scale efficiency, and supply chain integration to maintain competitiveness. A key priority is continuous formulation innovation, including the development of fully synthetic, ceramic-additive-enhanced, and bio-derived lubricants that improve thermal stability, electrical insulation, and service life for advanced EV powertrains, wind turbine drivetrains, and precision industrial equipment. Companies further invest heavily in additive chemistry R&D and low-SAPS reformulation programs, as these deliver performance certification compliances and support high-value automotive and industrial OEM applications.
Vertical integration with base oil producers and additive package suppliers helps secure raw material stability and improve cost control amid volatile PAO and ester input prices. Strategic capacity expansion, particularly across the Asia Pacific, enables alignment with concentrated demand from electric vehicle manufacturing and industrial machinery ecosystems. Additionally, manufacturers emphasize intellectual property protection around proprietary additive chemistry, process automation in blending operations, and quality standardization to ensure consistency at scale, while forming long-term supply agreements with major OEMs and industrial operators to reinforce customer lock-in and strengthen positioning in high-value specialty application segments.
The Major Players In The Industry
- ExxonMobil Corporation
- Royal Dutch Shell plc
- BP plc
- Chevron Corporation
- Total Energies SE
- FUCHS Petrolub SE
- Klüber Lubrication München SE & Co. KG
- BASF SE
- Dow Inc.
- The Lubrizol Corporation
- Petro‑Canada Lubricants Inc.
- Sinopec Lubricant Company
- Idemitsu Kosan Co., Ltd.
- Valvoline Inc.
- Quaker Houghton
- Other Key Players
Key Development
- In July 2025, Interflon announced that 95% of its lubricant portfolio had been reformulated to be PFAS‑free, supporting safer high‑performance speciality lubricants used in advanced industrial and energy applications including rotating equipment in renewables and storage value chains.
- In November 2025, DuPont broke ground on a new Molykote speciality lubricants manufacturing facility in Zhangjiagang, China, to expand global capacity for advanced synthetic lubricants used in demanding applications such as electric drive systems and thermal management around energy and battery assets.
- In July 2025, Shell Lubricants completed the acquisition of Mumbai‑headquartered Raj Petro Specialities, strengthening Shell’s speciality lubricant portfolio and manufacturing base that can feed into power, industrial and energy‑sector lubrication needs including equipment around storage projects
Report Scope
| Report Features | Description |
|---|---|
| Market Value (2025) | USD 18.6 Bn |
| Forecast Revenue (2035) | USD 30.3 Bn |
| CAGR (2026-2035) | 5.0% |
| Base Year for Estimation | 2025 |
| Historic Period | 2020-2024 |
| Forecast Period | 2026-2035 |
| Report Coverage | Revenue Forecast, Market Dynamics, Competitive Landscape, Recent Developments |
| Segments Covered | By Type (Mineral oil-based specialty lubricants, Synthetic oil-based specialty lubricants, and Bio-based specialty lubricants), By Form (Oils, Greases, Sprays, and Pastes), By End Use (Automotive & transportation, Industrial machinery & manufacturing, Construction & heavy equipment, Food & beverage, Aerospace & defense, and Others) |
| Regional Analysis | North America – The US & Canada; Europe – Germany, France, The UK, Spain, Italy, Russia & CIS, Rest of Europe; APAC– China, Japan, South Korea, India, ASEAN & Rest of APAC; Latin America– Brazil, Mexico & Rest of Latin America; Middle East & Africa– GCC, South Africa, & Rest of MEA |
| Competitive Landscape | ExxonMobil Corporation, Royal Dutch Shell plc, BP plc, Chevron Corporation, TotalEnergies SE, FUCHS Petrolub SE, Klüber Lubrication München SE & Co. KG, BASF SE, Dow Inc., The Lubrizol Corporation, Petro-Canada Lubricants Inc., Sinopec Lubricant Company, Idemitsu Kosan Co., Ltd., Valvoline Inc., Quaker Houghton, Others |
| Customization Scope | Customization for segments, region/country-level will be provided. Moreover, additional customization can be done based on the requirements. |
| Purchase Options | We have three licenses to opt for: Single User License, Multi-User License (Up to 5 Users), Corporate Use License (Unlimited Users and Printable PDF) |





































