
Quick Navigation
Report Overview
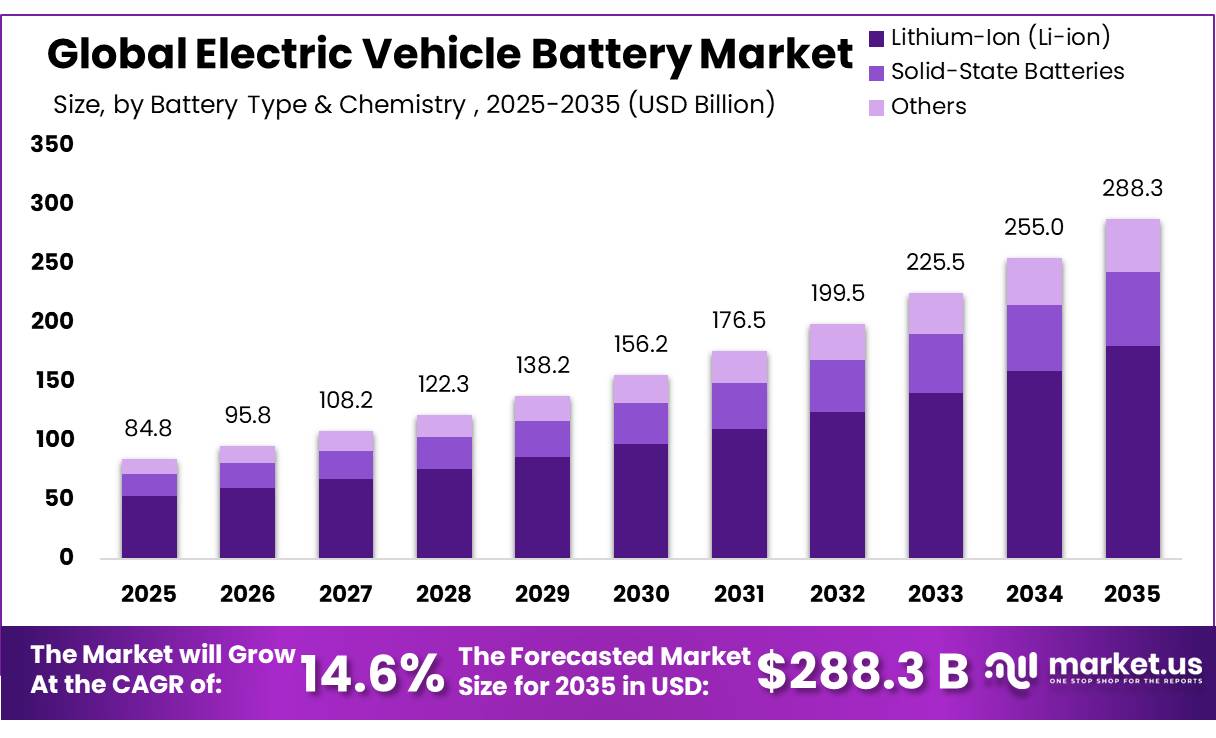
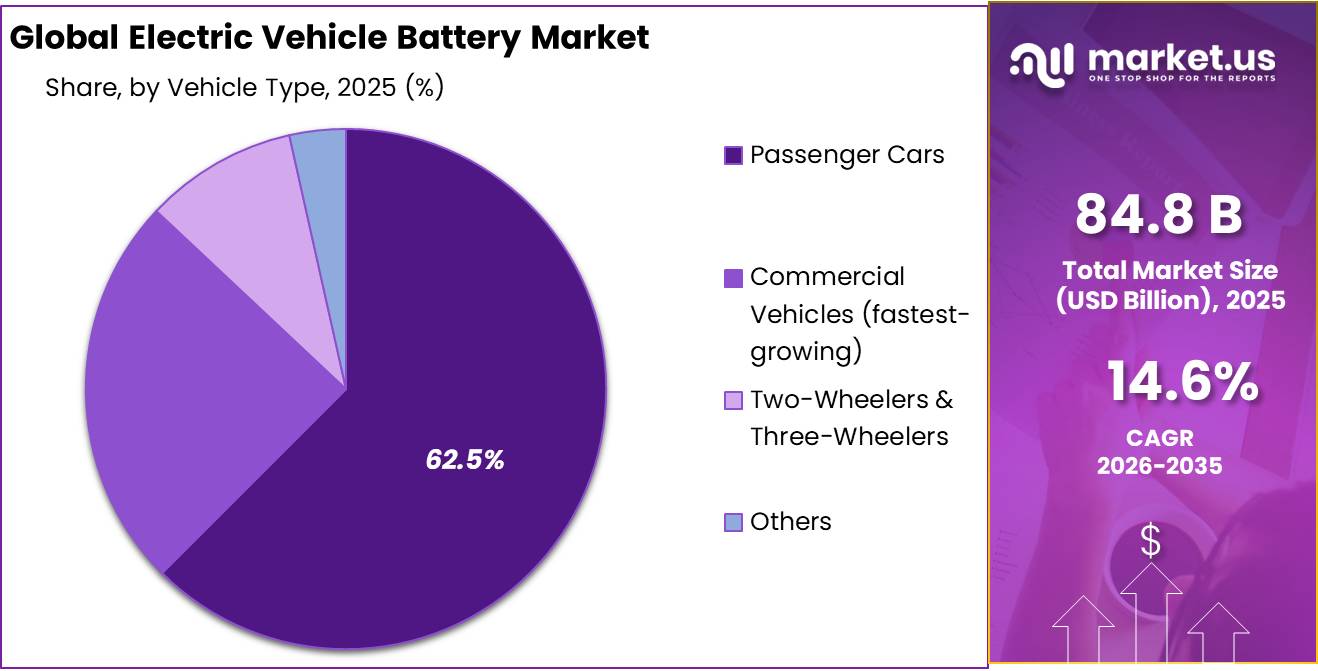
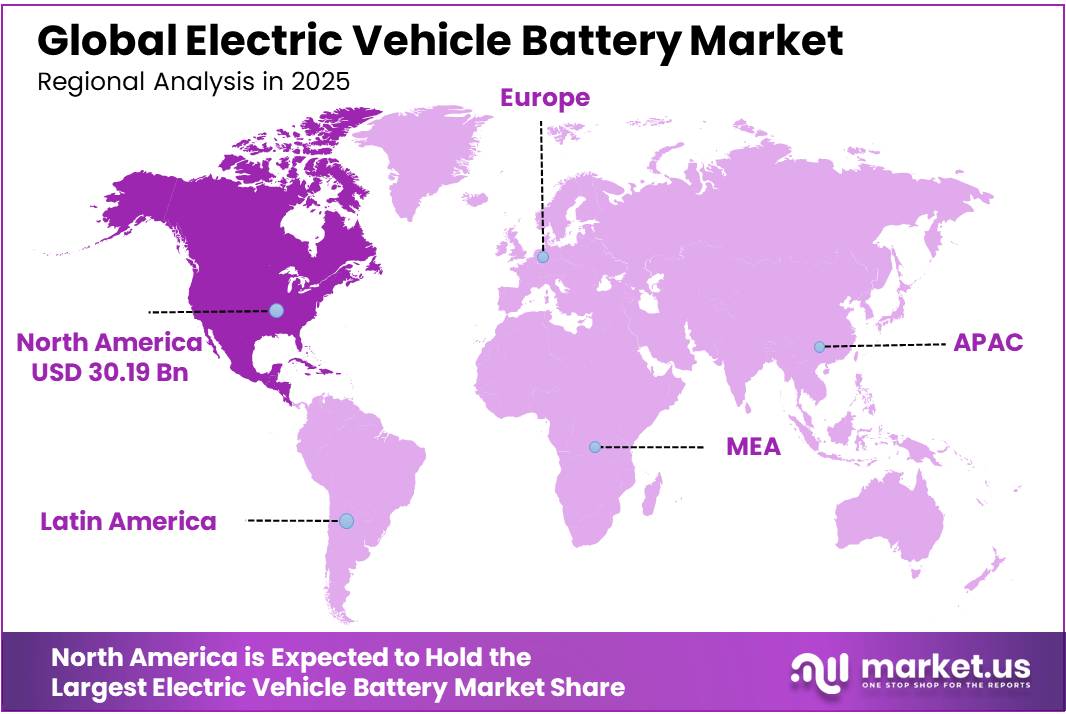
In 2025, the Global Electric Vehicle Battery Market was valued at USD 84.8 billion, and between 2026 and 2035, this market is estimated to register a CAGR of 14.6%, reaching about USD 288.3 billion by 2035. North America held a dominant market position, capturing more than a 35.6% share, holding USD 30.19 billion in revenue.
The electric vehicle battery industry has become a central part of global transport electrification. Batteries determine vehicle range, charging speed, safety, cost, and overall performance. Lithium-ion technology remains the commercial foundation, while lithium iron phosphate, nickel-based chemistries, sodium-ion systems, and solid-state designs are shaping product development across passenger cars, vans, buses, and trucks.
- The International Energy Agency reported that global electric car sales exceeded 20 million units, rising 20% and representing one-quarter of new car sales. EV battery deployment reached 1.2 TWh, almost 30% above 2024 and more than seven times the 2020 level. Light-duty vehicles represented over 85% of this deployment, showing that passenger mobility remains the industry’s main demand base.
Key Takeaways
- The Global Electric Vehicle Battery Market was valued at approximately USD 84.8 billion in 2025.
- The global Market is projected to grow at a CAGR of 14.6% and is estimated to reach nearly USD 288.3 billion by 2035.
- On the basis of battery type & chemistry, Lithium-Ion (Li-ion) batteries dominated the market, constituting 62.50% of the total market share.
- Based on vehicle type, Passenger Cars dominated the market, accounting for 62.50% of the total market share.
- Based on material type, Cobalt led the market with a 28.50% share, followed closely by Lithium at 27.3%.
- Among propulsion types, Battery Electric Vehicles (BEVs) dominated the market, accounting for 58.60% of the total market share.
- Based on battery capacity, the 15 kWh–50 kWh segment accounted for the largest market share at 50.20%, driven by strong adoption in mainstream passenger EVs.
- By battery form, Prismatic batteries dominated the market with a 44.5% share
- In 2025, North America emerged as the dominant regional market, accounting for 35.60% of the global Electric Vehicle Battery Market share.
Manufacturing capacity also expanded rapidly. Global lithium-ion cell nameplate capacity surpassed 4 TWh by the end of 2025, increasing roughly 30% year on year. However, China controlled more than 80% of worldwide capacity, while the European Union and United States each accounted for only 6–7%. This concentration creates supply risks for graphite anodes, cathode precursors, lithium iron phosphate materials, and other critical inputs. At the same time, average battery prices declined 8% in 2025, improving vehicle affordability and supporting wider adoption.
The IEA expects 23 million electric cars to be sold in 2026, equal to about 28% of global car sales. Policy support is also expanding manufacturing opportunities. In December 2025, the European Commission announced a €1.8 billion Battery Booster, including €1.5 billion in interest-free loans for European cell producers. Longer-term opportunities will emerge from solid-state batteries, commercial-vehicle electrification, battery reuse, material recovery, and manufacturing diversification.
Electric Vehicle Battery Market Segmentation
Battery Type & Chemistry Analysis
Lithium-Ion Batteries Lead with 62.50% Due to Proven Performance and Manufacturing Scale
In 2025, Lithium-Ion (Li-ion) held a dominant market position, capturing more than a 62.50% share. The segment remained ahead because lithium-ion batteries provide strong energy density, reliable driving range, fast charging, and long operating life. Established manufacturing capacity and wide adoption across passenger cars, buses, commercial vehicles, and electric two-wheelers further supported demand. By June 2026, vehicle manufacturers continued improving battery management systems, cell chemistry, and thermal control to enhance safety and efficiency.
Solid-State Batteries are emerging as a growing segment because they can offer improved safety, higher energy storage, and longer driving range. Automakers and battery developers are increasing pilot production and testing to prepare the technology for wider commercial use.
Vehicle Type Analysis
Passenger Cars Lead with 62.5% as Mass-Market EV Adoption Strengthens Battery Demand
In 2025, Passenger Cars held a dominant market position, capturing more than a 62.5% share. The segment remained ahead because electric cars accounted for the largest portion of vehicle sales, model launches, and battery installations. Automakers offered wider choices across compact cars, sedans, and sport utility vehicles, supporting demand for batteries with improved range, charging speed, and safety. By June 2026, falling battery costs, expanding charging networks, and government support for cleaner transport continued to encourage passenger EV adoption.
Commercial Vehicles are the fastest-growing segment as fleet operators increasingly electrify delivery vans, buses, and trucks. Lower operating costs, stricter emission rules, and demand for cleaner urban transport are encouraging investment in larger, durable battery packs designed for intensive daily use.
Material Type Analysis
Cobalt Leads with 28.50% as High-Energy Battery Chemistries Support Demand
In 2025, Cobalt held a dominant market position, capturing more than a 28.50% share. The material remained important because it improves battery stability, energy density, thermal performance, and operating life. Cobalt-containing cathodes continued to support long-range electric vehicles and premium models requiring reliable performance under demanding driving conditions. By June 2026, battery manufacturers were also working to reduce cobalt intensity through improved cathode designs while maintaining safety and storage capacity.
Lithium is emerging as a growing material segment because it is essential across most rechargeable electric vehicle battery chemistries. Rising battery production, new cell plants, recycling investment, and continued development of lithium-based technologies are strengthening demand across major automotive manufacturing regions.
Propulsion Analysis
Battery Electric Vehicles Lead with 58.60% as Full Electrification Gains Wider Acceptance
In 2025, Battery Electric Vehicle (BEV) held a dominant market position, capturing more than a 58.60% share. The segment remained ahead because BEVs rely entirely on battery power, creating higher battery demand per vehicle than hybrid alternatives. Automakers continued expanding electric car portfolios across compact, premium, commercial, and sport utility vehicle categories. By June 2026, improvements in driving range, charging speed, thermal management, and battery durability further supported adoption.
Plug-in Hybrid Electric Vehicle (PHEV) is emerging as a growing segment because it combines electric driving with an internal combustion engine. This flexibility reduces range concerns and supports buyers in regions where charging infrastructure remains limited.
Market Share by Battery Capacity
15 kWh–50 kWh Leads with 50.20% as Compact EV Demand Supports Adoption
In 2025, 15 kWh – 50 kWh held a dominant market position, capturing more than a 50.20% share. This capacity range remained widely used in compact electric cars, city vehicles, plug-in hybrids, and entry-level passenger models. It provides a practical balance between driving range, vehicle weight, charging time, and battery cost. By June 2026, automakers continued to use these packs in affordable models designed for daily commuting and urban travel.
The 50 kWh – 110 kWh segment is growing as buyers seek longer driving ranges and stronger performance. Demand is increasing across premium cars, sport utility vehicles, delivery vans, and other vehicles that require larger energy storage capacity.
Battery Form Analysis
Prismatic Leads with 44.50% as Efficient Packaging Supports Wider EV Use
In 2025, Prismatic held a dominant market position, capturing more than a 44.50% share. The format remained widely used because its rectangular design allows battery cells to fit efficiently within vehicle packs. Prismatic cells support high energy storage, strong structural stability, and simplified pack assembly, making them suitable for passenger cars, buses, and commercial vehicles. By June 2026, automakers continued adopting this form to improve interior space use, reduce the number of cell connections, and support larger battery capacities.
Cylindrical is emerging as a growing segment due to its proven manufacturing process, reliable thermal performance, and mechanical strength. It is gaining attention in high-performance vehicles and battery packs requiring flexible cell arrangements.
Key Market Segments
By Battery Type & Chemistry
- Lithium-Ion (Li-ion)
- LFP (Lithium Iron Phosphate
- NMC (Nickel Manganese Cobalt
- NCA (Nickel Cobalt Aluminum
- Solid-State Batteries
- Others
By Vehicle Type
- Passenger Cars
- Sedans
- SUVs / Crossovers
- Hatchbacks
- Commercial Vehicles (fastest-growing)
- Light Commercial Vehicles (LCV) / Vans
- Medium & Heavy Trucks
- Buses & Coaches
- Two-Wheelers & Three-Wheelers
- Others
By Material Type
- Cobalt
- Lithium
- Natural Graphite
- Manganese
- Others
By Propulsion
- Battery Electric Vehicle (BEV)
- Plug-in Hybrid Electric Vehicle (PHEV)
- Hybrid Electric Vehicle (HEV)
By Battery Capacity
- <15 kwh
- 15 kwh – 50 kWh
- 50 kWh – 110 kWh
- >110 kWh
By Battery Form
- Cylindrical
- Prismatic
- Pouch
Drivers
Battery Cost Deflation Approaching ICE Total Ownership Cost Parity
The 89% cumulative decline in lithium-ion battery pack prices since 2010 from over USD 1,000/kWh to a record low of USD 108/kWh in 2025 is not merely a cost reduction story but a demand unlocking inflection event that systematically expands the addressable market for EV batteries by drawing previously economically unviable vehicle segments across the purchase-price parity threshold.
Goldman Sachs Research’s forecasted trajectory toward USD 80/kWh by 2026 represents the specific threshold at which battery electric vehicles achieve total cost of ownership parity with gasoline-fuelled cars in the U.S. on an unsubsidised basis; LFP packs now the dominant chemistry for standard-range BEV applications averaged USD 81/kWh globally across all segments in 2025, while leading Chinese OEMs achieved LFP pack costs of approximately EUR 64/kWh, creating cost advantages of EUR 2,000–4,000 per midsize vehicle over Western competitors and driving incumbent OEM market share losses of up to 50% in certain segments since 2023.
Drivers Impact Analysis
| Driver | (~) % Impact on CAGR | Geographic Relevance | Impact Timeline |
|---|---|---|---|
| Battery Cost Deflation | +2.8% | Global — China supply epicentre; North America & EU benefit | Short term (≤ 2 years) |
| ZEV Mandates & ICE Phase-Out Legislation | +2.5% | EU (core), North America, UK, APAC (China, India spillover) | Short–Medium term |
| Gigafactory Localisation & Vertical Integration | +2.2% | North America (IRA-driven), EU, India (PLI scheme) | Medium term (2–4 years) |
| EV Sales Volume Momentum in China | +2.0% | APAC core (China dominant), ASEAN spillover | Short term (≤ 2 years) |
| Advanced Cell Architecture | +1.5% | China (pioneered), North America, EU follow | Medium term (2–4 years) |
| Solid-State Battery Commercialisation | +0.9% | Japan, China (pilot phase), EU & North America (R&D phase) | Long term (≥ 4 years) |
Restraints
Critical Mineral Supply Chain Concentration (Li, Co, Ni, Graphite)
The EV battery industry’s most structurally entrenched restraint lies in its extreme geographic concentration of critical raw material refining and processing, a bottleneck that erodes supply-chain resilience across every major OEM and cell manufacturer globally. China commands 70–80% of global lithium and cobalt refining capacity, roughly 30% of nickel processing, and nearly 90% of rare earth element separation — a dominance that extends to cathode precursor chemicals and anode graphite, where China accounts for approximately 79% of global natural graphite production.
The commercial consequence of this concentration is a persistent input-cost volatility floor that depresses unit economics for non-Chinese cell producers: European and North American gigafactories, lacking domestic mines, absorb feedstock premiums of 15–25% relative to their Chinese peers, directly compressing cell-level gross margins to sub-12% levels and triggering delayed offtake contracting. Governments in the US and EU are investing in domestic supply chain diversification, but significant gaps remain in mining, refining, and processing capacities that cannot be bridged within the near-term forecast horizon.
Restraint Impact Analysis
| Restraint | (~) % Impact on CAGR | Geographic Relevance | Impact Timeline |
|---|---|---|---|
| Critical Mineral Supply Chain Concentration (Li, Co, Ni, Graphite) | -2.3% | Global; acute in North America, EU, and India | Short term (≤ 2 years) |
| US–China Trade Tariff Escalation & Export Controls | -1.8% | North America core; ripple effects in EU and APAC corridors | Short term (≤ 2 years) |
| High CapEx Intensity & Gigafactory Margin Compression | -1.5% | North America, EU, and emerging markets (India, Southeast Asia) | Medium term (2–4 years) |
| Charging Infrastructure Deficit & Range Anxiety | -1.2% | APAC (India, Southeast Asia), Eastern EU, Latin America | Medium term (2–4 years) |
| Escalating Battery Safety Regulations & Recall Exposure | -0.9% | Worldwide; strictest compliance burden in China, EU, and North America | Medium term (2–4 years) |
| Skilled Workforce Deficit in Cell Manufacturing | -1.1% | North America, EU; nascent markets in India and Southeast Asia | Long term (≥ 4 years) |
Opportunity
Battery-as-a-Service (BaaS) Subscription & Swap Model Commercialization
India, Indonesia, and Vietnam — directly addressing the structural price barrier that baseline projections accept as a given headwind. In India, where two- and three-wheelers account for over 57% of EV registrations, BaaS penetration remains below 3% of the 10+ million unit per year addressable market, implying an uncaptured subscription revenue TAM of USD 8–12 billion annually at USD 15–20/vehicle/month.
The margin profile is structurally superior: BaaS operators retain battery ownership, capturing second-life value, optimizing degradation through controlled swapping-station charge cycles, and procuring electricity at bulk rates 20–35% below retail — supporting gross margins of 30–45% versus the 8–15% typical of integrated battery hardware businesses.
Opportunity Impact Analysis
| Opportunity | (~) % Potential CAGR | Geographic Relevance | Execution Window |
|---|---|---|---|
| Second-Life Battery Stationary Energy Storage | +2.8% | Global; APAC, EU, North America | Short term (≤ 2 years) |
| V2G Monetization & Virtual Power Plant Integration | +2.1% | North America, EU, advanced APAC (Japan, South Korea, Australia) | Medium term (2–4 years) |
| Battery-as-a-Service (BaaS) Subscription & Swap | +1.7% | APAC emerging (India, Indonesia, Vietnam); EU fleet | Short term (≤ 2 years) |
| Closed-Loop Recycling & Critical Material Recovery | +1.9% | Global; EU (mandated) and India (infrastructure greenfield) | Medium term (2–4 years) |
| Solid-State Battery Platform Licensing & IP Monetization | +2.4% | North America, EU, advanced APAC (Japan, South Korea, China) | Long term (≥ 4 years) |
| Commercial Fleet & Industrial Electrification TAM | +1.6% | APAC (India, SE Asia), North America, EU logistics corridors | Medium term (2–4 years) |
Challenge
Manufacturing Yield Variability & Cell-Level Defect Management
Initial production lines at greenfield facilities routinely report scrap rates of 20–30% in the first 12–18 months of operation, declining to a target steady-state of 5–10% over 24–48 months as process learning accumulates but even at a mature 8% scrap rate, a 40 GWh facility producing cells at a per-unit material cost of USD 65–80/kWh sustains a materials write-off burden of approximately USD 210–260 million per year, a cost drag that directly undermines the capital return models underwriting gigafactory debt and equity financing.
The strategic resolution pathway deploying inline vision sensors, AI-driven statistical process control (SPC), digital twin simulation, and laser surface preparation with real-time adaptive welding compensation requires an estimated capital overlay of USD 120–200 million per 10 GWh of capacity above the base gigafactory CapEx envelope, a quality infrastructure investment that established Asian manufacturers have already amortized over multiple facility generations but that Western entrants must absorb as a first-build cost premium.
Challenges Impact Analysis
| Challenge | (~) % CAGR Friction | Geographic Relevance | Mitigation Horizon |
|---|---|---|---|
| Manufacturing Yield Variability & Cell-Level Defect Management | -1.6% | Global; acute in EU and North America gigafactory ramp-up corridors | Long term (≥ 4 years) |
| Fast-Charging Induced Degradation & Lifecycle Management | -1.3% | Global; consumer-facing markets in North America, EU, and advanced APAC | Medium term (2–4 years) |
| Digital Battery Passport & Lifecycle Data Governance Compliance | -1.1% | EU regulatory hubs; cascading impact on global exporters to EU | Short term (≤ 2 years) |
| Battery Chemistry Fragmentation & Platform Standardization Deficit | -0.9% | Global; cross-border supply chain corridors and OEM platform ecosystems | Medium term (2–4 years) |
| Grid Infrastructure Strain & Peak-Load Capacity Inadequacy | -1.4% | APAC (India, Southeast Asia), Eastern EU, North America suburban/rural zones | Long term (≥ 4 years) |
| Geopolitical Supply Chain Re-routing & Logistics Lead-Time Elongation | -1.2% | North America–APAC and EU–APAC trade lanes; India import corridors | Medium term (2–4 years) |
Geopolitical Impact Analysis
Trade Policies, Critical Minerals, and Industrial Strategies Are Reshaping the Electric Vehicle Battery Market
Geopolitical tensions are reshaping the electric vehicle battery market through critical mineral concentration, trade restrictions, and transport disruption. In 2025, China produced over 80% of global battery cells, around 85% of cathode active materials, and more than 90% of anode active materials. This concentration exposes manufacturers elsewhere to export controls, diplomatic disputes, and supply interruptions involving lithium, graphite, cobalt, nickel, and processed components.
- Trade policy is also changing sourcing and investment decisions. The United States raised Section 301 tariffs on Chinese lithium-ion EV batteries from 7.5% to 25% in 2024, while natural graphite became subject to a 25% tariff in 2026. These measures support domestic production but can increase near-term costs for automakers dependent on Asian cells and materials.
Shipping instability adds further pressure. The IMF reported that Suez Canal trade fell 50% and Panama Canal trade declined 32% during the first two months of 2024. Longer routes can delay battery materials, equipment, and completed cells while raising freight and inventory expenses.
Governments are responding with regional industrial strategies. In December 2025, the European Commission announced a €1.8 billion Battery Booster, including €1.5 billion in interest-free loans for European cell producers. These policies encourage local manufacturing, recycling, mineral partnerships, and diversified supply chains.
Regional Analysis
North America Leads Through EV and Battery Manufacturing Expansion
In 2025, North America held a dominant position in the electric vehicle battery market, accounting for 35.60% and USD 30.19 billion. Regional demand was supported by EV adoption, new cell plants, automaker–battery partnerships, and public funding for domestic supply chains. The IEA reported that United States electric car sales reached around 1.5 million units in 2025.
Battery manufacturing capacity had exceeded 200 GWh in 2024, with nearly 700 GWh of additional capacity under construction. By the end of 2025, United States lithium-ion cell capacity expanded by about 50% year over year, strengthening regional supply. Investment in battery materials, recycling, and large-scale manufacturing is helping reduce import dependence and improve access to locally produced cells. Continued fleet electrification and demand for larger battery packs are expected to support regional growth.
Key Regions and Countries Covered
- North America
- The US
- Canada
- Europe
- Germany
- France
- The UK
- Spain
- Italy
- Russia & CIS
- Rest of Europe
- APAC
- China
- Japan
- South Korea
- India
- ASEAN
- Rest of APAC
- Latin America
- Brazil
- Mexico
- Rest of Latin America
- Middle East & Africa
- GCC
- South Africa
- Rest of MEA
Key Players Analysis
Electric vehicle battery manufacturers compete through cell performance, production scale, cost control, and supply-chain integration. Leading players such as CATL, BYD, LG Energy Solution, Panasonic Energy, Samsung SDI, and SK On continue investing in lithium-ion technologies, advanced battery management systems, and faster manufacturing processes. Their established relationships with major automakers support long-term supply agreements and stable demand.
Companies are expanding production capacity across North America, Europe, and Asia Pacific to remain closer to vehicle assembly plants and reduce transport risks. Vertical integration into lithium processing, cathode materials, recycling, and battery-pack production also strengthens cost control and material security.
Competitive positioning increasingly depends on energy density, charging speed, safety, operating life, and pack affordability. Manufacturers are also developing lithium iron phosphate, sodium-ion, and solid-state batteries to address different vehicle requirements. Strategic partnerships, local manufacturing incentives, recycling networks, and reliable raw-material access will continue shaping market share.
Market Key Players
- CATL (Contemporary Amperex Technology Co.)
- BYD (FinDreams Battery)
- LG Energy Solution
- Panasonic Energy
- Samsung SDI
- SK On (SK Innovation)
- CALB (China Aviation Lithium Battery)
- Gotion High-Tech
- EVE Energy
- SVOLT Energy Technology
- Northvolt AB
- GS Yuasa Corporation
- Envision AESC
- QuantumScape Corporation
- Amara Raja Energy & Mobility
Key Development
- In November 2025, CATL its joint venture with Stellantis began constructing a Spanish LFP battery plant involving investment of up to EUR 4.1 billion, planned capacity of 50 GWh and more than 4,000 direct jobs. CATL reported RMB 423.7 billion in 2025 revenue, 661 GWh of battery sales and RMB 22.1 billion in research spending. Its global production capacity reached 772 GWh, with another 321 GWh under construction.
- In February 2026, LG Energy Solution agreed to acquire Stellantis’ 49% stake in NextStar Energy, giving it full ownership of the Canadian battery producer, where more than CAD 5 billion had already been invested and over 1,300 people were employed. By April 2026, new 46-Series orders exceeded 100 GWh, raising the backlog above 440 GWh, while production of multiple cylindrical formats was scheduled to begin at its Arizona plant by late 2026.
Report Scope
| Report Features | Description |
|---|---|
| Market Value (2025) | USD 84.8 Bn |
| Forecast Revenue (2035) | USD 288.3 Bn |
| CAGR (2026-2035) | 14.6% |
| Base Year for Estimation | 2025 |
| Historic Period | 2020-2024 |
| Forecast Period | 2026-2035 |
| Report Coverage | Revenue Forecast, Market Dynamics, Competitive Landscape, Recent Developments |
| Segments Covered | By Battery Type & Chemistry (Lithium-Ion (Li-ion), LFP (Lithium Iron Phosphate), NMC (Nickel Manganese Cobalt), NCA (Nickel Cobalt Aluminum), Solid-State Batteries, and Others), By Vehicle Type (Passenger Cars, Commercial Vehicles, Two & Three-Wheelers), By Material Type (Cobalt, Lithium, Natural Graphite, Manganese, and Others), By Propulsion (Battery Electric Vehicle (BEV), Plug-In Hybrid Electric Vehicle (PHEV), and Hybrid Electric Vehicle (HEV)), By Battery Capacity (<15 kWh, 15 kWh–50 kWh, 50 kWh–110 kWh, and >110 kWh), By Battery Form (Cylindrical, Prismatic, and Pouch) |
| Regional Analysis | North America – The US & Canada; Europe – Germany, France, The UK, Spain, Italy, Russia & CIS, Rest of Europe; APAC– China, Japan, South Korea, India, ASEAN & Rest of APAC; Latin America– Brazil, Mexico & Rest of Latin America; Middle East & Africa– GCC, South Africa, & Rest of MEA |
| Competitive Landscape | CATL (Contemporary Amperex Technology Co.), BYD (FinDreams Battery), LG Energy Solution, Panasonic Energy, Samsung SDI, SK On (SK Innovation), CALB (China Aviation Lithium Battery), Gotion High-Tech,EVE Energy,SVOLT Energy Technology, Northvolt AB, GS Yuasa Corporation,Envision AESC, QuantumScape Corporation, Amara Raja Energy & Mobility |
| Customization Scope | Customization for segments, region/country-level will be provided. Moreover, additional customization can be done based on the requirements. |
| Purchase Options | We have three licenses to opt for: Single User License, Multi-User License (Up to 5 Users), Corporate Use License (Unlimited Users and Printable PDF) |


