


Report Overview
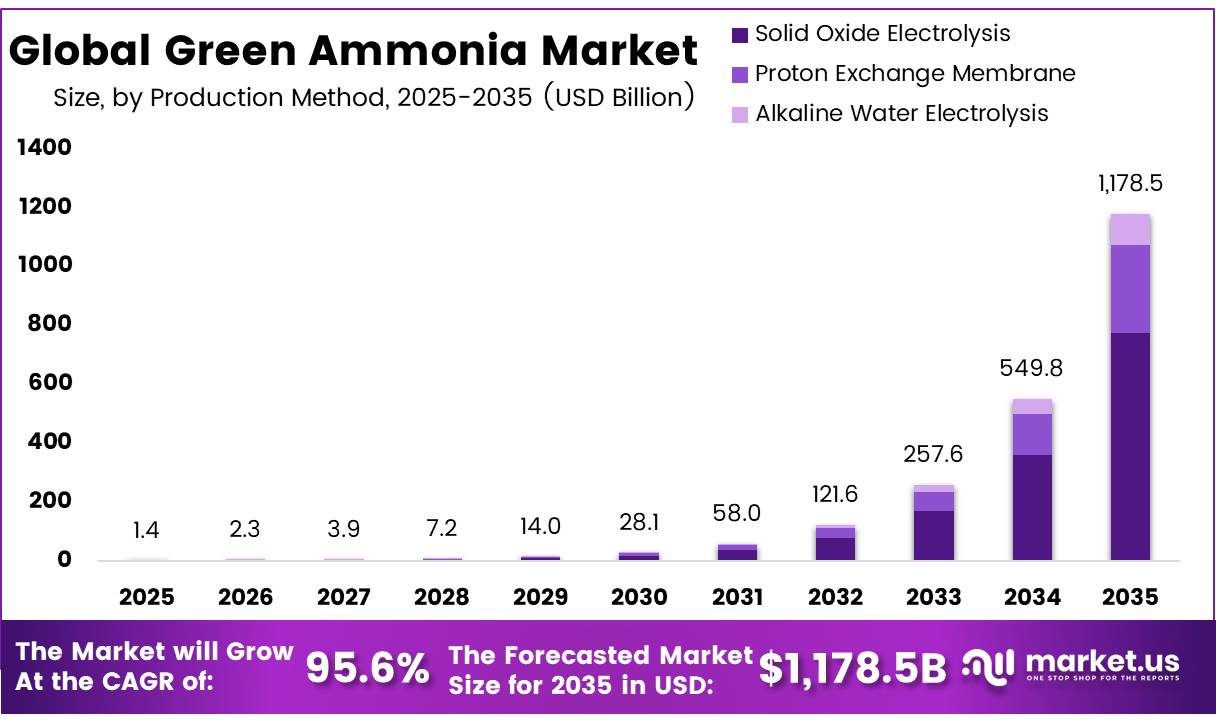
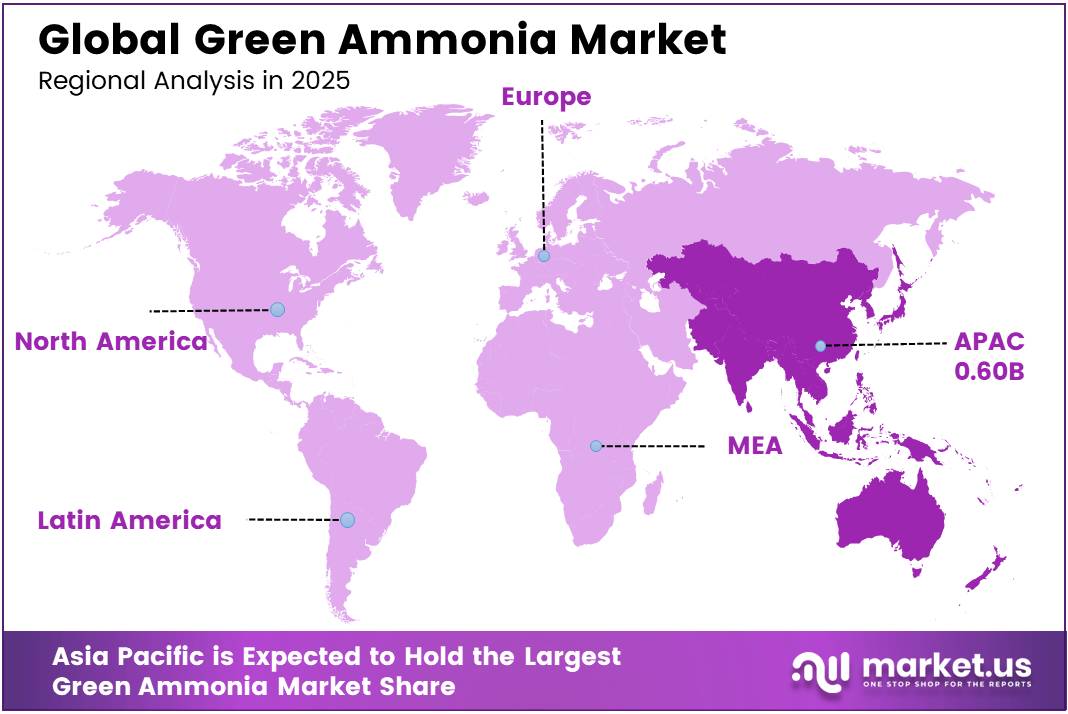
In 2025, the Global Green Ammonia Market was valued at USD 1.4 billion, and between 2026 and 2035, this market is estimated to register a CAGR of 95.6%, reaching about USD 1,178.5 billion by 2035. Asia Pacific held a dominant market position, capturing more than a 42.3% share, holding USD 0.60 billion in revenue.
The global green ammonia market is a critical component of the clean energy transition, acting as both a sustainable industrial feedstock and a versatile energy carrier produced by renewable-powered electrolysis processes. Demand is directly linked to the increasing decarbonisation of important industries such as agriculture, electricity generation, maritime shipping, and chemical manufacture, where the need for low-carbon alternatives is growing due to tightening regulatory frameworks and net-zero pledges.
- According to the IEA, green ammonia remains in the early stages of commercialization. In 2025, announced low-emissions ammonia projects for fertilizers reached around 19 Mt, representing less than 10% of global ammonia production.
Key Takeaways
- The global green ammonia market was valued at USD 1.4 billion in 2025.
- The global market is projected to grow at a CAGR of 95.6% and is estimated to reach USD 1,178.5 billion by 2035.
- Solid oxide electrolysis dominated the market, accounting for 65.7% of the total market share due to its superior energy efficiency.
- Fertilizers led the market, constituting 45.6% of the total demand, supported by strong usage in urea production and ammonium nitrate manufacturing.
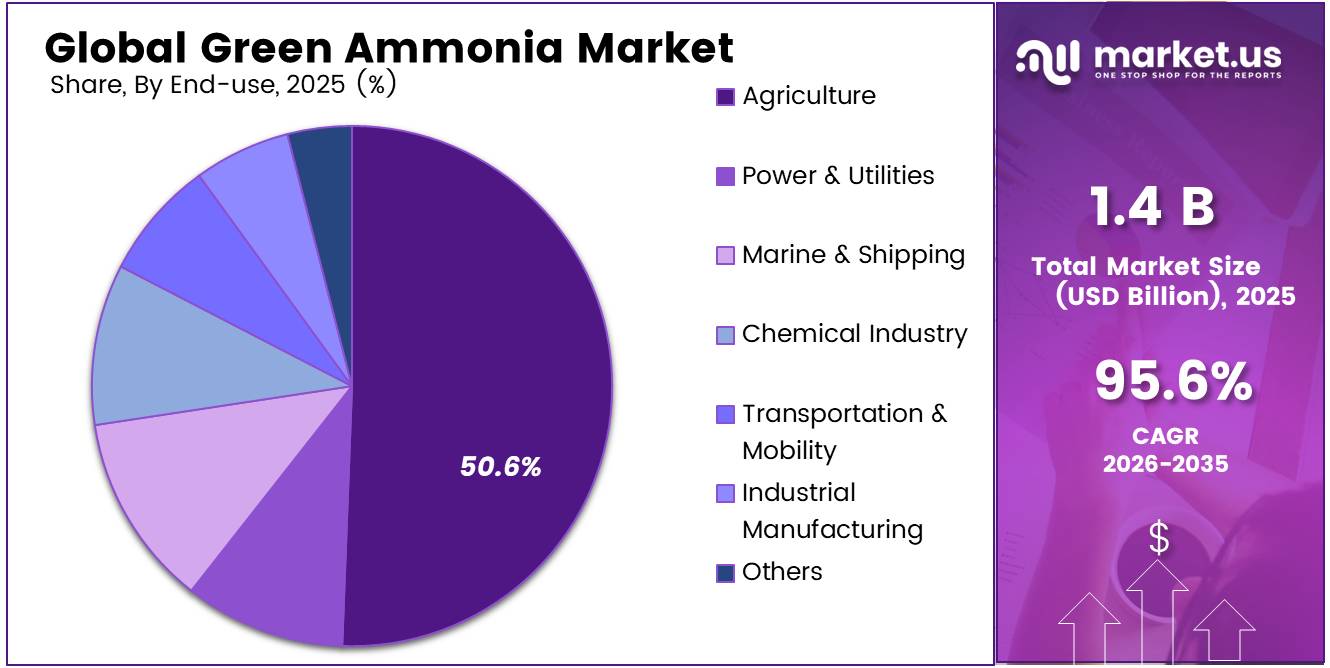
- Agriculture dominated the market with a significant share of 50.6%, owing to the growing demand for sustainable fertilizer solutions.
- Asia Pacific emerged as the dominant region in the global green ammonia market, accounting for 42.3% of the total market share.
The majority of the production is done through electrolysis, which includes three main methods: alkaline water electrolysis, proton exchange membrane, and solid oxide electrolysis. Currently, alkaline water electrolysis is the most cost-effective method of producing hydrogen, but demand for hydrogen from solid oxide electrolysis is predicted to increase due to its efficiency. Hydrogen has numerous applications, including energy storage, hydrogen transportation, power generation, maritime fuel, and industrial feedstocks such as fertilizers.
- In 2024, According to the International Energy Agency, fertilizer production will continue to dominate worldwide ammonia use, accounting for between 70%-77% of total ammonia demand, mostly for urea and ammonium nitrate production.
- According to the IEA’s Ammonia Technology Roadmap, published on 11 October 2021, sustainable ammonia production would need more than 110 GW of electrolyser capacity by 2050, equal to installing about ten 30 MW electrolysers every month.
Green ammonia has applications in agriculture, electricity generation, marine transport, chemical industries, transportation, and industrial operations. Agricultural companies employ green ammonia to make sustainable fertilizers. Green ammonia is also used as a renewable energy source by power providers. The marine transportation industry has used green ammonia as an alternative fuel for zero-emission operations. On the other hand, the chemical and industrial sectors are progressively using green ammonia into their low-carbon processes.
- In July 2023, the International Maritime Organization (IMO) adopted a strategy targeting zero or near-zero greenhouse gas (GHG) emission fuels, technologies, and energy sources to account for at least 5% striving for 10% of the energy used by international shipping by 2030.
Production Method Analysis
Solid Oxide Electrolysis (SOE) is the market’s dominant segment.
Solid oxide electrolysis is the dominating production technique in the worldwide green ammonia market, accounting for 65.7%, because to its higher energy efficiency and capacity to incorporate waste heat recovery from ammonia synthesis processes. Operating at high temperatures, SOE technology reduces the costs level of hydrogen generation compared to traditional electrolysis methods, making it an attractive option for large-scale commercial green ammonia factories.
- In 2024, DOE’s high-temperature electrolysis targets show SOE-based systems moving toward 35 kWh/kg H₂ electrical efficiency and 95% LHV efficiency as an ultimate target. This supports the claim that SOE can reduce power needs in green hydrogen production.
Proton Exchange Membrane electrolysis is gaining popularity as a complementary technology, thanks to its compact design, rapid response to fluctuating renewable energy inputs, and ability to produce high-purity hydrogen, making it ideal for smaller-scale and decentralized green ammonia applications. Alkaline Water Electrolysis, on the other hand, is the most commercially established and cost-effective method, commonly used in current large-scale ammonia production facilities due to its demonstrated dependability and lower capital requirements.
Application Analysis
Fertilizers Represent the Dominant Segment in the Market
Fertilizers are the leading application sector in the worldwide green ammonia market, accounting for 45.6%, owing to ammonia’s fundamental position as the principal nitrogen source in global agricultural production. The primary end-uses in this section are urea manufacture and ammonium nitrate manufacturing, both of which are directly derived from ammonia and are the most frequently used nitrogen fertilizers in the world.
- According to the Food and Agriculture Organization (FAO), global consumption of inorganic fertilizers reached 190 million tonnes (Mt) in 2023, up from 142 Mt in 2002. Nitrogen fertilizers accounted for 120 Mt of total consumption in 2023, underscoring their dominant share in global fertilizer demand.
In addition to fertilizers, the green ammonia industry has seen tremendous growth in applications such as energy storage, energy production, marine fuel, industrial raw material, and hydrogen transportation. Green ammonia is currently widely employed as an efficient hydrogen carrier in international energy exchange because it is more easily stored and transported than liquid hydrogen.
End-Use Industry Analysis
Agriculture Represents the Dominant Segment in the Market.
The agriculture industry dominates the global green ammonia market, accounting for around 50.6%. This can be ascribed to the widespread use of ammonia as a nitrogen source for crop growth. Agricultural businesses utilize ammonia as an input ingredient in the production of fertilizers such as urea and ammonium nitrate to ensure food production. One of the primary drivers of the green ammonia business is the growing demand for green ammonia as a result of increased sustainability regulations and carbon pricing in agriculture.
Food security, population growth, and the need to assure agricultural efficiency have all contributed to the agricultural industry’s supremacy as an application field. Furthermore, various policies implemented by governments to promote sustainable agriculture practices and the use of green fertilizers will support the use of ammonia in the agricultural industry.
Key Market Segments
Production Method
- Solid Oxide Electrolysis
- Proton Exchange Membrane
- Alkaline Water Electrolysis
Application
- Fertilizers
- Energy Storage & Carrier
- Power Generation
- Maritime Fuel
- Industrial Feedstock
- Hydrogen Transport
- Others
End-Use Industry
- Agriculture
- Power & Utilities
- Marine & Shipping
- Chemical Industry
- Transportation & Mobility
- Industrial Manufacturing
- Others
Driver Analysis
National Green Hydrogen Missions and Green Ammonia Certification Standards
India’s Ministry of New and Renewable Energy (MNRE) issued the formal Green Ammonia Standard notification on 27 February 2026, establishing a statutory emission threshold of no more than 0.38 kg CO₂-equivalent per kg of ammonia a scientifically rigorous boundary that aligns closely with international benchmarks including the European Commission’s delegated acts under the Renewable Energy Directive.
This standard, combined with the National Green Hydrogen Mission’s (NGHM) total financial outlay of approximately USD 2.4 billion through FY2030, creates a certified domestic supply framework that underpins export credibility and investment bankability simultaneously.
The SIGHT Programme specifically Component-II allocates USD 1.59 billion as direct production incentives for green hydrogen, which serves as the primary feedstock for green ammonia synthesis. Electrolyzer manufacturing incentives begin at USD 54/kW in Year 1, degressing over five years, ensuring that domestic capital equipment costs reduce toward internationally competitive levels.
On the regulatory architecture side, India’s Ministry of Power Green Hydrogen/Ammonia Policy provides a 25-year waiver of inter-state transmission charges for qualifying projects commissioned before June 2025, priority grid connectivity, and a 30-day renewable energy banking facility provisions that collectively reduce the levelized cost of renewable electricity input, which constitutes 60–70% of green ammonia’s total production cost.
Drivers Impact Analysis
| Driver | (~) % Impact on CAGR Forecast | Geographic Relevance | Impact Timeline |
|---|---|---|---|
| Mandatory Carbon Pricing via EU CBAM | +4.5% | EU core (27 member states); spillover to MENA, India, Russia as origin countries | Short term (≤ 2 years) |
| National Regulatory Mandates & Green Ammonia Standards | +5.5% | South Asia primary; APAC corridors (Japan, South Korea offtake); Middle East spill-over | Short–Medium term (1–4 years) |
| IMO Net-Zero Shipping Framework | +3.8% | Global maritime; North Europe (Rotterdam); APAC (Singapore, Busan, Yokohama) bunkering corridors | Medium term (2–4 years) |
| Electrolyzer Cost Deflation & Renewable Energy LCOE Decline | +4.2% | MENA, Australia, India renewable production hubs; China manufacturing scale-up | Medium term (2–4 years) |
| Long-Term Bilateral Offtake Agreements & Government CfD Mechanisms | +3.5% | APAC import block (Japan, South Korea); India, Australia as export corridors | Medium–Long term (3–6 years) |
| Industrial Decarbonization Mandates in Hard-to-Abate Sectors | +3.0% | Global industrial belts; EU mandatory; India (NGHM mandatory offtake quota); South America spill-over | Long term (≥ 4 years) |
Restraint Analysis
High Green Premium vs. Grey Ammonia (LCOA Cost Gap)
As of Q1 2026, even the most competitive green ammonia auction outcomes India’s SECI SIGHT Mode-2 reverse auction in August 2025, which recorded a record-low winning bid of USD 565/MT submitted by ACME Cleantech Solutions remain approximately 9–24% above prevailing grey ammonia spot prices, implying a green premium of USD 50–126/MT that fertilizer end-users, particularly in price-sensitive agrarian economies, are structurally unwilling to absorb without policy-mandated offtake obligations or blending mandates.
IRENA’s 2022 Innovation Outlook documented current green ammonia production costs in the range of USD 720–1,400/MT, with a projected decline to USD 310–610/MT by 2050 driven by renewable electricity cost compression and electrolyzer learning curves; however, the IEA’s 2023 Ammonia Technology Roadmap established that state-of-the-art natural gas-based plants can produce grey ammonia at costs as low as USD 160/MT at scale meaning that even optimistic 2030 green cost projections still imply a structural green premium of USD 150–450/MT absent a carbon price signal of USD 80–120/tCO₂ or higher, far exceeding the EU CBAM’s projected 2026 carbon cost escalation of 10–20% on ammonia imports.
This cost asymmetry directly compresses developer margins on long-term offtake contracts, forces continued dependence on production-linked subsidies, and creates a vicious cycle wherein sub-scale deployment prevents the learning-rate cost reductions needed to close the gap estimated by the IEA to require cumulative electrolyzer deployment beyond 110 GW globally, against a current trajectory of just 4+ million tonnes of low-emissions hydrogen by 2030.
Restraint Impact Analysis
| Restraint | (~) % Impact on CAGR Forecast | Geographic Relevance | Impact Timeline |
|---|---|---|---|
| High Green Premium vs. Grey Ammonia (LCOA Cost Gap) | -4.5% | Global; most acute in EU, South Asia, East Asia corridors | Medium term (2–4 years) |
| Electrolyzer CapEx Intensity & Critical Mineral Bottlenecks | -3.8% | Global; most acute in North America, EU, APAC ex-China | Medium term (2–4 years) |
| Regulatory Complexity — EU RFNBO / CBAM Compliance Burden | -2.6% | EU core; indirect spillover to MENA & South Asia exporters | Short term (≤ 2 years) |
| Renewable Energy Intermittency & Electrolyzer Utilization Deficit | -2.2% | APAC corridors, Sub-Saharan Africa, South Asia | Medium term (2–4 years) |
| Policy Uncertainty — US 45V Rollback & Subsidy Instability | -2.0% | North America core; indirect investor confidence globally | Short term (≤ 2 years) |
| Skilled Workforce Deficit & Project Bankability Gap | -1.5% | South Asia (India), MENA, Sub-Saharan Africa, APAC | Long term (≥ 4 years) |
Opportunity Analysis
EU CBAM-Linked Premium Green Ammonia Trade & Certification Arbitrage
The EU Carbon Border Adjustment Mechanism (CBAM) entered its definitive regime on 1 January 2026, applying to nitrogenous fertilisers the primary end-use product of ammonia and explicitly pricing the embedded carbon in imported grey ammonia derivatives at the EU ETS allowance price. India’s MNRE’s February 2026 Green Ammonia Standard (≤0.38 kg CO₂e/kg NH₃) is significantly below the EU RFNBO threshold of ≤0.526 kg CO₂e/kg NH₃, meaning Indian-certified green ammonia automatically qualifies for the lowest CBAM levy tier and may claim substantial CBAM deductions against EU importers’ certificate obligations.
Early estimates suggest CBAM adds approximately €1.79/tonne of urea in 2026 at just 2.5% free allowance phase-out, scaling dramatically as free allowances are fully phased out between 2026 and 2035; by 2030, the CBAM pass-through to EU fertilizer importers is projected to reach €40–65/tonne urea equivalent creating a window where dual-certified Indian or MENA green ammonia commands a verifiable landed-cost advantage of 12–18% over grey ammonia imports, an arbitrage that commercial traders, commodity houses, and green ammonia producers who build dual-certification capabilities by 2027 can structurally capture.
Opportunity Impact Analysis
| Opportunity | (~) % Potential CAGR Upside | Geographic Relevance | Execution Window |
|---|---|---|---|
| Article 6.2 ITMO Monetization for Green Ammonia Projects | +3.5% | India–Japan corridor; India–EU extension; MENA–Europe | Short term (≤ 2 years) |
| Maritime Bunkering Infrastructure as an Asset Class | +4.2% | India (Tuticorin, Paradip, Kandla); EU Rotterdam–Singapore corridor; Middle East ports | Medium term (2–4 years) |
| Decentralized On-Farm Green Ammonia Production (AgriTech Pivot) | +2.8% | Sub-Saharan Africa; South Asia (India, Bangladesh); Latin America | Medium term (2–4 years) |
| Ammonia Co-Firing Power Supply Contracts (Long-Term Offtake Premium) | +3.1% | Japan; South Korea; Southeast Asia (Bangladesh, Vietnam) | Medium term (2–4 years) |
| EU CBAM-Linked Premium Green Ammonia Trade & Certification Arbitrage | +2.4% | EU (fertiliser-importing bloc); India and MENA as exporters | Short–Medium term (1–3 years) |
| Domestic Electrolyzer Manufacturing Roll-Up & Export (Capital Goods Pivot) | +3.8% | India (PLI corridor); Germany; South Korea | Long term (≥ 4 years) |
Challenges Analysis
Electrolyzer Cost Overrun & Deployment Lag
The IEA’s Global Hydrogen Review 2025 confirmed that the cost of manufacturing and installing an electrolyzer outside of China in 2024 averaged USD 2,000–2,600 per kilowatt (kW), a 60–80% premium over Chinese domestic rates of USD 600–1,200/kW, with the divergence partially attributable to local installation labour, grid interconnection costs, and the absence of domestic supply chain depth; independent assessments of real-world PEM system costs in 2024 placed the figure even higher at approximately USD 3,000/kW when balance-of-plant integration is included.
Installing Chinese-manufactured electrolyzers in Europe reduces total CAPEX by only approximately 20% once European installation costs are factored in, meaning hydrogen production cost savings from equipment arbitrage remain structurally limited. At the system boundary, green ammonia production requires approximately 37.3–37.6 GJ per tonne of NH₃, yielding an overall energy efficiency of only 48–49% under current integrated PEM–Haber-Bosch configurations, implying that every USD 1/MWh increase in renewable electricity procurement cost adds approximately USD 2.80–3.10 to the levelised cost of green ammonia a unit-economic penalty that accumulates as renewable capacity allocation competes with grid demand.
Challenges Impact Analysis
| Challenge | (~) % CAGR Friction Drag | Geographic Relevance | Mitigation Horizon |
|---|---|---|---|
| Electrolyzer Cost Overrun & Deployment Lag | ~-3.2% | EU, North America, India, MENA | Long term (≥ 4 years) |
| Offtake Bankability & Revenue-Floor Deficit | ~-2.8% | MENA export corridors, Australia, India | Medium term (2–4 years) |
| Renewable Intermittency–Synthesis Loop Mismatch | ~-2.1% | APAC, Middle East (solar-heavy), Sub-Saharan Africa | Medium term (2–4 years) |
| Cross-Border Certification & RFNBO Fragmentation | ~-1.7% | EU import hubs, India–EU trade lanes, GCC exporters | Medium term (2–4 years) |
| Critical Minerals Supply Constraint (PGMs) | ~-1.4% | North America, EU manufacturing hubs, South Korea | Long term (≥ 4 years) |
| Green Skills & Specialist Workforce Deficit | ~-0.9% | Global (acute in APAC, MENA, Sub-Saharan Africa) | Long term (≥ 4 years) |
Geopolitical Impact Analysis
Geopolitical factors are having a significant impact on the global green ammonia industry, intensifying the quest for energy security, supply chain diversification, and low-carbon fuel independence. The Russia-Ukraine conflict and volatility in global natural gas markets highlighted the hazards of relying on fossil fuel imports, prompting many governments to invest extensively in renewable energy and green ammonia production as long-term energy strategies.
Countries with extensive renewable energy resources, such as Australia, Saudi Arabia, India, Chile, and Namibia, are emerging as potential green ammonia export hubs. This is altering international energy trade dynamics and fostering new strategic alliances between ammonia-producing and energy-importing countries like Japan, South Korea, and numerous European countries.
At the same time, geopolitical tensions, trade restrictions, and fluctuation in crucial raw material supply chains can all have an impact on project prices, electrolyzer availability, and infrastructure construction timeframes. Government subsidies, carbon restrictions, and renewable energy incentives are also driving up global competition as countries vie for leadership in the green hydrogen and ammonia sector. Overall, geopolitical concerns are driving up investments in green ammonia while also influencing global production networks, trading routes, and long-term market competitiveness.
Regional Analysis
Asia-Pacific emerges as the leading region in the market
The Asia-Pacific region emerges as the leading region in the global market for green ammonia, accounting for 42.3% of the total market share, owing to the large-scale presence of the industrial sector, increased renewable energy sources, and governments’ high level of involvement in hydrogen and clean energy strategies.
China is the major producer and consumer of green ammonia in the region due to the availability of big electrolyzer plants, a clean energy value chain, and the country’s carbon neutrality aspirations. Japan and South Korea are the region’s largest green ammonia importers, with green ammonia being included into national hydrogen initiatives. India is rapidly positioning itself as both a major producer and exporter of green ammonia, backed by substantial government investments, competitive renewable energy costs, and large-scale project developments across multiple states.
Europe is the second largest market for green ammonia, because to strong ecological measures and hydrogen imports led by Germany, the Netherlands, and Denmark. North America is seeing tremendous expansion as a result of strong incentives granted by the Inflation Reduction Act and renewable energy sources. Similarly, Latin America, the Middle East, and Africa have established themselves as export markets as a result of cheap renewable energy sources.
Key Regions and Countries Covered
- North America
- The US
- Canada
- Europe
- Germany
- France
- The UK
- Spain
- Italy
- Russia & CIS
- Rest of Europe
- APAC
- China
- Japan
- South Korea
- India
- ASEAN
- Rest of APAC
- Latin America
- Brazil
- Mexico
- Rest of Latin America
- Middle East & Africa
- GCC
- South Africa
- Rest of MEA
Key Players Analysis
The green ammonia business is characterized by modest consolidation, with key market participants using partnerships, mergers and acquisitions, and capacity expansions as primary competitive strategies to gain a competitive edge across many geographies. The industry’s competitive dynamics include existing ammonia producers, electrolyzer technology providers, renewable energy firms, and green ammonia project specialists, all of whom work together to drive the market from pilots to large-scale commercialization.
Technology businesses are viewed as significant facilitators for large-scale initiatives because they supply the unique synthesis technology and technical skills needed to make such projects economically viable. Renewable energy firms are vertically integrating throughout the green ammonia value chain, merging low-cost renewable energy production, electrolysis, and ammonia production.
The Major Players in The Industry
- Nel Hydrogen
- Siemens Energy
- MAN Energy Solutions
- ThyssenKrupp AG
- ITM Power PLC
- Hydrogenics
- Green Hydrogen Systems
- McPhy Energy
- Electrochaea
- EXYTRON
- AquaHydrex
- Enapter
- BASF SE
- Yara International
- ENGIE
- Uniper
- Haldor Topsoe
- Starfire Energy
- Queensland Nitrates Pty Ltd
- Hiringa Energy
- Other Key Players
Key Development
- In July 2026, Yara International North America agreed to acquire Gulf Coast Ammonia’s Texas City ammonia plant for USD 1.3 billion, adding 3 million metric tons per year of ammonia capacity, lifting Yara’s 2026 capex outlay to USD 2.5 billion, and supporting full plant ramp-up by the end of 2026.
- In July 2026, McPhy Energy is best viewed as a legacy technology player in the green ammonia value chain, because its alkaline electrolyzers supported the production of green hydrogen, which is a key feedstock for green ammonia. Under Partnership & Agreement, McPhy’s important clean-hydrogen link was its agreement with Larsen & Toubro (L&T) to extend technology transfer and exclusive licensing for the McPhy XL 4 MW electrolyzer, supporting larger green hydrogen projects that can supply ammonia and fertilizer decarbonization.
Report Scope
| Report Features | Description |
|---|---|
| Market Value (2025) | USD 1.4 Bn |
| Forecast Revenue (2035) | USD 1,178.5 Bn |
| CAGR (2026-2035) | 95.6% |
| Base Year for Estimation | 2025 |
| Historic Period | 2020-2024 |
| Forecast Period | 2026-2035 |
| Report Coverage | Revenue Forecast, Market Dynamics, Competitive Landscape, Recent Developments |
| Segments Covered | By Production Method (Solid Oxide Electrolysis, Proton Exchange Membrane, and Alkaline Water Electrolysis), By Application (Fertilizers, Energy Storage & Carrier, Power Generation, Maritime Fuel, Industrial Feedstock, Hydrogen Transport, and Others), By End-Use Industry (Agriculture, Power & Utilities, Marine And Shipping, Chemical Industry, Transportation & Mobility, Industrial Manufacturing, and Others). |
| Regional Analysis | North America – The US & Canada; Europe – Germany, France, The UK, Spain, Italy, Russia & CIS, Rest of Europe; APAC– China, Japan, South Korea, India, ASEAN & Rest of APAC; Latin America– Brazil, Mexico & Rest of Latin America; Middle East & Africa– GCC, South Africa, & Rest of MEA |
| Competitive Landscape | Nel Hydrogen, Siemens Energy, MAN Energy Solutions, ThyssenKrupp AG, ITM Power PLC, Hydrogenics, Green Hydrogen Systems, McPhy Energy, Electrochaea, EXYTRON, AquaHydrex, Enapter, BASF SE, Yara International, ENGIE, Uniper, Haldor Topsoe, Starfire Energy, Queensland Nitrates Pty Ltd, Hiringa Energy, Other Key Players. |
| Customization Scope | Customization for segments, region/country-level will be provided. Moreover, additional customization can be done based on the requirements. |
| Purchase Options | We have three licenses to opt for: Single User License, Multi-User License (Up to 5 Users), Corporate Use License (Unlimited Users and Printable PDF) |





































