
Quick Navigation
Report Overview
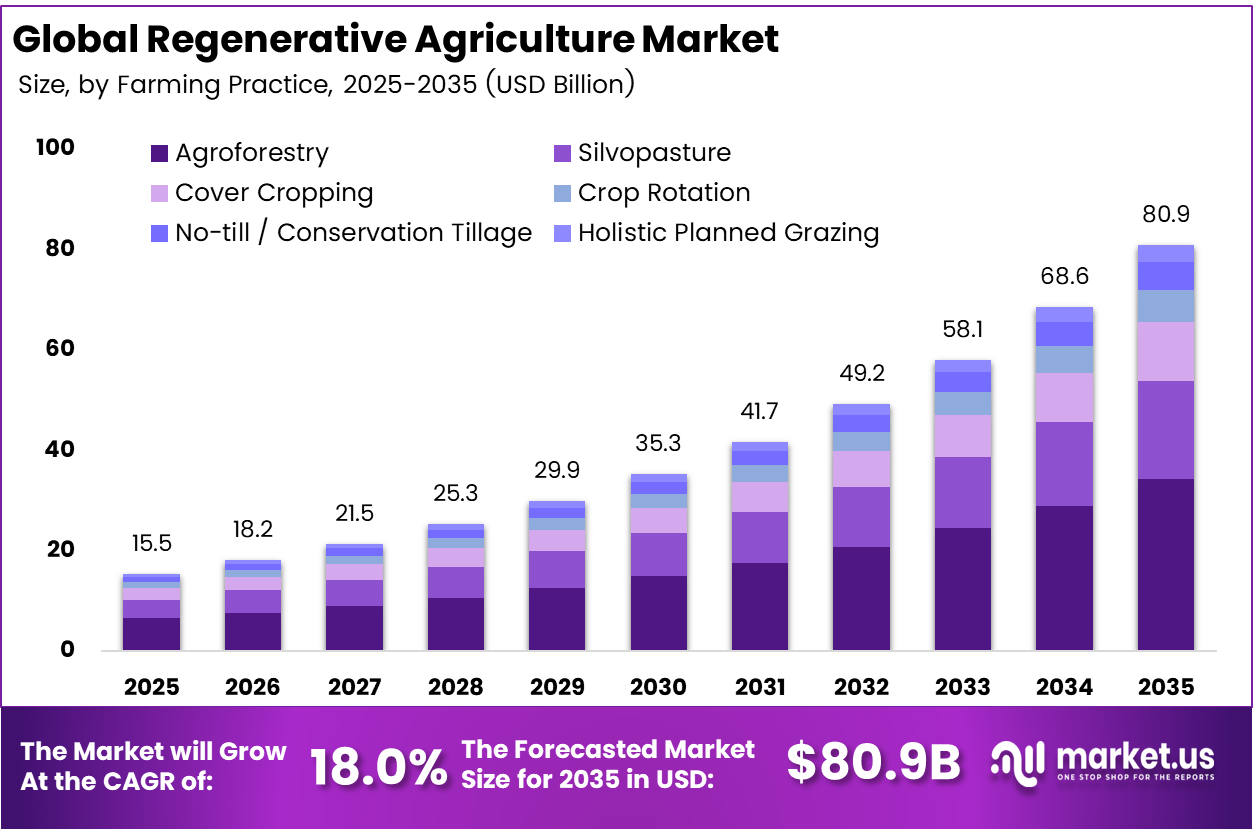
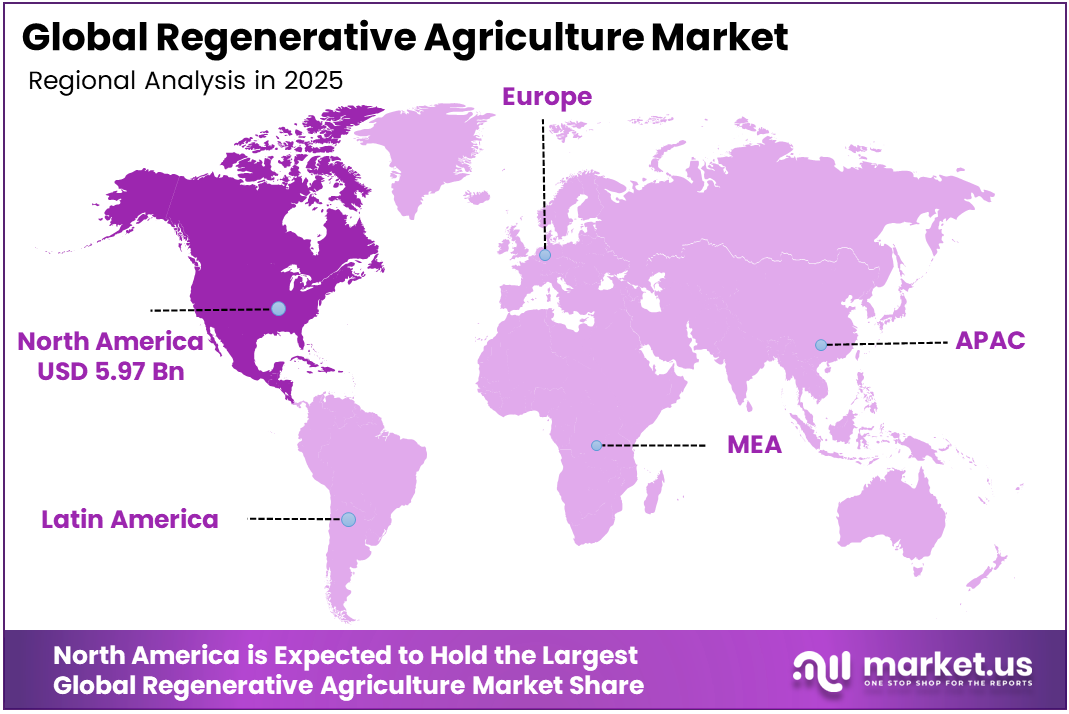
The Global Regenerative Agriculture Market was valued at USD 15.5 billion, and between 2026 and 2035, this market is estimated to register a CAGR of 18.0%, reaching about USD 80.9 billion by 2035. In 2025, North America led the market, achieving over 38.5% share with a revenue of USD 5.97 billion.
The economics became more compelling in early 2026, when DAP and MAP prices exceeded USD 700/MT, and urea surpassed USD 500/MT following the Strait of Hormuz disruption. BioConsortia raised USD 15 million to launch Always-N, a nitrogen-fixing seed treatment for industrial corn. The USDA launched a Regenerative Agriculture Pilot Program committing USD 700 million for FY2026 through EQIP and CSP, including direct per-acre payments for soil-health practices.
Regenerative agriculture aims to leave land biologically richer after each growing season by restoring soil, water cycles, and ecosystems. Its commercial case in 2025–2026 is driven by structural pressures in conventional farming: roughly one-third of global agricultural soils are moderately to severely degraded, increasing farmers’ dependence on synthetic inputs and creating an “input treadmill” of rising costs and thin margins.
Key Takeaways
- The global regenerative agriculture market was valued at USD 15.5 billion in 2025.
- The global regenerative agriculture market is projected to grow at a CAGR of 18.0% and is estimated to reach USD 80.9 billion by 2035.
- On the basis of farming practice, agroforestry dominated the global regenerative agriculture market, constituting 42.3% of the total market share in 2025.
- Based on the application, carbon sequestration & soil health dominated the regenerative agriculture market, with a substantial market share of around 38.2% in 2025.
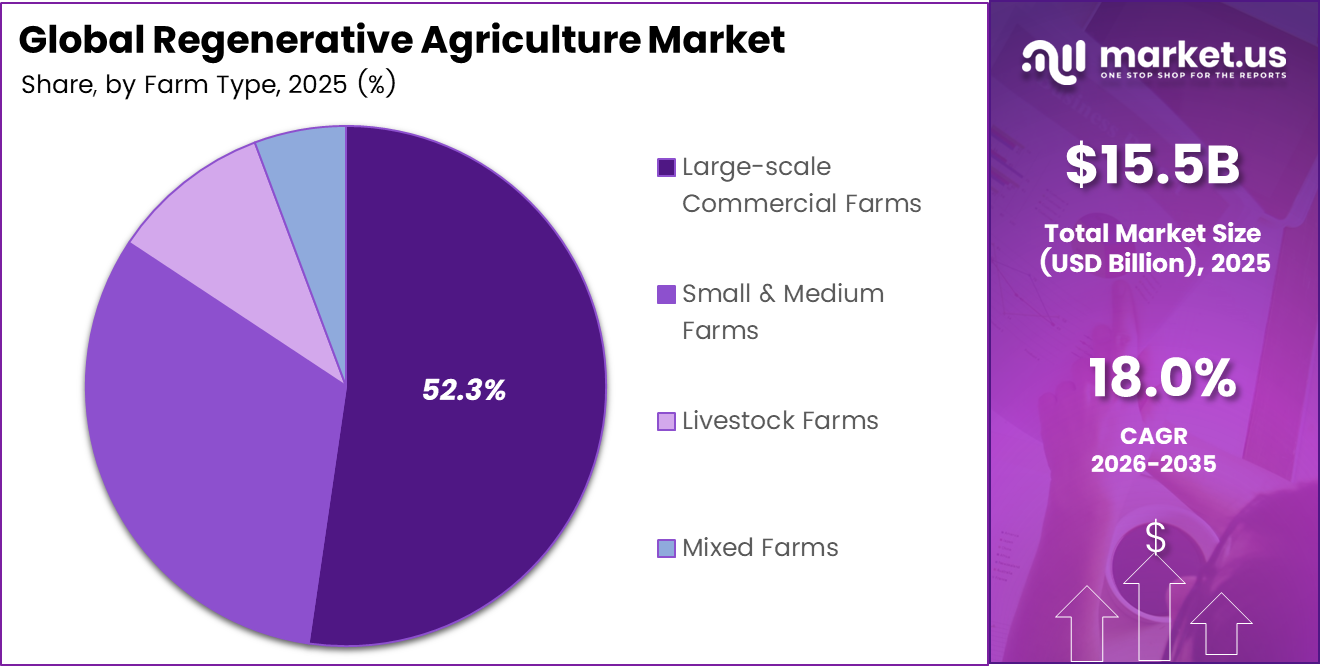
- Based on the farm type, large-scale commercial farms led the market, comprising 52.3% of the total global regenerative agriculture market in 2025.
- Among the components, services held a major share in the regenerative agriculture market, 43.6% of the market share in 2025.
- Among the end-users, farmers & growers are the most considerable within the global regenerative agriculture market, accounting for around 56.7% of the revenue in 2025.
- Among the distribution/support channels, direct partnerships led the market, accounting for 52.3% of the total market share in 2025.
- In 2025, North America was the most dominant region in the regenerative agriculture market, accounting for 38.5% of the total global consumption.
Farming Practice Analysis
Agroforestry represents dominant Segment in the Market
Agroforestry’s 42.3% share is being driven by its ability to integrate carbon sequestration, biodiversity compliance, and sustained agricultural productivity within a single land-use system. This multi-output structure is making it the most policy-aligned regenerative practice across major subsidy and regulatory frameworks. In Brazil, Eco Invest Brasil mobilised more than USD 5 billion in 2025, with agroforestry-integrated systems prioritised for financing across the Cerrado and Amazon regions as part of broader land-use transition strategies.
In the EU, Common Agricultural Policy eco-schemes are similarly assigning higher weighting to agroforestry due to its ability to deliver layered environmental outcomes rather than single-metric improvements. Demand has been further reinforced by the EU Deforestation Regulation, enforced from 2025, which is pushing cocoa, coffee, and palm supply chains toward agroforestry-certified sourcing because audit defensibility and traceability are significantly stronger compared to monoculture systems under regulatory review.
Silvopasture growth is being accelerated by the convergence of methane reduction commitments, livestock system redesign, and emerging carbon market eligibility. Danone’s 30% methane reduction target to 2030 is driving structural changes in dairy sourcing systems, particularly in feed and land management practices. At the same time, McDonald’s USD 200 million regenerative agriculture commitment is reinforcing beef supply chain transformation at scale.
Application Analysis
Carbon sequestration and soil health continue to dominate application segment
Carbon sequestration and soil health continue to dominate at 38.2% because it remains the only regenerative application directly connected to monetizable carbon credit markets and policy-linked financial mechanisms. USDA’s 2025 climate-smart feedstock rules are increasingly tying soil carbon outcomes to biofuel pricing and eligibility structures, effectively embedding carbon performance into commodity valuation.
Indigo Ag’s reported USD 13.7 million projected farmer payment pipeline through 2026 further demonstrates that soil carbon monetization is already operational at commercial scale rather than theoretical. For instance, under CSRD requirements beginning in 2025, food manufacturers are also prioritizing soil health metrics because they provide the most measurable, auditable, and procurement-relevant Scope 3 emissions reductions within existing agricultural supply chains.
Biodiversity enhancement is emerging as the fastest-growing application following the implementation of the EU Nature Restoration Law in 2025, which has shifted biodiversity from a voluntary ESG consideration into a binding regulatory requirement across agricultural landscapes. This has materially changed corporate sourcing behavior, particularly among multinational food companies operating in EU markets.
Farm Type Analysis
Large-scale Commercial Farms Are the Most Widely Used Farm Type
Large-scale commercial farms account for 52.3% of total activity primarily due to transaction efficiency and verification economics. These operations allow significantly lower cost per verified acre, making them the preferred entry point for corporate regenerative sourcing programs. For instance, Structures such as Cargill’s RegenConnect and General Mills’ 800,000-acre regenerative sourcing portfolio demonstrate how large farms enable rapid scaling of verified commodity supply with relatively standardized MRV requirements.
For food manufacturers operating under tightening CSRD disclosure obligations, large-scale farms provide predictable volumes and more streamlined audit trails, which is critical for Scope 3 reporting accuracy and investor transparency. Small and medium farms are emerging as the fastest-growing segment due to targeted public funding and technological access improvements.
The USDA’s USD 700 million Regenerative Agriculture Pilot Program, implemented through EQIP and CSP in December 2025, has shifted significant capital toward farmer-direct payment models, reducing reliance on intermediaries. At the same time, satellite-based MRV systems and digital enrollment platforms are lowering verification costs and administrative barriers, allowing smaller farms to participate in programs that were previously economically inaccessible.
Component Analysis
Services Held a Major Share of the Regenerative Agriculture Market
Services dominate at 43.6% because regenerative agriculture adoption is fundamentally dependent on advisory, verification, and measurement infrastructure rather than product substitution alone. Farmers transitioning to regenerative systems require agronomic guidance, soil monitoring, and compliance support, which are increasingly being delivered through integrated service models.
Partnerships such as Soil Capital with Nestlé and PepsiCo, along with Nutrien’s expanded agronomic service strategy, illustrate how advisory and MRV services have become central to program execution and farmer retention. These services also form the backbone of compliance under emerging registry and reporting frameworks, making them indispensable to scalable adoption.
Carbon credit programs are growing fastest due to increasing institutional credibility and regulatory alignment across major markets. ICVCM approval of Verra VM0042 methodologies has strengthened market trust, while the EU Carbon Removal Certification Framework is establishing standardized carbon farming rules across Europe. In parallel, the U.S. Treasury’s Section 45Z proposal is linking soil carbon outcomes to federal biofuel tax incentives, effectively embedding carbon performance into public policy.
End Use Analysis
Regenerative Agriculture Is Mostly Utilized by Farmers & Growers
Farmers and growers remain the dominant end-user group at 56.7% because they are the operational core of all regenerative systems, responsible for implementation, compliance, and delivery of measurable outcomes. Programs such as PepsiCo’s regenerative sourcing initiatives, which engaged approximately 20,000 farmers in 2024, demonstrate how adoption depends on direct farmer participation supported by financial incentives and agronomic support systems.
Without farmer-level engagement, no carbon, biodiversity, or soil health program can function at scale, making this segment structurally foundational. Carbon market participants are the fastest-growing end-user group as agricultural credits transition into a more formalized and investable asset class.
SustainCERT’s validation of 32 insetting interventions by 2026, along with emerging platforms such as Athian and Proba, is helping institutionalize the connection between corporate emissions reduction commitments and farm-level credit generation. Agricultural carbon is increasingly being treated as a structured financial instrument rather than a voluntary offset, attracting interest from corporates, financial institutions, and emerging climate investment funds.
Distribution / Support Channel Analysis
Direct partnerships dominate the Distribution / Support Channel segment
Direct partnerships dominate at 52.3% because Scope 3 compliance requirements under frameworks such as CSRD demand fully traceable and contract-based sourcing relationships. Agreements like Nestlé’s multi-year regenerative sourcing contracts and Cargill’s RegenConnect program illustrate how corporations are increasingly bypassing traditional commodity intermediaries to maintain direct control over verification, traceability, and reporting integrity.
These partnerships also provide greater certainty in securing verified regenerative supply, which is becoming increasingly competitive and constrained. Government programs are becoming the fastest-growing support channel for regenerative agriculture because they make funding more accessible and reduce the financial risks of adoption.
By moving from one-time grants to outcome-based payments, governments are helping farmers, particularly small and mid-sized producers, adopt regenerative practices without needing an established commercial track record. At the same time, increasing attention to climate resilience and biodiversity is encouraging governments to combine funding into broader, easier-to-access programs.
Key Market Segments
By Farming Practice
- Agroforestry
- Silvopasture
- Cover Cropping
- Crop Rotation
- No-till / Conservation Tillage
- Holistic Planned Grazing
By Application
- Carbon Sequestration & Soil Health
- Biodiversity Enhancement
- Water Management
- Livestock Integration
- Organic Food Production
By Farm Type
- Large-scale Commercial Farms
- Small & Medium Farms
- Livestock Farms
- Mixed Farms
By Component
- Services
- Solutions/Platforms
- Monitoring & Verification Tools
- Carbon Credit Programs
By End-user
- Farmers & Growers
- Food & Beverage Companies
- Government & NGOs
- Carbon Market Participants
By Distribution / Support Channel
- Direct Partnerships
- Cooperatives
- Digital Platforms
- Government Programs
Market Dynamics
Opportunity
Soil-carbon monetization remains an opportunity rather than a current market driver because most regenerative acreage still depends on agronomic savings and grant support, while high-integrity carbon revenues are limited to a relatively small pool of verified projects. The upside lies in converting fragmented project origination into long-term offtake platforms linked to enterprise buyers.
Demand signals include Microsoft’s purchase of 60,000 Indigo credits in 2025 and its subsequent 12-year agreement for 2.85 million credits. A scaled platform could improve farmer income by approximately $18–$45 per acre annually through carbon, insetting, and data services, reduce customer acquisition costs per acre by 20%–30% through cooperatives and grain handlers, and lift platform gross margins above 40% once field-monitoring costs fall below $3–$5 per acre. This white space could add around 2.4 percentage points above the baseline CAGR.
| Opportunity | (~) % Potential CAGR Upside | Geographic Relevance | Execution Window |
|---|---|---|---|
| Soil-carbon offtake platforms | +2.4% | North America core, EU, Australia | Short term (≤ 2 years) |
| Scope 3 premium crop contracting | +2.1% | EU, North America core, Latin America export belts | Short term (≤ 2 years) |
| Regenerative input bundles | +1.8% | North America, EU, India, Brazil | Medium term (2-4 years) |
| Smallholder aggregation models | +2.7% | India, Southeast Asia, Africa, Latin America | Medium term (2-4 years) |
| Livestock-integrated monetization | +1.6% | U.S., Brazil, Australia, EU pasture regions | Medium term (2-4 years) |
| M&A roll-up of measurement stacks | +1.9% | North America core, EU regulatory hubs | Long term (≥ 4 years) |
Drivers
The U.S. NRCS regenerative agriculture pilot is a direct market driver because it converts adoption plans into funded implementation through technical assistance, continuous applications, ranked funding windows, and payments following practice completion. The 2026 initiative allocates $700 million, including $400 million through EQIP and $300 million through CSP, creating immediate demand for seeds, biological inputs, advisory services, and implementation support.
Public cost sharing can shorten farmer payback periods by approximately 1–2 growing seasons, reduce transition risk on first-time acres by 20%–35%, and improve vendor conversion rates by offsetting early-stage yield volatility.
| Driver | (~) % Impact on CAGR Forecast | Geographic Relevance | Impact Timeline |
|---|---|---|---|
| Public incentive expansion | +2.3% | North America core | Short term (≤ 2 years) |
| EU certification formalization | +1.9% | EU | Short term (≤ 2 years) |
| Corporate carbon offtake demand | +2.1% | North America, EU, Australia | Medium term (2-4 years) |
| Yield resilience under degradation | +1.7% | Global, especially APAC and Africa | Medium term (2-4 years) |
| Climate-smart finance scaling | +1.5% | MENA, APAC, Latin America | Medium term (2-4 years) |
| Whole-farm planning adoption | +1.4% | U.S., EU, Australia | Long term (≥ 4 years) |
Restraints
Verification costs remain a structural restraint because sampling, auditing, registry, and reporting expenses can absorb a significant share of credit revenue on fragmented or small-acreage farms. This weakens platform contribution margins, increases the minimum viable project size, and discourages expansion into smallholder and new geographic markets. Transition-related yield risk adds further pressure, as farmers may face a 3%–8% yield decline during the first one to three seasons before soil performance improves, making adoption difficult where cash margins, debt obligations, and land rents are already high.
| Restraint | (~) % Impact on CAGR Forecast | Geographic Relevance | Impact Timeline |
|---|---|---|---|
| Verification cost burden | -2.2% | North America, EU, Australia | Short term (≤ 2 years) |
| Transition yield dip risk | -1.9% | Global row-crop markets | Short term (≤ 2 years) |
| Fragmented payment mechanisms | -1.6% | APAC, Africa, Latin America | Medium term (2-4 years) |
| Eligibility and paperwork load | -1.3% | North America core | Short term (≤ 2 years) |
| Premium demand concentration | -1.5% | EU, North America | Medium term (2-4 years) |
| Tenure insecurity on leased land | -1.7% | U.S., Latin America, Asia | Long term (≥ 4 years) |
Challenges
Market fragmentation remains an ongoing commercial challenge rather than an immediate restraint on sales. Differences across protocols, registries, soil baselines, permanence assumptions, and sampling requirements force developers to customize reporting and reduce comparability between credits and regenerative claims.
These inconsistencies can extend enterprise sales cycles by 3–6 months, increase diligence expenses to the low-to-mid six-figure range for major procurement programs, and restrict secondary-market liquidity. Companies must therefore continue investing in harmonized standards, interoperable data systems, and software abstraction layers while maintaining active commercial operations.
| Challenge | (~) % CAGR Friction Drag | Geographic Relevance | Mitigation Horizon |
|---|---|---|---|
| MRV standard fragmentation | -1.4% | North America core, EU hubs | Medium term (2-4 years) |
| Agronomy talent shortage | -1.1% | U.S., EU, India, Brazil | Long term (≥ 4 years) |
| Data interoperability gaps | -1.0% | Global digital farming markets | Medium term (2-4 years) |
| Farmer trust conversion | -0.9% | Global | Short term (≤ 2 years) |
| Logistics for cover crops | -0.8% | North America, EU, Brazil | Medium term (2-4 years) |
| Multi-year outcome volatility | -1.2% | Global climate-exposed regions | Long term (≥ 4 years) |
Geopolitical Impact Analysis
Strait of Hormuz Disruption Is Converting Regenerative Agriculture from a Sustainability Practice into a Fertilizer Security Strategy
The military escalation between the United States, Israel, and Iran in late February 2026, which led to the effective closure of the Strait of Hormuz to commercial shipping, has become one of the most significant geopolitical shocks influencing regenerative agriculture adoption in recent history. FAO Director-General Qu Dongyu, speaking at the Ministerial Meeting of the MED9++ Countries on Food Security and Fertilizer Access in May 2026, noted that the disruption affects a key global trade corridor for oil, liquefied natural gas, sulfur, and fertilizers.
The FAO warned that this supply shock is likely to tighten global food and fertilizer availability through the second half of 2026 and into 2027, with the most severe impacts expected in import-dependent regions across Africa, South Asia, and the Middle East. The NDSU Agricultural Trade Monitor, published in March 2026, reported that the Strait of Hormuz typically accounts for around 15% of globally traded ammonia and 21% of globally traded urea, largely originating from Gulf producers including Saudi Arabia, Qatar, Kuwait, the UAE, Bahrain, Iran, and Iraq.
Following the disruption, prices rose sharply, with DAP and MAP exceeding USD 700 per metric ton, urea rising above USD 500 per metric ton, and potash surpassing USD 370 per metric ton as of March 17, 2026. The International Food Policy Research Institute also highlighted warnings from the International Rice Research Institute that prolonged disruption could make fertilizer and energy availability one of the most serious risks to Asia’s next cropping cycle, especially for rice-dependent supply chains.
Regional Analysis
North America Held the Largest Share of the Global Regenerative Agriculture Market
North America leads at 38.5% due to a highly developed ecosystem of policy incentives, corporate procurement programs, and established agricultural supply chains. USDA initiatives, biofuel-linked carbon intensity regulations, and federal climate-smart agriculture programs are creating multiple overlapping financial drivers for regenerative adoption.
At the same time, major food companies such as General Mills and Cargill are already operating large-scale regenerative sourcing programs, which accelerate commercialization through existing procurement networks and established farm relationships. Asia-Pacific is emerging as the fastest-growing region due to increasing food security concerns following the 2026 Strait of Hormuz disruption, which has exposed fertilizer and energy supply vulnerabilities.
FAO, IFPRI, and the International Rice Research Institute have highlighted risks to rice and staple crop production linked to nitrogen and energy input constraints. This has shifted regenerative agriculture from a sustainability-driven concept to a national input security strategy in countries such as India, Vietnam, and Indonesia, where governments are increasingly prioritizing nitrogen reduction, biological inputs, and domestic soil health resilience as part of broader agricultural policy frameworks.
Key Regions and Countries Covered in this Report
- North America
- The US
- Canada
- Europe
- Germany
- France
- The UK
- Spain
- Italy
- Russia & CIS
- Rest of Europe
- APAC
- China
- Japan
- South Korea
- India
- ASEAN
- Rest of APAC
- Latin America
- Brazil
- Mexico
- Rest of Latin America
- Middle East & Africa
- GCC
- South Africa
- Rest of MEA
Key Players Analysis
Regenerative agriculture players like Indigo Ag, Regrow Ag, and Truterra are increasingly focusing on strengthening supply chain integration, verified sourcing systems, and biological input differentiation to remain competitive in a market increasingly driven by procurement requirements rather than sustainability claims. A key priority is building farmer enrollment platforms that combine per-acre incentive payments, digital MRV tools, and agronomist support, enabling faster scaling of acreage while still meeting the verification standards required for food manufacturer Scope 3 programs.
There is also a growing shift toward outcome-based contracting, where farmers are rewarded not just for practice adoption but for verified improvements in soil health and emissions outcomes, improving credibility for institutional buyers. Companies are expanding vertical integration across the agricultural value chain by linking commodity traders, food manufacturers, and biological input providers into shared sourcing programs, helping distribute transition costs and secure origin-verified supply at scale.
Geographic expansion across European rapeseed markets and North American grain corridors is also increasing, driven by concentrated Scope 3 reduction demand under tightening EU Corporate Sustainability Reporting Directive requirements. Leading players are further investing in proprietary MRV systems, satellite-based verification, and registry-aligned credit issuance, while securing multi-year supply agreements with major food manufacturers to lock in demand and strengthen positioning in premium regenerative commodity markets.
The Following are some of the Major Players in the Industry
- Indigo Ag, Inc.
- Bayer AG
- Syngenta AG
- Corteva Agriscience
- General Mills, Inc.
- Danone S.A.
- Nestlé S.A.
- Unilever PLC
- Patagonia, Inc.
- Cargill, Incorporated
- Soil Capital Belgium SPRL
- Regrow Ag, Inc.
- Alter Eco Foods
- Continuum Ag
- Grounded South Africa
- Other Key Players
Recent Development
- In May 2026, Louis Dreyfus Company and PepsiCo announced a regenerative agriculture program in Saskatchewan, Canada, targeting 45,000 acres of canola production in 2026, scaling from 25,000 acres supported across 16 farms in 2025 with agronomic training delivered through the Canadian Prairies Trusted Advisor Partnership.
- In April 2026, Nestlé entered a four-year regenerative agriculture agreement with Soil Capital covering key sourcing regions in France, Belgium, and the United Kingdom, deploying digital monitoring tools and outcome-linked farmer payments to address Scope 3 emissions embedded in European agricultural supply chains.
Report Scope
| Report Features | Description |
|---|---|
| Market Value (2025) | USD 15.5 Bn |
| Forecast Revenue (2035) | USD 80.9 Bn |
| CAGR (2026-2035) | 18.0% |
| Base Year for Estimation | 2025 |
| Historic Period | 2020-2024 |
| Forecast Period | 2026-2035 |
| Report Coverage | Revenue Forecast, Market Dynamics, Competitive Landscape, Recent Developments |
| Segments Covered | By Farming Practice (Agroforestry, Silvopasture, Cover Cropping, Crop Rotation, No-till / Conservation Tillage, and Holistic Planned Grazing), By Application (Carbon Sequestration & Soil Health, Biodiversity Enhancement, Water Management, Livestock Integration, and Organic Food Production), By Farm Type (Large-scale Commercial Farms, Small & Medium Farms, Livestock Farms, and Mixed Farms), By Component (Services, Solutions/Platforms, Monitoring & Verification Tools, and Carbon Credit Programs), By End-user (Farmers & Growers, Food & Beverage Companies, Government & NGOs, and Carbon Market Participants), By Distribution / Support Channel (Direct Partnerships, Cooperatives, Digital Platforms, and Government Programs) |
| Regional Analysis | North America – The US & Canada; Europe – Germany, France, The UK, Spain, Italy, Russia & CIS, Rest of Europe; APAC- China, Japan, South Korea, India, ASEAN & Rest of APAC; Latin America- Brazil, Mexico & Rest of Latin America; Middle East & Africa- GCC, South Africa, & Rest of MEA |
| Competitive Landscape | Indigo Ag, Inc., Bayer AG, Syngenta AG, Corteva Agriscience, General Mills, Inc., Danone S.A., Nestlé S.A., Unilever PLC, Patagonia, Inc., Cargill, Incorporated, Soil Capital Belgium SPRL, Regrow Ag, Inc., Alter Eco Foods, Continuum Ag, Grounded South Africa, Other Key Players |
| Customization Scope | Customization for segments and region/country-level will be provided. Moreover, customization can be tailored to the requirements. |
| Purchase Options | We have three licenses to opt for: Single User License, Multi-User License (Up to 5 Users), Corporate Use License (Unlimited Users and Printable PDF) |


