


Report Overview
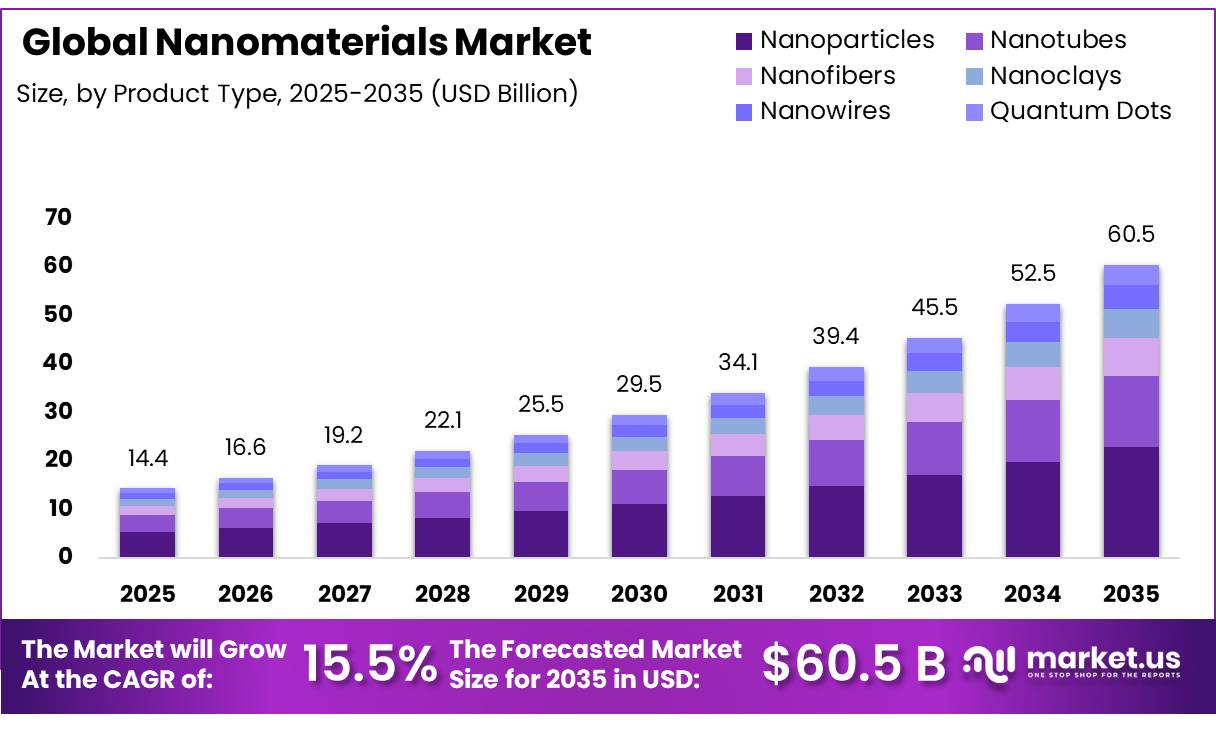
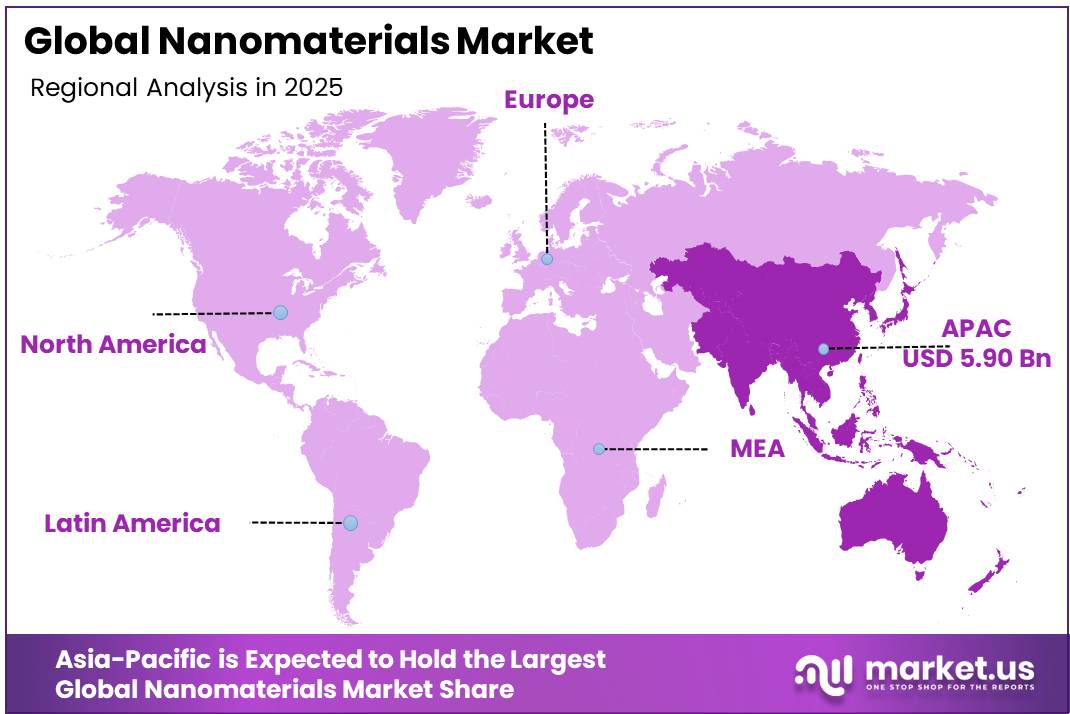
In 2025, the Global Nanomaterials Market was valued at US$14.4 billion, and between 2026 and 2035, this market is projected to grow at a CAGR of 15.5%, reaching about US$60.5 billion by 2035. In 2025, Asia Pacific led the market, accounting over 41.0% share with a revenue of US$5.9 Billion. This accelerated expansion is largely fueled by the increasing demand for advanced, lightweight materials across the healthcare, aerospace, and electronics sectors.
Nanomaterials are positioned within the specialty chemicals and advanced materials industry because their value comes from controlled particle size, surface chemistry, purity, dispersion, and functional performance. The European Commission defines nanomaterials through particles where 50% or more have one or more external dimensions below 100 nm, showing why regulation treats them as chemical forms rather than only finished products. This places titanium oxide, carbon nanotubes, silver, alumina, gold, and quantum dots inside a regulated materials platform.
- The industrial scenario is supported by chemicals, electronics, healthcare, energy storage, aerospace, coatings, and packaging demand. Cefic reported that Europe’s chemical industry generated €635 billion turnover and employed 1.2 million people, while Europe held 13% of global chemical sales and China 46%.
Key Takeaways
- The Global Nanomaterials Market was valued at US$14.4 billion in 2025.
- The Global market is projected to grow at a CAGR of 15.5% and is estimated to reach US$60.5 billion by 2035.
- Based on the material type, titanium-based materials led the nanomaterials market, comprising 24.0% of the total market.
- Based on product type, nanoparticles dominated the market, constituting a substantial 38.0% of the total revenue share.
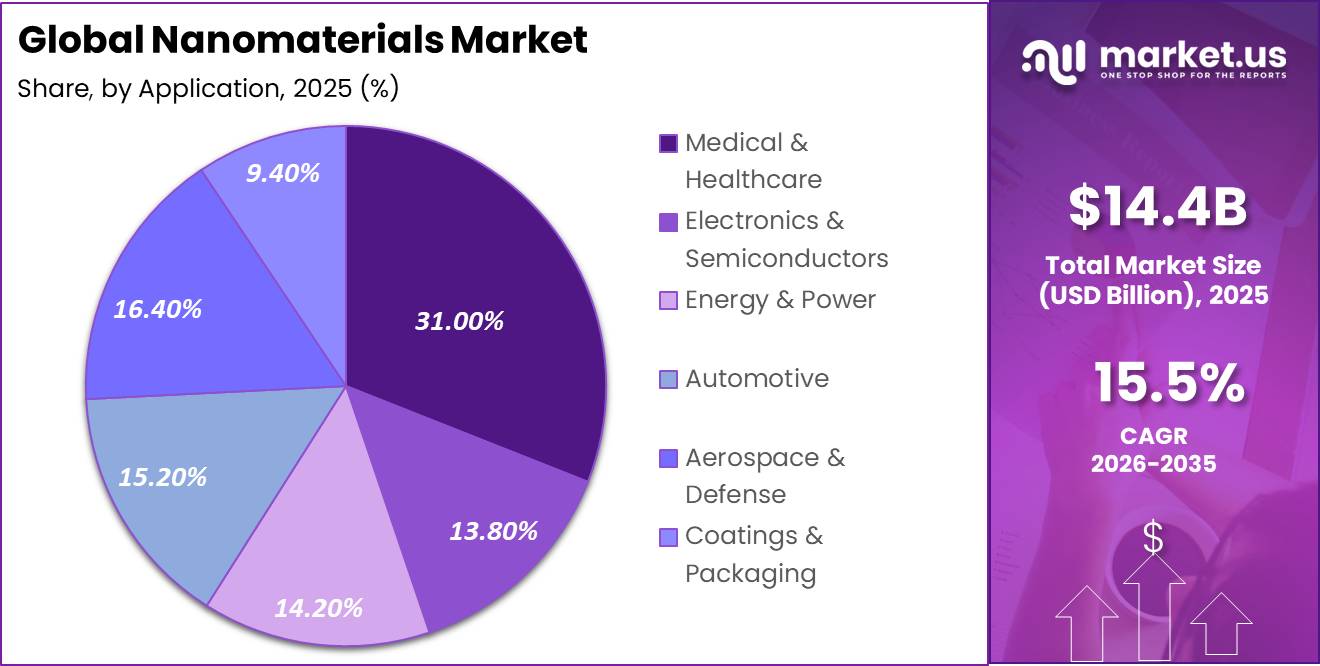
- Based on application, medical & healthcare led the market, commanding a major share of 31.0%.
- Based on the end-use industry, electronics led the market, commanding a major share of 33.0%.
- Among the technologies, conventional nanomaterials dominated the market, with a substantial market share of around 71.0%.
- Among the distribution channels, direct/B2B sales is the most considerable within the market, accounting for around 74.0% of the revenue.
- In terms of geographic layout, the Asia-Pacific was the most dominant region in the nanomaterials market, accounting for 41.0% of the total global share.
Driving factors include miniaturization in semiconductors, higher surface-area catalysts, antimicrobial coatings, lightweight composites, battery additives, diagnostics, and drug-delivery systems. In 2024, EU27 chemical capital spending reached €28.4 billion, while research and innovation spending stayed at €10.4 billion, giving advanced material producers a funding base for pilot plants, testing, and formulation upgrades. Demand is also strengthened by users seeking lower weight, better conductivity, stronger barrier performance, and more precise medical functionality.
Government initiatives continue to shape growth opportunities. The United States National Nanotechnology Initiative requested $2.2 billion for 2025 across 12 agencies, with five organizations representing 98% of the total, and Nano4EARTH linked roughly 10% of selected agency funding to clean energy, efficiency, and environmental sustainability. The United States Environmental Protection Agency had reviewed over 160 nanoscale material notices since 2005, while its August 14, 2017 rule required reporting of existing exposure, production volume, use, and safety information for safer commercialization and future market authorization across regulated economies.
Material Type Analysis
Titanium-based Nanomaterials dominate with 24.00% due to strong use across industrial applications
In 2025, Titanium-based Nanomaterials held a dominant market position, capturing more than a 24.00% share of the Nanomaterials Market. The segment remained leading in December 2025 because titanium-based nanomaterials are widely used in coatings, catalysts, medical surfaces, energy devices, and advanced industrial formulations. Their high durability, chemical stability, corrosion resistance, and compatibility with large-scale production made them a preferred material choice for manufacturers. The segment also benefited from steady demand in performance coatings and functional materials where strength, surface activity, and long service life are important.
Silver Nanomaterials emerged as the fastest growing segment in 2026, supported by rising use in antimicrobial coatings, wound care, medical devices, electronics, textiles, and packaging. Their strong conductivity and hygiene-related performance helped increase adoption across healthcare and consumer-facing applications.
Product Type Analysis
Nanoparticles dominate with 38.00% due to wider use across advanced material applications
In 2025, Nanoparticles held a dominant market position, capturing more than a 38.00% share of the Nanomaterials Market. The segment remained the leading product type in December 2025 because nanoparticles are widely used in coatings, healthcare products, electronics, catalysts, packaging, and energy-related materials. Their small particle size, high surface area, and flexible formulation properties made them suitable for both industrial and research-based applications. Manufacturers preferred nanoparticles because they can improve strength, reactivity, conductivity, barrier performance, and functional efficiency across several end-use products.
Quantum Dots emerged as the fastest growing segment in 2026, helped by rising use in display technologies, imaging, lighting, sensors, diagnostics, and semiconductor-related applications. Their ability to improve brightness, precision, and electronic performance supported stronger interest from high-value technology users.
Application Analysis
Medical & Healthcare leads with 31.00% as nanomaterials gain wider clinical use
In 2025, Medical & Healthcare held a dominant market position, capturing more than a 31.00% share of the Nanomaterials Market. The segment stayed ahead in December 2025 because nanomaterials are increasingly used in drug delivery, diagnostics, wound care, imaging, implants, antimicrobial medical surfaces, and targeted treatment systems. Their ability to improve precision, surface activity, and material performance made them valuable in modern healthcare applications. Medical manufacturers also used nanomaterials to support better product functionality, controlled release, and improved interaction with biological systems.
Aerospace & Defense continued as a growing segment in 2026, supported by rising use of nanomaterials in lightweight aircraft parts, stronger protective coatings, thermal barriers, sensors, stealth materials, and high-performance defense systems.
End Use Industry Analysis
Electronics dominates with 33.00% as nanomaterials support smaller and stronger device components
In 2025, Electronics held a dominant market position, capturing more than a 33.00% share of the Nanomaterials Market. The segment remained the leading end-use industry in December 2025 because nanomaterials are widely used in semiconductors, sensors, displays, conductive films, printed electronics, memory devices, and miniaturized components. Their high surface area, conductivity, thermal stability, and ability to improve product performance made them important for advanced electronic manufacturing. Healthcare, Energy Storage, Construction, Chemicals, and Consumer Goods also supported demand, as nanomaterials helped improve durability, efficiency, protection, and functional value across different industrial applications.
Healthcare emerged as the fastest growing segment in 2026, supported by rising use of nanomaterials in diagnostics, drug delivery, wound care, imaging, implants, antimicrobial surfaces, and targeted treatment systems. The segment gained stronger attention as medical producers looked for materials that could improve precision, safety, and performance in advanced healthcare products.
Technology Analysis
Conventional Nanomaterials dominate with 71.00% due to mature use across industrial applications
In 2025, Conventional Nanomaterials held a dominant market position, capturing more than a 71.00% share of the Nanomaterials Market. The segment remained ahead in December 2025 because these materials are already well accepted across coatings, electronics, healthcare products, catalysts, packaging, construction materials, and energy-related applications. Their stronger commercial availability, easier processing, proven performance, and wider supplier base helped manufacturers use them at scale with lower technical risk. Advanced Functional Nanomaterials also gained attention in 2025, mainly for high-performance uses where improved conductivity, strength, thermal control, or surface activity was required.
Smart Nanomaterials emerged as the fastest growing segment in 2026, supported by rising use in sensors, targeted drug delivery, responsive coatings, smart packaging, diagnostics, and adaptive electronic systems. Their ability to react to heat, light, pressure, pH, or magnetic signals made them more attractive for next-generation healthcare, electronics, defense, and energy applications.
Distribution Channel Analysis
Direct/B2B Sales dominates with 74.00% due to stronger control over bulk industrial supply
In 2025, Direct/B2B Sales held a dominant market position, capturing more than a 74.00% share of the Nanomaterials Market. The segment remained the leading distribution channel in December 2025 because most nanomaterial buyers are industrial users, research organizations, laboratories, electronics producers, healthcare manufacturers, coating companies, and energy-related firms that need technical documents, purity details, customized grades, safety handling support, and steady bulk supply. Direct business-to-business sales helped suppliers maintain closer control over specifications, pricing, quality checks, and long-term contracts, which is important for high-value materials such as nanoparticles, nanotubes, nanofibers, nanoclays, nanowires, and quantum dots. Distributors & Suppliers also supported the market by improving product access for smaller buyers and regional users.
Online Scientific Platforms emerged as the fastest growing segment in 2026, driven by easier product comparison, faster sample ordering, digital technical sheets, and wider access to specialty nanomaterials for laboratories, universities, startups, and small-scale manufacturers.
Key Market Segments
By Material Type
- Titanium-based Nanomaterials
- Carbon Nanotubes (CNT)
- Silver Nanomaterials
- Aluminum Oxide Nanomaterials
- Gold Nanomaterials
- Silicon & Quantum Dots
- Others
By Product Type
- Nanoparticles
- Nanotubes
- Nanofibers
- Nanoclays
- Nanowires
- Quantum Dots
By Application
- Medical & Healthcare
- Electronics & Semiconductors
- Energy & Power
- Automotive
- Aerospace & Defense
- Coatings & Packaging
By End-Use Industry
- Electronics
- Healthcare
- Energy Storage
- Construction
- Chemicals
- Consumer Goods
By Technology
- Conventional Nanomaterials
- Advanced Functional Nanomaterials
- Smart Nanomaterials
By Distribution Channel
- Direct/B2B Sales
- Distributors & Suppliers
- Online Scientific Platforms
Drivers
AI‑driven nanomaterials R&D acceleration and self‑driving labs
By 2025, “AI for science” had established itself as a structural lever in nanomaterials R&D, actively reducing reasoning and decision‑making time across the hypothesis → formulation → testing → iteration workflow. Combined with automated platforms and “self‑driving labs” capable of generating data 24/7, AI models for property prediction and structure generation are reducing experimental cycles by double‑digit percentages—e.g., cutting the number of physical iterations needed to converge on target properties by 30–50% and trimming development timelines from 5–7 years historically toward 3–5 years for many classes of nanomaterials.
The commercial impact is twofold: first, faster R&D throughput allows suppliers to introduce new nanomaterial grades and application‑specific variants more frequently, increasing portfolio refresh and capturing incremental mix‑driven revenue; second, reduced per‑project cost improves project NPV and supports more risk‑taking around novel architectures. As AI‑enabled tools become mainstream in US, EU, Japan and Korean research hubs through 2026–2030, a realistic incremental uplift of around +1.6 percentage points to CAGR emerges, because the technology changes not demand directly but the rate at which commercially viable nanomaterials can be discovered, qualified and scaled.
Drivers Impact Analysis
| Driver | (~) % Impact on CAGR Forecast | Geographic Relevance | Impact Timeline |
|---|---|---|---|
| Energy transition catalysts, batteries and membranes pushing nanomaterials adoption | +2.0% | North America core, EU, APAC industrial corridors | Long term (≥ 4 years) |
| AI-driven nanomaterials R&D acceleration and self-driving labs | +1.6% | US, EU research hubs, Japan, Korea | Medium term (2-4 years) |
| Regulatory maturation and safety frameworks for manufactured nanomaterials | +1.2% | EU regulatory hubs, US, OECD markets | Medium term (2-4 years) |
| Scaling of nanocomposites and 3D-printed nanomaterials in manufacturing | +1.8% | North America, EU, China, broader APAC | Long term (≥ 4 years) |
| Defense and aerospace performance requirements for lightweight, high-strength materials | +1.4% | US, EU, China, key defense economies | Long term (≥ 4 years) |
| Asia-Pacific industrial policy and capacity expansion in nanomaterials | +1.5% | China, Japan, Korea, India, ASEAN | Medium term (2-4 years) |
Restraints
Nanomedicine regulatory ambiguity and slow approvals
Nanomedicine regulation remains a primary hard restraint because neither engineered nanoparticles nor many nano‑enabled products are subject to dedicated, harmonized regulatory frameworks, and leading agencies like the US FDA and EPA have so far issued only draft guidance documents rather than formal nano‑specific regulations, leaving companies without clear, standardized pathways for clinical approval and market access. Conflicting size‑based definitions—e.g., 1–100 nm by the US National Nanotechnology Initiative, 0.2–100 nm by the UK Royal Society/Royal Academy of Engineering, and up to 300 nm by Friends of the Earth Australia—underscore the lack of universal thresholds and make jurisdictional boundaries for nano‑products ambiguous.
This ambiguity forces nanomaterials firms and pharma/biotech partners to undertake extensive bespoke characterization, tox studies, and regulatory consultations for each candidate, which can stretch development and approval timelines by 2–4 years compared to non‑nano alternatives, tying up tens to hundreds of millions of dollars in R&D and clinical spend per asset while revenue remains deferred.
Given that healthcare is one of the most lucrative end‑uses for nanomaterials, this drag is modeled as about a 1.7 percentage‑point reduction in overall nanomaterials CAGR, reflecting delayed or abandoned nanomedicine projects, higher cost of capital for nano‑therapeutics, and cautious adoption by large pharma, particularly in US, EU and Japan where regulatory scrutiny is highest and risk committees often favor better‑understood modalities over nano‑platforms despite their potential.
Restraint Impact Analysis
| Restraint | (~) % Impact on CAGR | Geographic Relevance | Impact Timeline |
|---|---|---|---|
| Nanomedicine regulatory ambiguity and slow approvals | -1.7% | US, EU, Japan, regulatory hubs | Long term (≥ 4 years) |
| High capex and financing risk for nanomaterial scale-up plants | -1.4% | Global, APAC and EU industrial corridors | Medium term (2-4 years) |
| Premium nano-grade production costs and margin compression | -1.3% | Global, especially advanced applications | Medium term (2-4 years) |
| Safety, liability and public-perception concerns around nanoparticles | -1.1% | US, EU, high-regulation markets | Long term (≥ 4 years) |
| Supply-chain brittleness for specialized nanomaterial inputs | -1.0% | APAC logistics, global high-tech hubs | Medium term (2-4 years) |
| Fragmented standards and definitions for nanomaterials | -0.9% | Global, OECD and emerging markets | Long term (≥ 4 years) |
Opportunity
Nanomaterials platforms for industrial water and carbon services
Emerging analyses highlight nanomaterials’ role in water treatment, environmental remediation and carbon capture, but much of the deployment remains fragmented across projects and pilot plants rather than structured, scalable platforms. Industrial water and carbon services markets covering nanofiltration membranes, nano‑adsorbents, photocatalytic coatings and CO₂‑capture sorbents represent untapped TAM in the tens of billions of dollars across heavy industry, utilities and commercial real estate, yet nanomaterials vendors mostly sell products as discrete inputs rather than as performance‑backed service offerings.
This could lift realized margins by 300–500 basis points versus commodity sales, since customers pay for avoided regulatory penalties, reduced chemical consumption or energy savings, and can lower their own capex burden by shifting to Opex models. If nanomaterials suppliers capture even 3–5% of the global industrial water and early carbon‑capture service markets by 2032 through such platforms, incremental annual nanomaterials revenue could reach mid‑single‑digit billions, supporting roughly +1.5 percentage points of CAGR upside.
Opportunity Impact Analysis
| Opportunity | (~) % Potential CAGR Upside | Geographic Relevance | Execution Window |
|---|---|---|---|
| Space-based nanotechnology and satellite materials | +1.6% | US, EU, Japan, India, China | Long term (≥ 4 years) |
| Nanomaterials platforms for industrial water and carbon services | +1.5% | EU, North America, GCC, China | Medium term (2-4 years) |
| Agricultural nano-inputs and food packaging shelf-life solutions | +1.3% | APAC emerging, LatAm, Africa, EU | Long term (≥ 4 years) |
| Subscription-based data, modeling and design services around nanomaterials | +1.2% | Global OEMs and brand owners | Medium term (2-4 years) |
| Nanomaterial-enabled additive manufacturing ecosystems | +1.4% | North America, EU, China, Korea | Long term (≥ 4 years) |
| Regional M&A roll-ups of niche nanomaterial producers | +1.1% | APAC, Europe, North America | Medium term (2-4 years) |
Challenge
Advanced materials and data talent scarcity
Global talent‑shortage analyses indicate that enterprises face skills gaps approaching 40% by 2027, with 63% of employers citing shortages as the main barrier to transformation and acute deficits in engineering, healthcare and tech roles; surveys suggest that over 70% of employers worldwide struggled to hire in 2026. Nanomaterials sit at the intersection of chemistry, materials science, process engineering and data‑driven AI modeling, meaning that companies must compete in some of the most constrained labour pools for PhD‑level scientists, computational modelers and experienced plant engineers.
Practically, R&D organizations may run 10–20% below ideal headcount in critical specialties, leading to backlog in project pipelines: development cycles that could be compressed into 3–4 years with fully staffed teams instead stretch to 5–6 years, and the number of concurrent development programmes is capped by available expert bandwidth even when capex is ready.
Challenges Impact Analysis
| Challenge | (~) % CAGR Friction | Geographic Relevance | Mitigation Horizon |
|---|---|---|---|
| Scale-up complexity and yield variability | -1.3% | APAC industrial hubs, EU, US | Medium term (2-4 years) |
| Advanced materials and data talent scarcity | -1.1% | North America, Europe, Japan, Korea | Long term (≥ 4 years) |
| Nano supply-chain vulnerability and visibility gaps | -1.0% | APAC logistics corridors, global high-tech hubs | Medium term (2-4 years) |
| Customer education and value-proposition misalignment | -0.9% | Global OEMs, mid-tier manufacturers | Long term (≥ 4 years) |
| Integration friction into legacy processes and QA systems | -0.8% | Global, especially mature industrial bases | Long term (≥ 4 years) |
| Cyber, IP and data-security risks in AI-enabled nano R&D | -0.7% | Global R&D hubs, large materials players | Medium term (2-4 years) |
Geopolitical Impact Analysis
Geopolitical Disruption Assessment and Supply Chain Impact on Nanomaterials Market.
Geopolitical developments are creating significant challenges for the nanomaterials market by increasing supply chain risks and raw material procurement costs. China remains the dominant supplier of critical minerals, accounting for 69.2% of global rare earth mine production in 2024. According to the IEA’s Global Critical Minerals Outlook 2025, China also processed 70–95% of global lithium and cobalt at the midstream level, materials widely used in carbon nanotubes, graphene composites, quantum dots, and advanced battery nanomaterials.
On April 4, 2025, China introduced export controls on seven rare earth elements, including dysprosium, terbium, and yttrium. These restrictions were expanded on October 9, 2025, through Announcement No. 62, requiring export licenses for products containing 0.1% or more Chinese-origin rare earth content. The policy has increased procurement uncertainty, approval timelines, and supply risks across the nanomaterials value chain. Although a temporary suspension was agreed upon in late October 2025, with a deadline of November 10, 2026, manufacturers continue to accelerate supply diversification strategies.
At the same time, logistics disruptions are adding further cost pressures. The IMF reported that Suez Canal trade declined by 50% during the first two months of 2024, forcing vessels to reroute around the Cape of Good Hope and adding 10+ days to transit times. UNCTAD noted that freight rates on the Shanghai–Genoa route increased by 350% between December 2023 and February 2024. The organization also projects that elevated shipping costs could raise global consumer prices by 0.6% by 2025. For nanomaterial manufacturers, longer shipping times increase inventory costs, insurance expenses, and material handling risks, resulting in higher production costs and extended delivery timelines for semiconductor, electronics, and pharmaceutical customers.
Regional Analysis
Asia Pacific Held the Largest Share of the Global Nanomaterials Market.
Asia-Pacific dominated the global nanomaterials market with a 41.0% market share, and it is expected to remain the fastest-growing regional market throughout the forecast period. The region’s dominance is principally supported by large-scale semiconductor manufacturing capacity, increased electric vehicle battery production, sophisticated electronics exports, and significant government-backed nanotechnology investments in China, Japan, South Korea, Taiwan, and India. According to World Population Review, Asia-Pacific continues to account for more than half of the world population, offering a sizable industrial workforce and high consumer electronics demand.
Similarly, North America leads in semiconductor and nanomedicine investments, whilst Europe focuses on sustainability-driven automotive nanocomposites and green manufacturing. Meanwhile, Latin America promotes slow adoption through agricultural chemicals and water treatment, whilst the Middle East concentrates on graphene-based desalination and smart infrastructure. However, both of these regions remain hampered by their reliance on imported high-performance materials.
Key Regions and Countries Covered
- North America
- The US
- Canada
- Europe
- Germany
- France
- The UK
- Spain
- Italy
- Russia & CIS
- Rest of Europe
- APAC
- China
- Japan
- South Korea
- India
- ASEAN
- Rest of APAC
- Latin America
- Brazil
- Mexico
- Rest of Latin America
- Middle East & Africa
- GCC
- South Africa
- Rest of MEA
Key Players Analysis
Nanomaterial manufacturers focus on product purity, particle-size control, surface modification, and application-specific performance to protect their competitive position. A major priority is developing customized grades for electronics, healthcare, energy storage, coatings, aerospace, and advanced industrial use. Suppliers are also improving dispersion quality, batch consistency, and safety documentation, as end users need reliable materials that can meet strict technical and regulatory requirements before commercial adoption.
The competitive landscape remains innovation-led, with companies investing in pilot-scale production, process automation, testing capabilities, and long-term customer partnerships. Stronger players use technical support, intellectual property, and specialized formulation know-how to build customer loyalty in high-value applications. Direct supply relationships with electronics firms, medical product developers, coating producers, and research institutions help improve demand visibility and reduce sales uncertainty. At the same time, smaller specialty producers compete through niche materials, flexible customization, and faster sample development, keeping the market active and technology-driven.
Market Key Players
- 3M
- BASF
- DuPont
- Merck Group
- Cabot Corporation
- American Elements
- Nanoshel
- US Research Nanomaterials
- nanoComposix
- SkySpring Nanomaterials
- Nanophase Technologies
- Nanosys
- Nanoco Technologies
- Showa Denko
- Arkema
Key Development
- In January 2026, Cabot Corporation signed a multi-year supply agreement with PowerCo SE, a battery manufacturing subsidiary of Volkswagen Group. Under the agreement, Cabot will supply advanced conductive carbons and conductive dispersions for electric vehicle battery electrodes, supporting higher conductivity, energy density, fast charging, and longer battery life.
- In January 2026, Nanosys showcased a new quantum dot display prototype at CES 2026. The prototype used a dual wavelength red pixel concept and focused on photobiomodulation-related display research, showing how quantum dots may support human-centric screens with improved color, brightness, and display functionality.
- In March 2026, Arkema presented its nanomaterial-based composite solutions at JEC World Trade Show in Paris. The company highlighted Graphistrength multiwall carbon nanotubes for stronger composites and Nanostrength self-assembling block copolymers that organize at the nanometer scale for advanced material performance.
Report Scope
| Report Features | Description |
|---|---|
| Market Value (2025) | US$14.4 Bn |
| Forecast Revenue (2035) | US$60.5 Bn |
| CAGR (2026-2035) | 15.5% |
| Base Year for Estimation | 2025 |
| Historic Period | 2020-2024 |
| Forecast Period | 2026-2035 |
| Report Coverage | Revenue Forecast, Market Dynamics, Competitive Landscape, Recent Developments |
| Segments Covered | By Material Type (Titanium-based Nanomaterials, Carbon Nanotubes (CNT), Silver Nanomaterials, Aluminum Oxide Nanomaterials, Gold Nanomaterials, Silicon & Quantum Dots, Others), By Product Type (Nanoparticles, Nanotubes, Nanofibers, Nanoclays, Nanowires, Quantum Dots), By Application (Medical & Healthcare, Electronics & Semiconductors, Energy & Power, Automotive, Aerospace & Defense, Coatings & Packaging), By End-Use Industry (Electronics, Healthcare, Energy Storage, Construction, Chemicals, Consumer Goods), By Technology (Conventional Nanomaterials, Advanced Functional Nanomaterials, Smart Nanomaterials), By Distribution Channel (Direct/B2B Sales, Distributors & Suppliers, Online Scientific Platforms) |
| Regional Analysis | North America – The US & Canada; Europe – Germany, France, The UK, Spain, Italy, Russia & CIS, Rest of Europe; APAC- China, Japan, South Korea, India, ASEAN & Rest of APAC; Latin America- Brazil, Mexico & Rest of Latin America; Middle East & Africa- GCC, South Africa, & Rest of MEA |
| Competitive Landscape | 3M, BASF, DuPont, Merck Group, Cabot Corporation, American Elements, Nanoshel,US Research Nanomaterials, nanoComposix, SkySpring Nanomaterials, Nanophase Technologies, Nanosys, Nanoco Technologies, Showa Denko, Arkema |
| Customization Scope | Customization for segments, region/country-level will be provided. Moreover, additional customization can be done based on the requirements. |
| Purchase Options | We have three licenses to opt for: Single User License, Multi-User License (Up to 5 Users), Corporate Use License (Unlimited Users and Printable PDF) |





































