


Report Overview
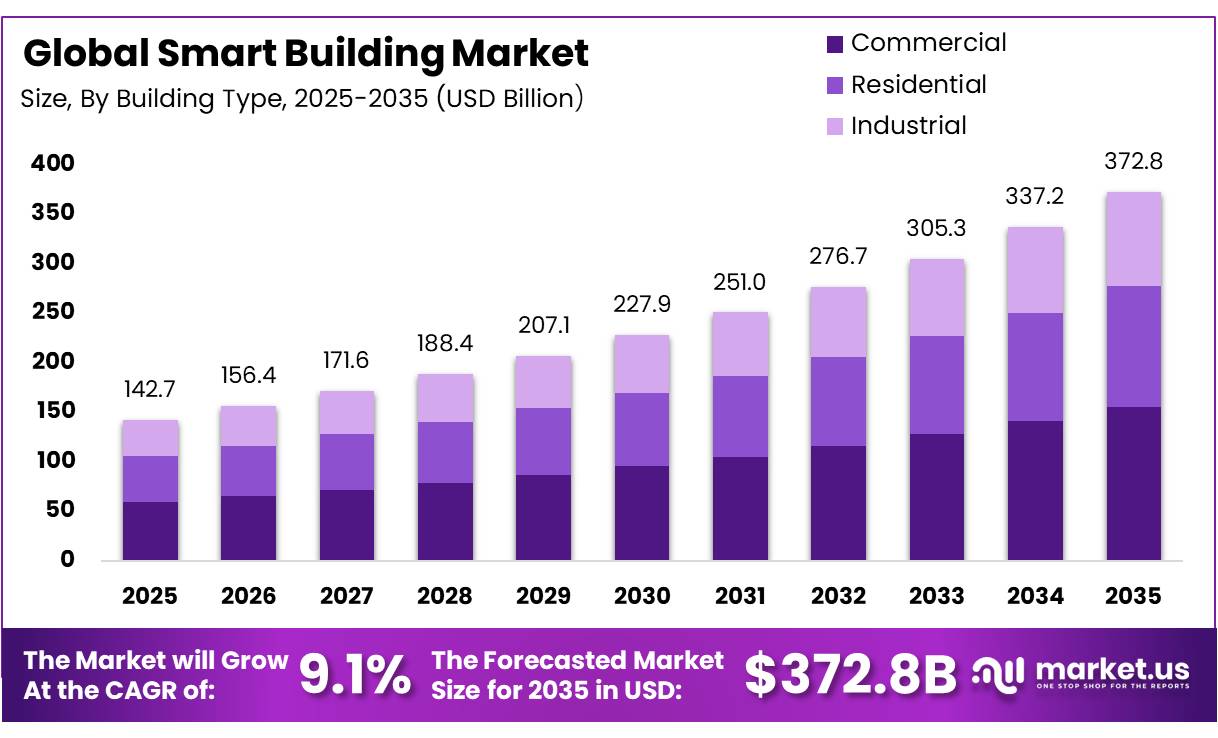
In 2025, the Smart Building Market was valued at USD 142.7 billion, and between 2026 and 2035, this market is estimated to register a CAGR of 9.1%, reaching about USD 372.8 billion by 2035. North America held a dominant market position, capturing more than a 34.7% share, holding USD 49.52 billion in revenue.
The smart building sector sits at the intersection of energy efficiency, digital infrastructure, and sustainable urban development. Building operations account for 30% of global final energy consumption and 26% of global energy related emissions, with 8% being direct emissions and 18% stemming from electricity and heat production used in buildings. Buildings also consume more than half of global electricity, making the sector one of the most critical targets for energy efficiency intervention worldwide.
Key Takeaways
- The global smart building market was valued at US$142.7 billion in 2025.
- The global smart building market is projected to grow at a CAGR of 9.1% and is estimated to reach US$372.8 billion by 2035.
- On the basis of building type, the commercial segment dominated the market, constituting 41.8% of the total market share.
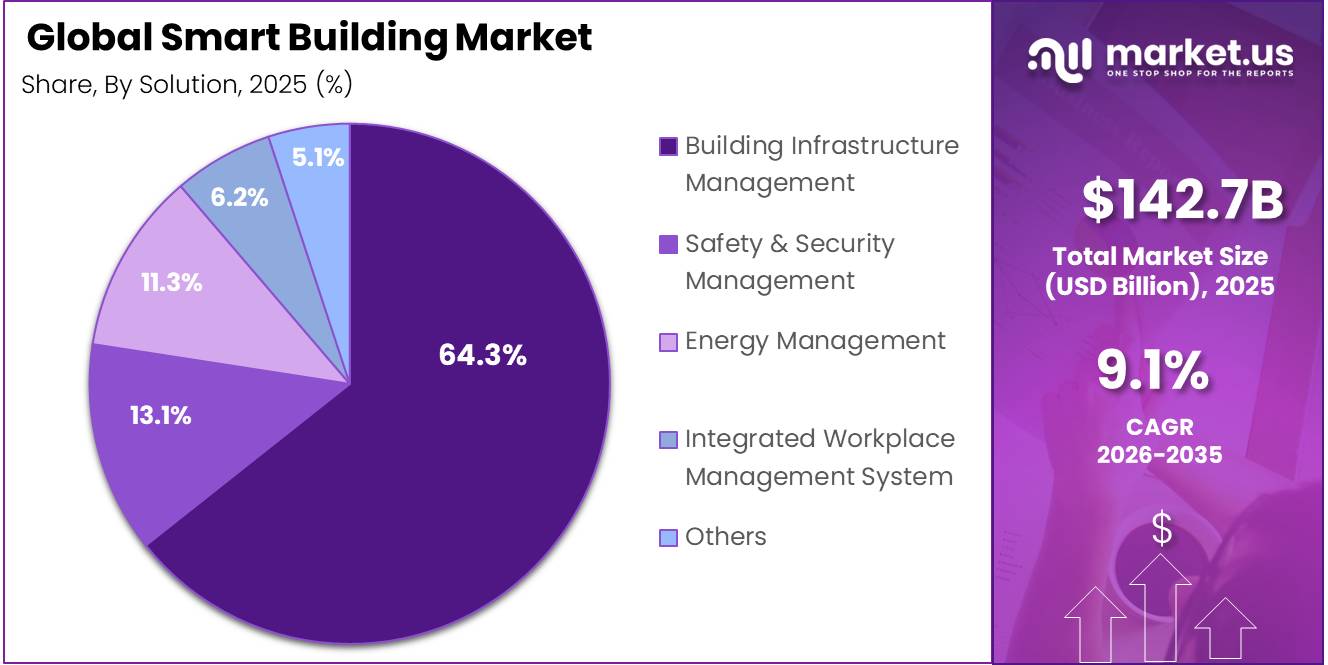
- Based on the solution, Building Infrastructure Management dominated the market, with a substantial market share of around 64.34%.
- Based on the service, Implementation dominated the smart building market, accounting for 46.8% of the total market share.
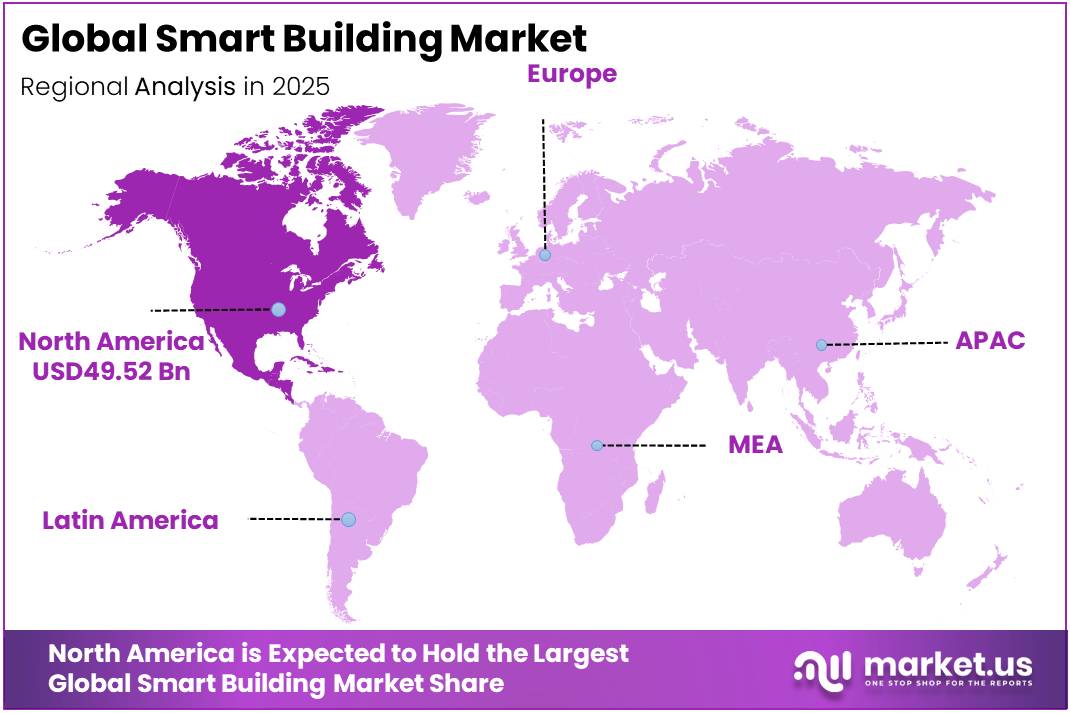
- In 2025, North America was the most dominant region in the smart building market, accounting for 34.7% of the global market.
The sector’s growth is driven by escalating energy demand and the economic cost of inefficiency. In the United States, residential and commercial buildings account for approximately 40% of total national energy consumption, 74% of electricity use, and 35% of total carbon emissions, with an estimated one third of that energy wasted at a cost of USD 150 billion annually. Globally, electricity consumption in buildings grew by more than 600 TWh, a 5% increase in 2024, accounting for nearly 60% of total growth in global electricity consumption. These pressures are compelling building owners and facility managers to adopt smart energy management solutions at scale.
- Government initiatives are strongly shaping adoption. In 2024, governments allocated approximately USD 60 billion for efficiency measures specifically in buildings, bringing total government efficiency funding over five years to above USD 1 trillion. The U.S. DOE (Department of Energy) committed USD 61 million to 10 Connected Communities pilot projects to deploy smart, grid interactive building technologies across homes and commercial facilities.
In the European Union, the revised EPBD (Energy Performance of Buildings Directive), published as EU/2024/1275 and entering into force on 28 May 2024, mandates renovation of the 16% worst performing non-residential buildings by 2030 and 26% by 2033, directly catalysing smart technology procurement. Buildings constructed after energy codes are introduced can use up to 50% less energy, reinforcing the long term growth opportunity for smart building technologies globally.
By Building Type
Commercial buildings lead with 41.8% as digital infrastructure investments remain strong.
In 2025, Commercial held a dominant market position, capturing more than a 41.8% share of the smart building market. The segment maintained its leadership as offices, shopping centers, hotels, healthcare facilities, and educational institutions continued to invest in connected building technologies to improve operational efficiency and occupant comfort. Facility owners increasingly adopted intelligent systems to manage lighting, heating, ventilation, air conditioning, and security through centralized platforms.
The residential segment is expected to register notable growth over the forecast period as homeowners increasingly adopt smart home technologies for convenience, energy savings, and improved security. Rising awareness of efficient energy use, expanding access to connected devices, and the growing popularity of home automation systems are encouraging wider adoption in new and existing homes. Continued support for energy efficient housing and digital infrastructure is also expected to strengthen demand for smart building solutions across the residential sector.
By Solution
Building Infrastructure Management dominates with 64.34% as building owners prioritize centralized control and operational efficiency.
In 2025, Building Infrastructure Management held a dominant market position, capturing more than a 64.34% share of the smart building market. The segment led adoption as commercial and institutional building operators increasingly focused on integrating lighting, HVAC, power distribution, asset monitoring, and building automation into centralized management platforms.
Safety & Security Management is expected to witness strong growth over the forecast period as organizations increase investments in smart surveillance, access control, fire safety systems, and emergency response technologies. Rising concerns about workplace safety, cyber physical security, and regulatory compliance are encouraging broader adoption of connected security solutions across commercial, residential, and public infrastructure projects. The expansion of intelligent monitoring systems and integrated security platforms is also expected to support continued growth in this segment.
By Service
Implementation leads with 46.8% as smart building deployments continue to expand across new and existing facilities.
In 2025, Implementation held a dominant market position, capturing more than a 46.8% share of the smart building market. The segment accounted for the largest share as organizations increasingly deployed integrated smart building systems across commercial, residential, and industrial properties. The installation and configuration of building automation platforms, connected sensors, HVAC controls, lighting systems, and digital infrastructure remained a key priority during new construction as well as retrofit projects.
Support & Maintenance is expected to experience high growth over the forecast period as the installed base of smart building systems continues to expand. Building operators are placing greater emphasis on maintaining system reliability, software updates, cybersecurity, remote monitoring, and preventive maintenance to ensure uninterrupted operations. As connected building technologies become more advanced and integrated, the need for ongoing technical support and lifecycle management is expected to drive sustained growth in this service segment.
Key Market Segments
By Building Type
- Residential
- Commercial
- Industrial
By Solution
- Building Infrastructure Management
- Safety & Security Management
- Energy Management
- Integrated Workplace Management System
- Others
By Service
- Consulting
- Implementation
- Support & Maintenance
Driver Analysis
Net-zero retrofit mandates
Regulatory tightening is converting smart-building investment from a discretionary facilities upgrade into a compliance and asset-preservation expenditure, with Europe the clearest near-term catalyst. The revised EU Energy Performance of Buildings Directive, in force since 28 May 2024 and due for national transposition by 29 May 2026, requires Member States to renovate the worst-performing 16% of non-residential buildings by 2030 and 26% by 2033; it also establishes zero-emission buildings as the new-build standard, with public-body-owned new buildings subject to the requirement from 2028 and all new buildings from 2030.
This creates an addressable retrofit pipeline for building-management systems (BMS), submeters, HVAC controls, fault-detection-and-diagnostics software and energy-performance dashboards because compliance depends on auditable operational data, not merely equipment replacement. Buildings account for roughly 30% of global energy demand, while commercial and public buildings represent about 30% of building-sector demand, concentrating the opportunity in offices, retail, healthcare, education, airports and public estates.
Drivers Impact Analysis
| Driver | (~) % Impact on CAGR | Geographic Relevance | Impact Timeline |
|---|---|---|---|
| Net-zero retrofit mandates | +2.7 pp | EU core, North America, APAC metros | Medium term (2–4 years) |
| Energy-cost and ESG analytics | +2.1 pp | Global commercial hubs | Short term (≤ 2 years) |
| IoT sensor and wireless scale-up | +1.8 pp | North America, EU, China, India, GCC | Short term (≤ 2 years) |
| AI digital twins and predictive maintenance | +1.6 pp | North America, EU, developed APAC | Medium term (2–4 years) |
| Grid-interactive flexibility and DERs | +1.4 pp | North America, EU, Australia, GCC | Medium term (2–4 years) |
| Smart-city and high-performance construction | +1.2 pp | India, China, ASEAN, Middle East | Long term (≥ 4 years) |
Restraint Analysis
OT Skills Scarcity
The smart-building market is constrained by a persistent shortage of people who can simultaneously understand building services, controls engineering, electrical systems, networking, cloud platforms, cybersecurity and data analytics. A conventional HVAC or electrical contractor may install equipment but lack the expertise to model points, commission interoperable controls, manage secure remote access and validate energy outcomes; conversely, IT teams can manage networks but often lack responsibility for occupant comfort, safety-critical systems and operational technology uptime.
Construction labor data illustrate the broader capacity issue: the U.S. industry was estimated to be short roughly 500,000 skilled-trade workers in 2025, while 41% of the current construction workforce may retire by 2031; in the UK, 58% of firms report difficulty finding skilled workers. The bottleneck increases system-integration labor rates, prolongs commissioning, raises rework risk and limits how rapidly integrators can execute multi-site rollouts across India, ASEAN, the GCC and mature North American and European portfolios.
Restraint Impact Analysis
| Restraint | (~) % Impact on CAGR | Geographic Relevance | Impact Timeline |
|---|---|---|---|
| Legacy retrofit cost | -2.4 pp | North America, EU, Japan, India metros | Medium term (2–4 years) |
| OT/IT cyber exposure | -1.9 pp | North America core, EU, GCC | Short term (≤ 2 years) |
| Protocol fragmentation | -1.7 pp | Global, legacy-heavy estates | Medium term (2–4 years) |
| CapEx and refinancing pressure | -1.5 pp | EU, North America, China | Short term (≤ 2 years) |
| Electrical-equipment bottlenecks | -1.2 pp | North America, EU, APAC corridors | Short term (≤ 2 years) |
| OT skills scarcity | -1.0 pp | Global, India, ASEAN, GCC | Medium term (2–4 years) |
Opportunity Analysis
Data-center Cooling Orchestration
Data-center cooling orchestration is a vertical-specific expansion opportunity because generic office BMS deployments do not adequately address the operational and risk requirements of AI-era compute facilities. Global data-centre electricity consumption was about 415 TWh in 2024, or around 1.5% of global electricity use, and the IEA projects demand to reach roughly 945 TWh by 2030; cooling and environmental control account for approximately 7% of electricity use in efficient hyperscale facilities but can exceed 30% in less-efficient enterprise facilities.
A provider that converts a conventional BMS into a data-centre operations platform could command materially higher recurring revenue per site through 24/7 monitoring, anomaly detection, capacity forecasting, maintenance-risk scoring and energy-market optimization, with service contracts often priced against avoided downtime and infrastructure capacity deferral.
Opportunity Impact Analysis
| Opportunity | (~) % Potential CAGR | Geographic Relevance | Execution Window |
|---|---|---|---|
| Flexibility-as-a-Service | +2.3 pp | North America, EU, Australia | Medium term (2–4 years) |
| Outcome-funded retrofits | +2.0 pp | EU, India, GCC, North America | Short term (≤ 2 years) |
| Data-center cooling orchestration | +1.8 pp | North America, EU, APAC, GCC | Short term (≤ 2 years) |
| Smart-readiness compliance platform | +1.5 pp | EU core, UK, GCC | Medium term (2–4 years) |
| Healthy-building data services | +1.3 pp | North America, EU, developed APAC | Medium term (2–4 years) |
| Fragmented-integrator M&A roll-up | +1.1 pp | North America, EU, India, ASEAN | Long term (≥ 4 years) |
Challenges Analysis
Multi-vendor Data Normalization
Smart-building deployments increasingly fail to scale efficiently not because sensors or controllers cannot be installed, but because data from HVAC, lighting, meters, security, access control, elevators, renewable assets and tenant applications arrive in inconsistent formats, point names, sampling intervals and metadata structures. A single large commercial site can contain several thousand operational data points, while a multi-site portfolio can accumulate tens of thousands of tags across BACnet, Modbus, KNX, DALI, proprietary control interfaces and cloud APIs; if 15–30% of these points require manual naming, validation or re-mapping during onboarding, integration labor can consume a disproportionate share of project margin and delay analytics deployment by weeks or months.
Emerging semantic standards provide a credible path forward—ASHRAE Standard 223P is intended to establish a dictionary of semantic tags for building automation and associated system data, while NIST reports that the standard completed initial public review and is targeted for publication in fiscal year 2026 but market adoption, migration of historical metadata and compatibility with installed systems will remain uneven.
Challenges Impact Analysis
| Challenge | (~) % CAGR Friction | Geographic Relevance | Mitigation Horizon |
|---|---|---|---|
| Multi-vendor data normalization | -1.6 pp | Global legacy estates | Medium term (2–4 years) |
| OT cyber lifecycle management | -1.5 pp | EU, North America, GCC | Long term (≥ 4 years) |
| Controls commissioning capacity | -1.3 pp | North America, EU, India, ASEAN | Long term (≥ 4 years) |
| Component sourcing volatility | -1.1 pp | APAC supply corridors, EU, North America | Medium term (2–4 years) |
| Data governance and consent | -0.9 pp | EU regulatory hubs, North America, APAC metros | Medium term (2–4 years) |
| Performance-verification uncertainty | -0.8 pp | Global commercial portfolios | Medium term (2–4 years) |
Geopolitical Impact Analysis
Geopolitical Impact on the Smart Building Market.
Recent geopolitical conflicts, particularly the ongoing wars in Eastern Europe and the Middle East, have created both challenges and opportunities for the smart building market. Supply chain disruptions have affected the availability of key components such as semiconductors, sensors, controllers, and electrical equipment, leading to longer delivery times and higher project costs. Rising energy prices, especially in Europe following the Russia–Ukraine conflict, have also increased operating expenses for commercial and industrial buildings.
At the same time, these developments have strengthened the demand for smart building solutions. Building owners are looking for technologies that can reduce energy consumption, lower operating costs, and improve energy security. Smart energy management systems, automated lighting, intelligent HVAC controls, and real time monitoring tools are helping facilities optimize electricity use and reduce dependence on expensive energy supplies.
Governments are also increasing investments in energy efficiency and resilient infrastructure as part of broader energy security strategies. This has encouraged the adoption of smart technologies in public buildings, offices, hospitals, and industrial facilities. While global conflicts continue to create uncertainty in equipment sourcing and construction schedules, they have also accelerated the shift toward digital, energy efficient buildings. As a result, the smart building market remains on a growth path, supported by the need for cost savings, operational resilience, and more sustainable building management.
Regional Analysis
Smart Building Market: Regional Analysis North America.
North America stands as the dominant region in the global smart building market, commanding a 34.7% share valued at USD 49.52 billion in 2025. This leadership position is supported by the region’s advanced digital infrastructure, strong commercial real estate sector, and sustained policy support from the federal governments of the United States and Canada.
- In the United States, residential and commercial buildings account for approximately 40% of total national energy consumption and 74% of total electricity consumption, according to the U.S. Department of Energy. These figures highlight the significant opportunity for smart building technologies, including Building Automation Systems (BAS), intelligent lighting, and energy management platforms, to improve efficiency and reduce operating costs.
Federal investment has continued to strengthen the market. The U.S. Department of Energy committed USD 61 million to 10 Connected Communities pilot projects involving more than 7,000 residential and commercial buildings equipped with smart controls, connected devices, and advanced energy management systems. The Department also estimates that Grid Interactive Efficient Buildings (GEBs) could reduce power system costs by up to USD 18 billion annually and lower carbon emissions by 80 million metric tons per year by 2030.
- In July 2024, the federal government introduced the Canada Green Buildings Strategy, supported by CAD 903.5 million under Budget 2024 to accelerate building decarbonization. In addition, Natural Resources Canada (NRCan) reported that the Canada Greener Homes Grant provided approximately CAD 1.77 billion to support 396,732 homeowners in completing energy efficient home upgrades. These initiatives continue to encourage the deployment of smart building technologies across residential, commercial, and public infrastructure, strengthening North America’s position as the leading regional market.
Key Regions and Countries Covered
- North America
- The US
- Canada
- Europe
- Germany
- France
- The UK
- Spain
- Italy
- Russia & CIS
- Rest of Europe
- APAC
- China
- Japan
- South Korea
- India
- ASEAN
- Rest of APAC
- Latin America
- Brazil
- Mexico
- Rest of Latin America
- Middle East & Africa
- GCC
- South Africa
- Rest of MEA
Key Players Analysis
Smart building solution providers focus on expanding integrated digital platforms, software capabilities, and connected building ecosystems to strengthen their market position. A major priority is the integration of Building Automation Systems (BAS), Internet of Things (IoT) devices, cloud platforms, and artificial intelligence to improve building performance, energy efficiency, and occupant comfort.
Companies continue to enhance interoperability so that lighting, HVAC, access control, fire safety, and energy management systems can operate through a single interface. Investment in cybersecurity has also become essential as connected buildings generate larger volumes of operational data. At the same time, vendors are developing scalable and modular solutions that can be deployed across both new construction and retrofit projects, enabling customers to modernize buildings with lower implementation complexity.
Leading market participants are also strengthening their competitive position through strategic partnerships, software development, and service expansion. Collaboration with construction firms, real estate developers, utilities, and technology providers helps companies deliver complete smart building solutions rather than standalone products. Cloud based analytics, predictive maintenance, and remote building management services are becoming key areas of differentiation as building owners seek lower operating costs and improved asset performance.
Market Key Players
- ABB Ltd.
- BOSCH
- Cisco Systems Inc.
- Emerson Electric Co.
- Hitachi, Ltd.
- Honeywell International Inc.
- Intel Corporation
- Johnson Controls
- KMC Controls
- LG Electronics Inc.
- Legrand
- Schneider Electric Corporation
- Siemens AG
Key Development
- February 2026, Johnson Controls launched its next generation of Smart Ready YORK Chillers with factory installed connectivity, delivering real time performance insights from day one. According to the company’s official press release, customers using connected chillers experienced 32% fewer unplanned service calls, with the solution delivering 10 times the number of performance indicators compared to standard Building Automation System (BAS) connections.
- February 2026, Siemens Smart Infrastructure reported approximately 79,400 employees worldwide as of 30 September 2025, and noted that customers are achieving up to 30% in energy savings through Building X’s data driven energy efficiency optimizations.
- April 2026, Honeywell International Inc. reported its First Quarter 2026 results, disclosing total sales of USD 9.1 billion with reported and organic sales growth of 2%. Orders grew 7% organically, pushing total backlog to approximately USD 38 billion, led by strong demand in Building Automation and Industrial Automation segments.
Report Scope
| Report Features | Description |
|---|---|
| Market Value (2025) | USD 142.7 Bn |
| Forecast Revenue (2035) | USD 372.8 Bn |
| CAGR (2026 2035) | 9.1% |
| Base Year for Estimation | 2025 |
| Historic Period | 2020-2024 |
| Forecast Period | 2026-2035 |
| Report Coverage | Revenue Forecast, Market Dynamics, Competitive Landscape, Recent Developments |
| Segments Covered | By Building Type (Residential, Commercial, Industrial), By Solution (Building Infrastructure Management, Safety & Security Management, Energy Management, Integrated Workplace Management System, Others), By Service (Consulting, Implementation, Support & Maintenance) |
| Regional Analysis | North America The US & Canada; Europe Germany, France, The UK, Spain, Italy, Russia & CIS, Rest of Europe; APAC China, Japan, South Korea, India, ASEAN & Rest of APAC; Latin America Brazil, Mexico & Rest of Latin America; Middle East & Africa GCC, South Africa, & Rest of MEA |
| Competitive Landscape | ABB Ltd., BOSCH, Cisco Systems Inc., Emerson Electric Co., Hitachi, Ltd., Honeywell International Inc., Intel Corporation, Johnson Controls, KMC Controls, LG Electronics Inc., Legrand, Schneider Electric Corporation, and Siemens AG. |
| Customization Scope | Customization for segments, region/country level will be provided. Moreover, additional customization can be done based on the requirements. |
| Purchase Options | We have three licenses to opt for: Single User License, Multi User License (Up to 5 Users), Corporate Use License (Unlimited Users and Printable PDF) |





































