


Report overview
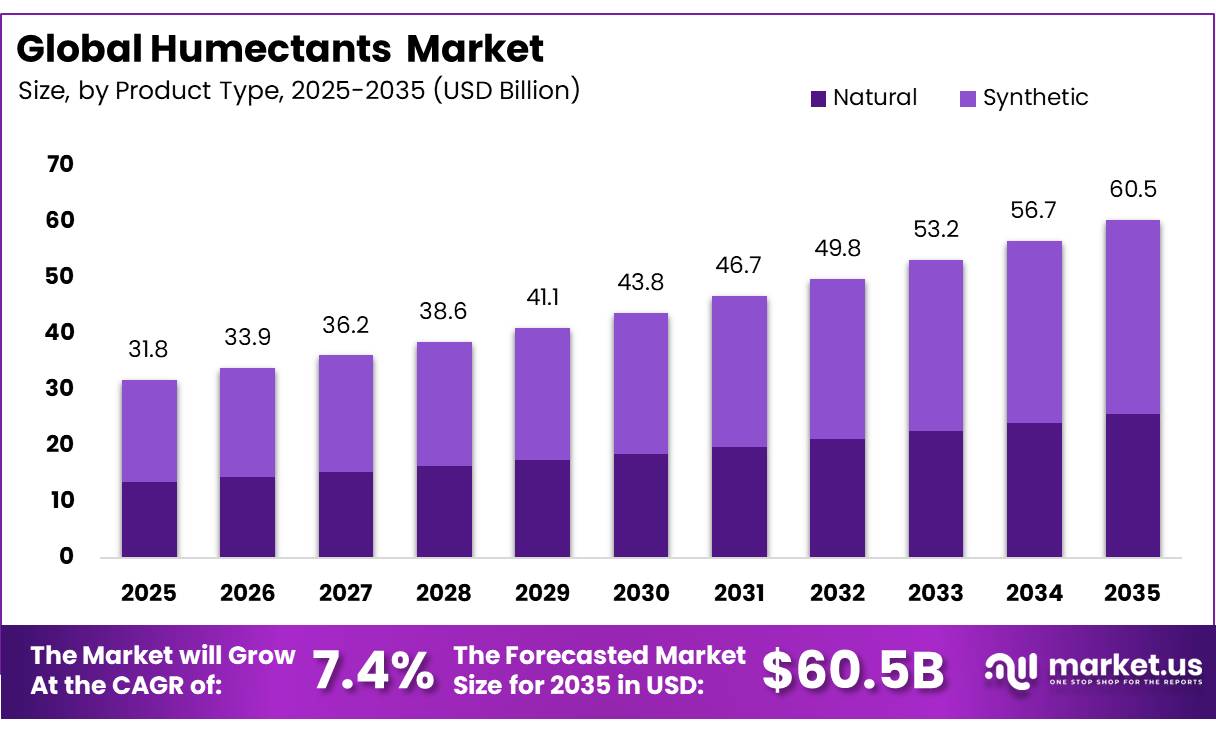
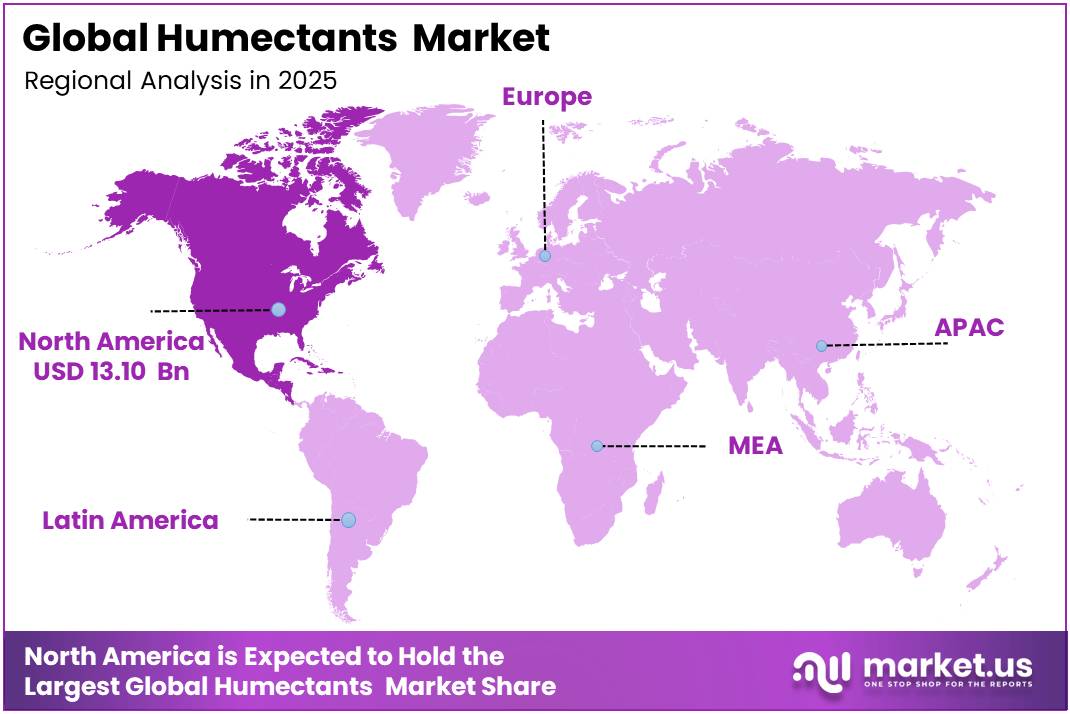
In 2025, the Global Humectants Market was valued at USD 31.8 billion, and between 2026 and 2035, this market is estimated to register a CAGR of 7.4%, reaching about USD 60.5 billion by 2035. North America held a dominant market position, capturing more than a 41.20% share, holding USD 13.10 billion in revenue.
The Humectants Market is positioned within the specialty chemicals industry, as these ingredients are mainly used to retain moisture, improve texture, control water activity, and extend product stability. Key materials include glycerol, glycols, sugar alcohols, alpha hydroxy acids, and polysaccharide-based ingredients.
- In food use, glycerol is listed as E 422 in the United Kingdom food additive system, while the United States Food and Drug Administration lists glycerin under 21 CFR 182.1320 as Generally Recognized as Safe (GRAS) when used under good manufacturing practice.
Key Takeaways
- The global humectants market was valued at USD 31.8 billion in 2025.
- The global market is projected to grow at a CAGR of 7.4% and is estimated to reach USD 60.5 billion by 2035.
- On the basis of source, the synthetic segment dominated the humectants market, constituting 57.50% of the total market share.
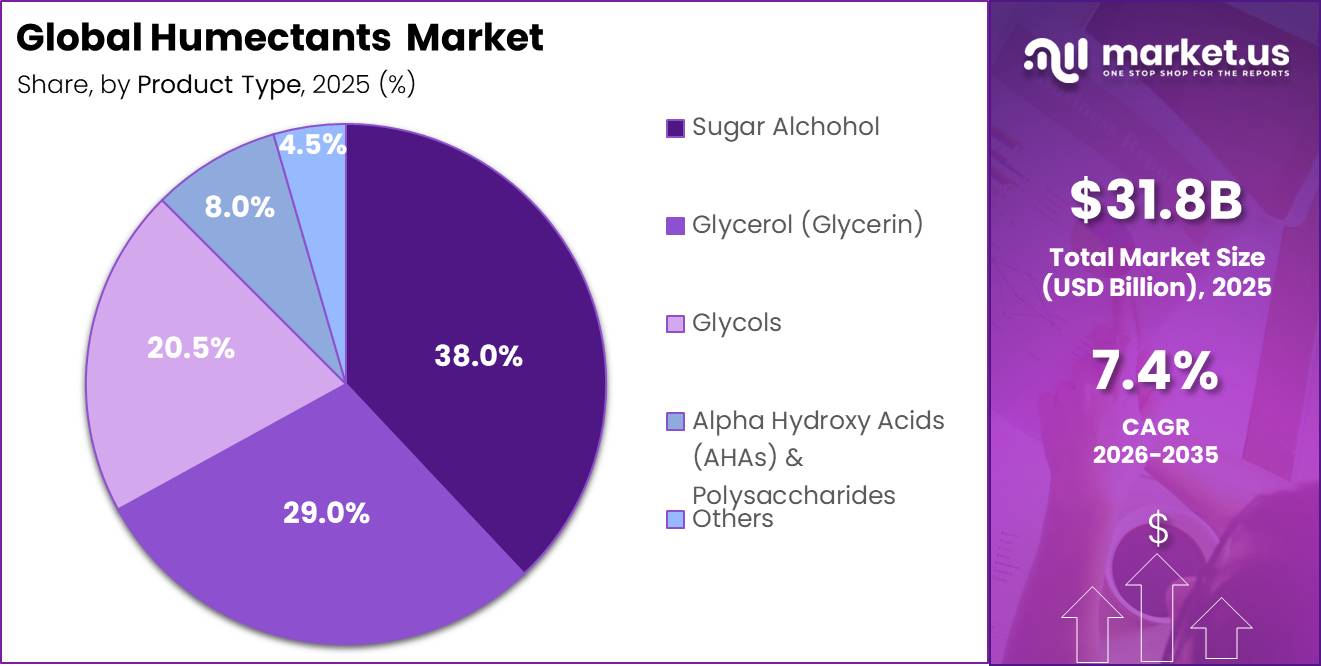
- Based on product type, sugar alcohol dominated the humectants market, with a substantial market share of around 38.00%
- Based on application, food & beverages bakery & confectionery dominated the humectants market, comprising 34.00% of the total market.
- Based on form, liquid dominated the humectants market, accounting for around 68.50% of the revenue.
- On the basis of distribution channel, direct sales / B2B (manufacturers) held a major share in the humectants market, accounting for 44.50% of the market share.
- In 2025, North America was the most dominant region in the humectants market, accounting for 41.20% of the total global consumption.
The industrial scenario remains supported by large chemical manufacturing bases in Europe and North America. The European Chemical Industry Council reported that Europe’s chemical industry recorded €635 billion in turnover and employed 1.2 million people, while Europe held 13% of global chemical sales and China held 46%. In the United States, the American Chemistry Council reported that the business of chemistry accounts for nearly 13% of global chemical production by value, with chemical exports of US$161 billion, equal to 9% of all exported U.S. goods.
Growth is being driven by food, cosmetics, personal care, pharmaceuticals, and animal nutrition applications. Cosmetics Europe reported European cosmetics and personal care retail sales of €110 billion in 2025, including Germany at €18.0 billion, the United Kingdom at €14.7 billion, and France at €14.5 billion.
- The Personal Care Products Council reported that the U.S. personal care industry generated US$495.6 billion in total economic output and supported more than 6 million jobs in 2024, creating strong demand for moisturizers, skin care, hair care, and functional ingredients.
Government initiatives are also shaping market opportunities. The European Union’s Registration, Evaluation, Authorisation and Restriction of Chemicals (REACH) framework requires registration when a chemical exceeds 1 tonne per year per company, while Classification, Labelling and Packaging (CLP) Regulation No 1272/2008 supports hazard communication. The European Union food additive framework is governed by Regulation (EC) No 1333/2008, and the United Kingdom issued 4 voluntary principles for glycerol use in slush ice drinks. Verification check: the data is verified from government, chemical safety authority, and industry association sources only; no market research firm or market research website data was used.
By Source Analysis
Synthetic dominates with 57.50% due to stronger consistency and wide industrial use.
In 2025, Synthetic held a dominant market position, capturing more than a 57.50% share of the humectants market. In January 2025, synthetic humectants remained preferred because they offer stable quality, easier formulation control, and reliable performance across food, cosmetics, personal care, and pharmaceutical applications. Manufacturers used synthetic grades where moisture control, shelf stability, and repeatable product texture were important. Their wider availability and predictable performance made them a practical choice for large-scale production.
Natural humectants continued to grow as brands focused on clean-label, plant-based, and naturally derived ingredients. This segment gained attention in skin care, hair care, and food applications where consumers preferred softer ingredient claims and simpler product positioning.
By Product Type Analysis
Sugar Alcohol dominates with 38.00% due to strong use in food and personal care products.
In 2025, Sugar Alcohol held a dominant market position, capturing more than a 38.00% share of the humectants market. In January 2025, this segment led because sugar alcohols are widely used for moisture retention, sweetness balance, texture improvement, and product stability. Their role remained strong in bakery, confectionery, functional foods, oral care, and personal care formulations. Producers preferred sugar alcohols because they support product quality while fitting well into different formulation needs.
Glycerol (Glycerin) remained a growing segment with strong use in food, cosmetics, pharmaceuticals, and personal care products. It gained demand because it helps retain moisture, improves smoothness, and supports stable product texture across daily-use formulations.
By Application Analysis
Food & Beverages Bakery & Confectionery dominates with 34.00% due to broad formulation demand.
In 2025, Food & Beverages Bakery & Confectionery held a dominant market position, capturing more than a 34.00% share of the humectants market. In January 2025, this segment led because humectants helped maintain softness, moisture, taste, and shelf stability in bakery and confectionery products. Their use remained important in products where texture and freshness directly influenced consumer acceptance. Food manufacturers relied on humectants to support consistent quality across packaged and processed food formats.
Cosmetics & Personal Care Products continued to grow as moisturizers, serums, lotions, shampoos, conditioners, and masks used humectants for hydration and smooth feel. This segment gained strength as daily personal care routines became more ingredient-focused.
By Form Analysis
Liquid dominates with 68.50% due to easy blending and high formulation flexibility.
In 2025, Liquid held a dominant market position, capturing more than a 68.50% share of the humectants market. In January 2025, liquid humectants led because they are easier to mix, process, and dose in large-scale production. Their use remained strong across food, cosmetics, pharmaceuticals, and personal care products where uniform blending and smooth texture are important. Liquid forms also supported faster formulation handling, making them suitable for manufacturers working with high-volume production lines.
Powder / Granules continued to grow as producers looked for easier storage, transport, and dry-mix compatibility. This format gained use in powdered foods, nutraceuticals, and dry personal care formulations where controlled dosing and longer storage stability were needed.
By Distribution Channel
Direct Sales / B2B (Manufacturers) dominates with 44.50% due to bulk supply needs.
In 2025, Direct Sales / B2B (Manufacturers) held a dominant market position, capturing more than a 44.50% share of the humectants market. In January 2025, this channel led because large food, cosmetics, pharmaceutical, and personal care manufacturers preferred direct sourcing for bulk volumes, stable pricing, quality assurance, and long-term supply security. Direct sales also helped buyers maintain better control over specifications, delivery schedules, and supplier relationships.
Distributors & Wholesalers continued to grow as small and mid-sized manufacturers depended on flexible order sizes, wider product access, and faster regional availability. This channel supported buyers that required multiple humectant grades without entering large direct procurement contracts.
Key Market Segments
By Source
- Natural
- Synthetic
By Product Type
- Sugar Alchohol
- Glycerol (Glycerin)
- Glycols
- Alpha Hydroxy Acids (AHAs) & Polysaccharides
- Others
By Application
- Food & Beverages Bakery & Confectionery
- Cosmetics & Personal Care Products
- Pharmaceuticals
- Animal Feeds
- Others
By Form
- Liquid
- Powder / Granules
- Gel
- Others
By Distribution Channel
- Direct Sales / B2B (Manufacturers)
- Distributors & Wholesalers
- Online / E-Commerce (B2B Platforms)
- Retail (Personal Care & Food Retail)
Drivers
Processed food and sugar-reduction systems raising sorbitol and polyol use
Food processors continue to use humectants to maintain softness, extend moisture retention, and stabilize reduced-sugar formulations, which keeps the category structurally tied to convenience foods, confectionery, bakery, and functional products. The FDA framework remains permissive for sorbitol use, including up to 99% in sugar-free candy and up to 12% in other foods under good manufacturing practice, with mandatory laxative labeling when expected intake reaches 50 grams per day. That regulatory clarity supports formulation scale-up because manufacturers can design moisture-management systems around well-understood use ceilings rather than uncertain approval pathways.
The economics strengthened further in 2026 because global sugar prices fell sharply year on year: the FAO Sugar Price Index averaged 89.7 points in June 2026, down 13.3% from a year earlier, while vegetable oils rose 23.3% year on year. Lower sugar prices do not eliminate polyol demand, but they alter formulation math by making sugar reduction more about texture, shelf stability, diabetic positioning, and calorie claims than about pure sweetener arbitrage; in that environment, sorbitol and glycerol hold value as process aids and moisture managers rather than simple sugar substitutes.
Drivers Impact Analysis
| Driver | (~) % Impact on CAGR Forecast | Geographic Relevance | Impact Timeline |
|---|---|---|---|
| Personal care reformulation toward multifunctional bio-based humectants | +1.7% | EU core, North America premium, APAC volume | Short term (≤ 2 years) |
| Processed food and sugar-reduction systems raising sorbitol and polyol use | +1.3% | North America core, EU, APAC urban corridors, LATAM spill-over | Medium term (2-4 years) |
| Pharma and OTC excipient demand expansion in oral liquids and topical formats | +1.1% | India, North America, EU, Southeast Asia | Medium term (2-4 years) |
| Biodiesel-linked glycerin availability improving cost economics and penetration | +0.9% | Southeast Asia supply base, China, EU, North America | Short term (≤ 2 years) |
| Tightening cosmetics compliance shifting formulation share to safer moisture systems | +0.8% | EU core, UK alignment, export-oriented APAC manufacturers | Short term (≤ 2 years) |
| Sustainability and low-carbon sourcing premiums for plant-based ingredients | +0.7% | EU premium, North America premium, Japan, South Korea | Long term (≥ 4 years) |
Restraints
Volatile vegetable oil and sugar feedstock costs
This restraint stems from the dual exposure of humectants to vegetable‑oil and sugar complexes, where glycerin tracks biodiesel and palm/soy oil, while sorbitol and other polyols depend on carbohydrate inputs, and 2026 data show the FAO Vegetable Oil Price Index at 192.0 points in June, up 23.3% year on year, alongside a Sugar Price Index around 89.7 points, down 13.3% versus the prior year but still historically elevated against pre‑pandemic baselines.
For buyers running 3–5% humectant loading in cosmetics and 5–15% in certain foods, these swings translate into mid‑single‑digit percentage increases in total formulation cost, which can delay reformulation projects, shift procurement to lower‑grade material, or drive substitution toward cheaper texture agents; in capital terms, persistent input instability forces producers to delay debottlenecking or expansion by 12–24 months to avoid overcommitting to uncertain feedstock economics, thereby pulling achievable CAGR down by roughly 1.6 percentage points relative to a stable‑cost scenario.
Restraint Impact Analysis
| Restraint | (~) % Impact on CAGR Forecast | Geographic Relevance | Impact Timeline |
|---|---|---|---|
| Volatile vegetable oil and sugar feedstock costs | -1.6% | APAC corridors, EU, North America core | Short term (≤ 2 years) |
| High purification and compliance cost for food/pharma grades | -1.3% | EU, North America, India, Japan | Medium term (2-4 years) |
| Regulatory uncertainty on specific humectants and additives | -1.1% | EU core, UK, export-oriented APAC | Short term (≤ 2 years) |
| Over-reliance on Southeast Asian glycerin supply | -1.0% | EU, China, North America | Medium term (2-4 years) |
| Competitive pressure from alternative moisture systems | -0.9% | North America, EU, APAC premium segments | Long term (≥ 4 years) |
| ESG and microplastics scrutiny raising reformulation risk | -0.8% | EU, UK, North America, Japan | Long term (≥ 4 years) |
Opportunity
Microplastic‑free rheology and moisture platforms
Humectants can anchor microplastic‑free platforms by combining their water‑binding capacity with biodegradable polysaccharides or other natural macromolecules, enabling new “moisture plus rheology” systems positioned explicitly as compliant with microplastic rules and ESG narratives; if such architectures achieve even 20–30% penetration in affected personal‑care SKUs across EU and UK by 2030, they could unlock incremental TAM of several billion dollars by increasing humectant loadings and value‑add margins.
Unit economics can be compelling: microplastic‑free moisture systems can command 10–15% price premiums over legacy formulations, while production cost increases might be contained to 5–8% if humectant‑centric recipes leverage established glycerin and polyol supply chains, leaving 300–500 basis points of margin expansion for early movers. A targeted investment program over the next two years in IP generation, patent‑backed formulations, and regulatory validation could therefore add roughly 2.0 points of CAGR upside relative to a scenario where humectants remain generic moisturizers and do not capture the functional void left by microplastic restrictions.
Opportunity Impact Analysis
| Opportunity | (~) % Potential CAGR Upside | Geographic Relevance | Execution Window |
|---|---|---|---|
| Microplastic-free rheology and moisture platforms | +2.0% | EU, UK, North America, Japan, South Korea | Short term (≤ 2 years) |
| Encapsulated actives and delivery systems using humectant matrices | +1.7% | North America core, EU, APAC premium hubs | Medium term (2-4 years) |
| Integrated humectant-as-a-service formulation and data platforms | +1.5% | North America, EU, India, China | Medium term (2-4 years) |
| Bio-fermented and waste-to-value humectant production pathways | +1.4% | EU, Japan, North America, APAC emerging | Long term (≥ 4 years) |
| Expansion into industrial and sustainable manufacturing moisture control | +1.2% | EU, North America, China, GCC | Medium term (2-4 years) |
| Strategic M&A roll-ups in fragmented mid-tier natural humectants | +1.1% | EU, North America, India, ASEAN | Short term (≤ 2 years) |
Challenge
Persistent feedstock and energy volatility
Persistent feedstock and energy volatility is an ongoing challenge rather than a restraint because humectant plants continue to operate and sell product, but margin profiles and planning accuracy are structurally impaired; vegetable‑oil benchmarks, especially palm and soy, and regional electricity and gas tariffs exhibit high intra‑year variance, with 2026 commentary indicating vegetable oil indices up more than 20% year on year and energy costs in some industrial hubs rising 10–15% against 2024 baselines, which can push glycerin and sorbitol variable production costs up by 8–12% in a single cycle.
The friction is quantified through increased hedge costs, wider bid‑offer spreads, and higher safety stock requirements: a typical mid‑size humectant producer running 200–300 kilotons per year may hold an extra 2–3 weeks of feedstock inventory to protect against price spikes, tying up several million dollars of working capital and lifting inventory carrying costs by 50–100 basis points of revenue, while procurement must manage 5–10% month‑to‑month price swings on key inputs.
Challenges Impact Analysis
| Challenge | (~) % CAGR Friction Drag | Geographic Relevance | Mitigation Horizon |
|---|---|---|---|
| Persistent feedstock and energy volatility | -1.5% | APAC logistics corridors, EU regulatory hubs, North America core | Medium term (2-4 years) |
| Process-intensive quality and traceability norms | -1.3% | EU, North America, Japan, India | Long term (≥ 4 years) |
| Supply-chain visibility and logistics complexity | -1.1% | APAC export routes, EU ports, North America inland networks | Medium term (2-4 years) |
| Skilled formulation and regulatory talent shortages | -1.0% | EU innovation clusters, North America HQs, India R&D hubs | Long term (≥ 4 years) |
| Data fragmentation across applications and regions | -0.9% | Global multi-segment suppliers, OEMs | Medium term (2-4 years) |
| Transition risk from legacy to sustainable portfolios | -0.8% | EU green markets, North America ESG adopters, Japan | Long term (≥ 4 years) |
Geopolitical Impact Analysis
Trade policy, feedstock security, and regional compliance are reshaping the Humectants Market.
Current geopolitical shifts are influencing the humectants market through tighter trade controls, changing feedstock routes, and higher compliance pressure across food, cosmetics, pharmaceutical, and personal care supply chains. Since synthetic humectants held 57.50% share in 2025, the market remains exposed to petrochemical feedstocks used in glycols and other functional ingredients. The International Energy Agency noted that petrochemicals are expected to account for over one-third of oil demand growth to 2030, showing why energy-route instability can affect chemical ingredient planning.
Trade disputes are also affecting sugar alcohol supply, which led the product type segment with 38.00% share in 2025. In January 2025, the European Commission imposed anti-dumping duties of 34.4% to 233.3% on erythritol imports from China. This creates pricing pressure for European buyers and may encourage sourcing from alternative suppliers or local production.
- Glycerol, with 29.00% share in 2025, is also linked to biodiesel trade flows because the U.S. Department of Energy states that biodiesel production forms 100 pounds of biodiesel and 10 pounds of glycerin. In February 2025, the European Commission imposed anti-dumping duties on Chinese biodiesel imports, protecting nearly 6,000 European Union jobs across more than 60 producers in 18 Member States. This can influence crude glycerin availability and refining economics.
Logistics risks remain important for liquid humectants, which accounted for 68.50% share in 2025. UNCTAD reported that Suez Canal transits fell by 42% from their peak during Red Sea disruptions, while container ship transits dropped by 67%. Such route instability can raise freight costs and extend delivery timelines for bulk liquid ingredients. The data is verified from official and industry sources, not from any market research firm or market research website.
Regional Analysis
In 2025, North America held a dominant market position in the Gas Detection Market, capturing more than a 41.20% share, valued at USD 13.10 Bn. The region remained ahead because gas monitoring is widely required across oil and gas, chemicals, mining, utilities, manufacturing, and confined-space operations. In the United States, OSHA’s permit-required confined space rule directs employers to test first for oxygen, then combustible gases and vapors, and then toxic gases and vapors, supporting steady demand for fixed and portable gas detectors.
BLS data also showed 92 fatal occupational injuries in private mining, quarrying, and oil and gas extraction industries in 2024, keeping worker-safety investment high. EPA’s methane monitoring focus in oil and gas facilities further supports adoption of advanced gas detection systems. Asia Pacific is growing as industrial expansion, urban infrastructure, and energy projects increase the need for workplace safety monitoring and emission-control devices.
Key Regions and Countries Covered
- North America
- The US
- Canada
- Europe
- Germany
- France
- The UK
- Spain
- Italy
- Russia & CIS
- Rest of Europe
- APAC
- China
- Japan
- South Korea
- India
- ASEAN
- Rest of APAC
- Latin America
- Brazil
- Mexico
- Rest of Latin America
- Middle East & Africa
- GCC
- South Africa
- Rest of MEA
Key Players Analysis
The Humectants Market shows a moderately fragmented competitive structure, as several global ingredient suppliers and regional producers compete across food, personal care, cosmetics, pharmaceuticals, and animal feed applications. The market is not monopolistic because buyers can source from many producers, but large suppliers hold an advantage through quality control, regulatory compliance, formulation support, and stable bulk supply.
Synthetic humectant suppliers remain strong in large industrial applications, while naturally derived ingredient producers are gaining attention from brands focused on plant-based and sustainable formulations. In 2025, companies with wider distribution networks, technical service teams, and multi-application product portfolios held a stronger position. Future competition is expected to move toward bio-based ingredients, safer formulations, and customized blends for food and personal care manufacturers.
Market Key Players
- BASF SE
- Archer Daniels Midland Company (ADM)
- Cargill, Incorporated
- Dow Inc.
- Evonik Industries AG
- Roquette Frères
- Ingredion Incorporated
- DuPont / Tate & Lyle Bio Products
- Corbion N.V.
- Ashland Inc.
- Croda International Plc
- Lonza Group Ltd.
- Eastman Chemical Company
- Brenntag SE
- Jungbunzlauer Suisse AG
Key Development
- In April 2026, Roquette Frères announced four new additions to its Beauté by Roquette cosmetics portfolio, including Beauté by Roquette DS 700 and three marine-sourced alginates, supporting demand for plant-based and sensorial personal care formulations.
- In April 2026, BASF SE introduced NeoHelix Regenerate, a new cosmetic active ingredient linked to skin renewal and hyaluronic acid support, strengthening its role in advanced moisturizing and skin care ingredient innovation.
- In April 2026, Ashland Inc. announced new personal care technology platforms and ingredients at in-cosmetics Global 2026, including nature-derived and starch-based solutions designed to improve moisture, texture, and formulation performance.
Report Scope
| Report Features | Description |
|---|---|
| Market Value (2025) | USD 31.8 Bn |
| Forecast Revenue (2035) | USD 60.5 Bn |
| CAGR (2026-2035) | 7.4% |
| Base Year for Estimation | 2025 |
| Historic Period | 2020-2024 |
| Forecast Period | 2026-2035 |
| Report Coverage | Revenue Forecast, Market Dynamics, Competitive Landscape, Recent Developments |
| Segments Covered | By Source (Natural, Synthetic), By Product Type (Sugar Alchohol, Glycerol (Glycerin), Glycols, Alpha Hydroxy Acids (AHAs) & Polysaccharides, Others), By Application (Food & Beverages Bakery & Confectionery, Cosmetics & Personal Care Products, Pharmaceuticals, Animal Feeds, Others), By Form (Liquid, Powder / Granules, Gel, Others), By Distribution Channel (Direct Sales / B2B (Manufacturers), Distributors & Wholesalers, Online / E-Commerce (B2B Platforms), Retail (Personal Care & Food Retail) |
| Regional Analysis | North America – The US & Canada; Europe – Germany, France, The UK, Spain, Italy, Russia & CIS, Rest of Europe; APAC- China, Japan, South Korea, India, ASEAN & Rest of APAC; Latin America- Brazil, Mexico & Rest of Latin America; Middle East & Africa- GCC, South Africa, & Rest of MEA |
| Competitive Landscape | BASF SE, Archer Daniels Midland Company (ADM), Cargill, Incorporated, Dow Inc., Evonik Industries AG, Roquette Frères, Ingredion Incorporated, DuPont / Tate & Lyle Bio Products, Corbion N.V., Ashland Inc., Croda International Plc, Lonza Group Ltd., Eastman Chemical Company, Brenntag SE, Jungbunzlauer Suisse AG |
| Customization Scope | Customization for segments, region/country-level will be provided. Moreover, additional customization can be done based on the requirements. |
| Purchase Options | We have three licenses to opt for: Single User License, Multi-User License (Up to 5 Users), Corporate Use License (Unlimited Users and Printable PDF) |





































