
Quick Navigation
Report Overview
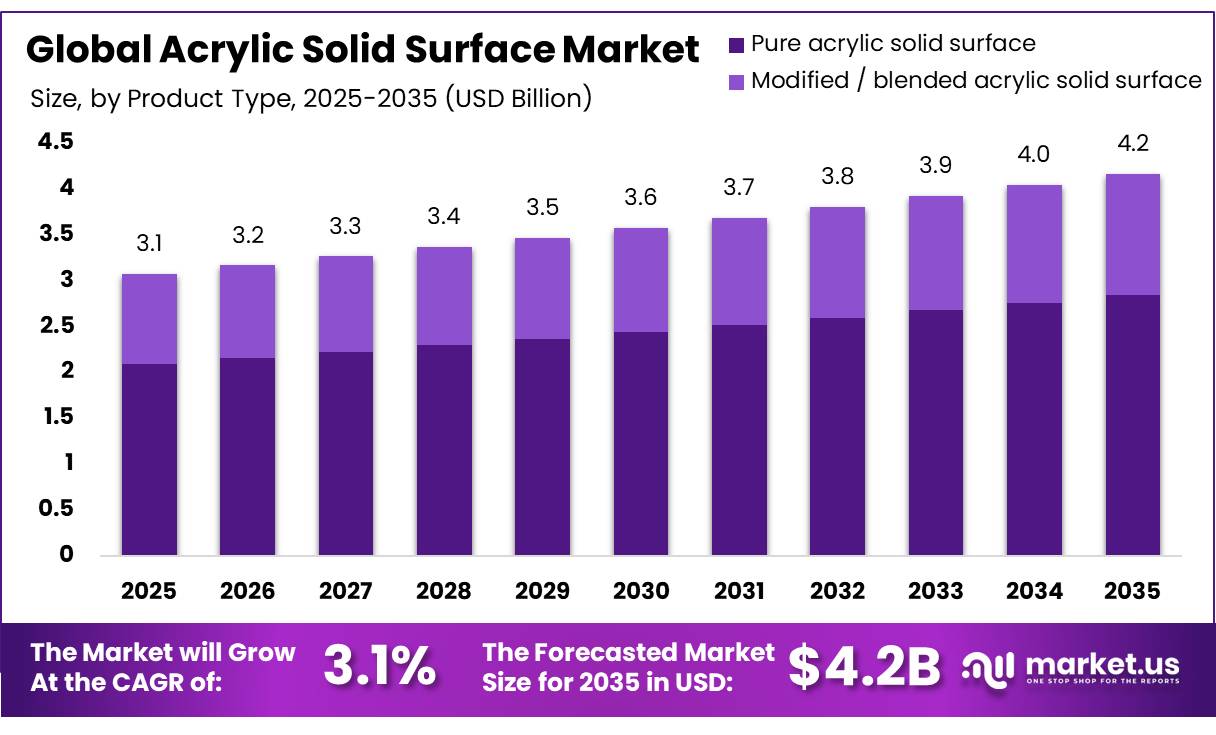
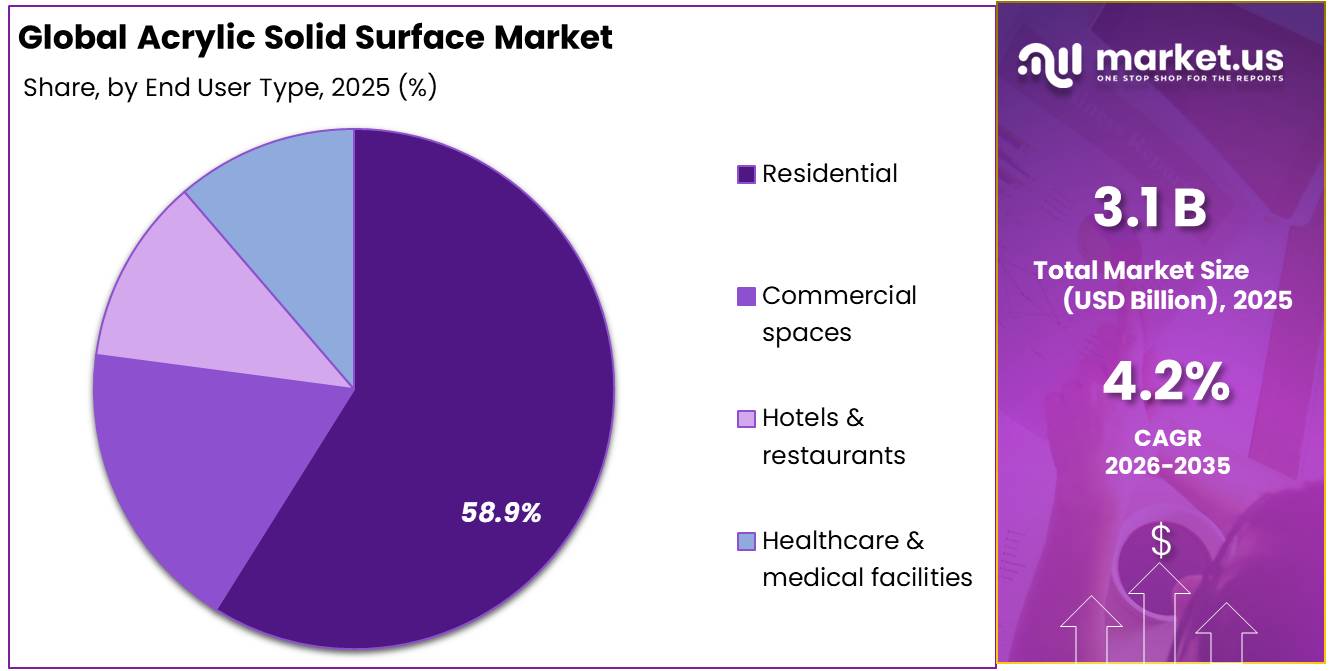
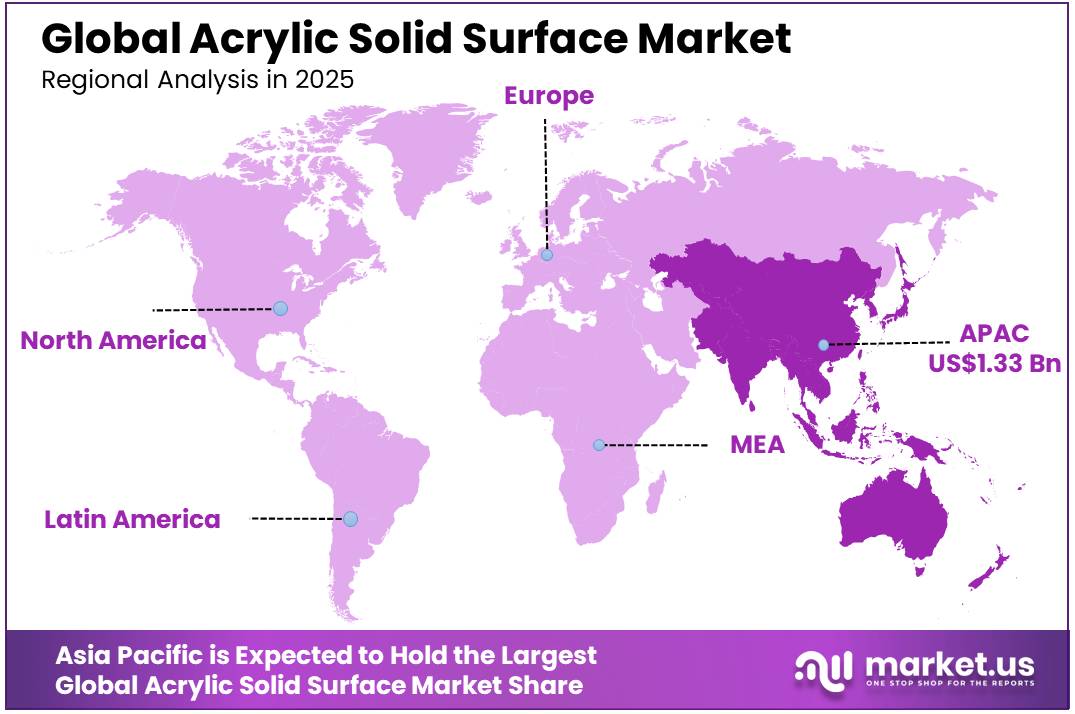
In 2025, the Global Acrylic Solid Surface Market was valued at USD 3.1 billion, and between 2026 and 2035, this market is estimated to register a CAGR of 3.1%, reaching about USD 4.2 billion by 2035. Asia Pacific held a dominant market position, capturing more than a 43.2% share, holding USD 1.33 billion in revenue.
Acrylic solid surface is an engineered, non-porous material used for countertops, reception desks, wall panels, washrooms, laboratories and healthcare interiors. A representative formulation contains approximately 55–66% aluminium trihydroxide filler and 34–45% polymethyl methacrylate, while residual methyl methacrylate remains below 1%. This structure provides uniform colour, supports inconspicuous joints and thermoforming, and allows defects to be sanded and repaired instead of requiring full replacement.
- WHO and UNICEF reported in September 2025 that 1.7 billion people were served by healthcare facilities lacking basic hygiene services in 2023, while more than 80% of surveyed countries had implemented at least one national improvement action.
Key Takeaways
- The global acrylic solid surface market was valued at USD 3.1 billion in 2025.
- The market is projected to grow at a CAGR of 3.1% and is estimated to reach USD 4.2 billion by 2035.
- Pure acrylic is the most common type in the market, making up 68.2% of the total.
- Countertops used in kitchens and bathrooms are the biggest use of this material, taking up 55.2% of the market.
- The Residential segment dominates the market as the main buyer, owning 58.9% of the total market share.
- The Asia Pacific region is the top area for this product, controlling 43.2% of the overall market.
This focus supports procurement of durable, cleanable and joint-minimised interior systems, although products must satisfy local chemical-resistance, fire-safety and infection-control requirements.The industrial landscape for acrylic solid surfaces is supported by steady growth in global construction and building renovation activities. The global construction sector remains a significant consumer of interior surfacing products, including acrylic solid surfaces, particularly in commercial and institutional projects where durability and long service life are important requirements.
- In April 2026, United States construction spending reached a seasonally adjusted annual rate of USD 2.172 trillion. Private construction accounted for USD 1.640 trillion, including USD 909.9 billion in residential work and USD 729.8 billion in non-residential activity, while public construction reached USD 532.7 billion. Educational construction represented USD 113.7 billion.
The market is expected to emerge from increasing investments in commercial infrastructure, healthcare modernization, hospitality renovation projects, and premium residential construction. Advances in digital fabrication, thermoforming technologies, and recycled-content formulations are enabling broader design possibilities while supporting environmental objectives. As governments and private developers continue to prioritize durable, hygienic, and aesthetically versatile building materials, acrylic solid surfaces are expected to maintain a strong position within the global architectural and interior finishing materials industry.
Acrylic Solid Surface Market Segmentation
Product Analysis
Pure Acrylic Solid Surface leads with a 68.2% share due to superior strength, durability, and design flexibility.
In 2025, Pure Acrylic Solid Surface held a dominant position in the Acrylic Solid Surface Market, capturing more than 68.2% of total revenue. The segment’s leadership was supported by its exceptional material properties, which provide long-term durability and consistent performance. Pure acrylic solid surfaces typically exhibit a density of approximately 1.7 g/cm³, flexural strength of around 10,000 psi, and compressive strength of nearly 16,000 psi, enabling them to withstand daily wear and impact. The material also demonstrates excellent moisture resistance, with water absorption as low as 0.05% after 24 hours, helping maintain structural integrity and surface quality over time.
Modified/Blended Acrylic Solid Surface is fastest growing segment. The segment is gaining momentum because it provides a more affordable alternative to pure acrylic surfaces while retaining key benefits such as moisture resistance, low maintenance requirements, and attractive design options. The availability of a wide range of colors, patterns, and stone-inspired finishes has increased adoption across apartments, offices, educational facilities, retail stores, and hospitality establishments.
Application Analysis
Kitchen and bathroom countertops lead with a 55.2% share as seamless surfaces remain widely preferred.
In 2025, Kitchen and Bathroom Countertops held a dominant market position, capturing more than a 55.2% share. The segment remained ahead because acrylic solid surfaces provide a non-porous finish, smooth joints and strong shaping flexibility. Countertops can be fabricated with integrated sinks, curved edges and backsplashes, reducing visible gaps where moisture and dirt may collect. In January 2026, a Houzz survey of 1,780 renovating homeowners found that 52% changed their kitchen layout, while 34% of those planning accessibility improvements selected rounded countertops.
Wall Cladding and Vertical Surfaces is the fastest-growing segment in 2025. The segment is gaining momentum because acrylic sheets can create smooth wall panels, partitions and decorative vertical surfaces with limited visible joints. The material can also be shaped, engraved and illuminated, allowing designers to produce customized interiors while maintaining easy cleaning and repairability. Continued growth in built space, together with demand for durable and low-maintenance interior finishes, is creating wider opportunities for acrylic wall cladding and vertical-surface systems.
End User Analysis
Residential leads with a 58.9% share as durable and easy-care surfaces remain widely preferred.
In 2025, Residential held a dominant market position, capturing more than a 58.9% share. The segment maintained its lead because acrylic solid surfaces offer a non-porous finish, nearly invisible joints and flexible fabrication. The material can be cut, repaired and shaped into coordinated interior surfaces, making it useful for both new construction and renovation work. In April 2026, U.S. private residential construction spending reached a seasonally adjusted annual rate of US$909.9 billion. Housing starts also reached an annual rate of 1.465 million units during the month.
Commercial Spaces is the fastest-growing segment in 2025. Demand is increasing because offices, hotels, retail outlets, restaurants, healthcare facilities and public buildings require surfaces that can withstand frequent use while remaining easy to clean and maintain. Acrylic solid surfaces offer seamless fabrication, stain resistance and repairability, helping commercial property owners extend the service life of interior installations. The ability to renew damaged areas instead of replacing complete installations also improves the material’s appeal in high-traffic environments.
Key Market Segments
By Product Type
- Pure acrylic solid surface
- Modified / blended acrylic solid surface
By Application
- Kitchen and bathroom countertops
- Wall cladding and vertical surfaces
- Furniture and fixtures
- Healthcare and laboratory surfaces
- Others
By End User
- Residential
- Commercial spaces
- Hotels & restaurants
- Healthcare & medical facilities
Driver Analysis
A pivotal regulatory event that reshaped global competitive dynamics in this market was the Indian Ministry of Finance’s Notification issued on March 25, 2025, imposing an anti-dumping duty of USD 0.18/kg on acrylic solid surfaces imported from China PR for a period of five years. The duty covers 100% acrylic solid surfaces, Corian sheets, Hi-Macs acrylic sheets, PMMA sheets, and Staron solid surfaces, classified under tariff items. In the United States, the effective tariff rate on construction imports surged to 27.7% as of mid-2025, up from under 1% prior to 2025, with kitchen cabinets and vanities key acrylic surface application categories attracting 25% tariffs, with rates set to escalate to 50% by January 2026.
For US importers of acrylic sheet from China, landed costs have structurally risen: a documented comparative analysis showed Chinese-origin acrylic sheets costing USD 62.81/sheet landed versus USD 44/sheet from domestic distributors a 43% cost disadvantage that forces specification redesign and near-shoring of supply.
Drivers Impact Analysis
| Driver | (~) % Impact on CAGR Forecast | Geographic Relevance | Impact Timeline |
|---|---|---|---|
| Surge in Global Construction Activity & Government Infrastructure Capex | +1.4% | India (core), APAC corridors, Middle East spill-over, North America | Short term (≤ 2 years) |
| Rapid Expansion of Healthcare & Hospital Construction | +1.2% | North America core, EU, South & Southeast Asia corridors | Medium term (2–4 years) |
| Trade Remedies & Anti-Dumping Duties Reinforcing Domestic Manufacturing | +0.9% | India core, EU regulated markets, North America | Short term (≤ 2 years) |
| EU Green Building Renovation Wave & EPBD Compliance Mandates | +0.8% | EU core, UK spill-over, APAC green-rated corridors | Medium term (2–4 years) |
| Hospitality Sector Boom & Record Hotel Construction Pipeline | +0.7% | APAC corridors (ex-China), Middle East, North America | Medium term (2–4 years) |
| Design Aesthetics Shift: Seamless Surfaces in Premium Interiors | +0.6% | North America, EU, GCC, High-income APAC | Long term (≥ 4 years) |
Restraint Analysis
The revised EU Construction Products Regulation entered into force on 7 January 2025 and most provisions became applicable on 8 January 2026, materially raising the documentation, testing, declaration, and digital traceability burden for manufacturers and exporters marketing construction products into Europe.
Restraint Impact Analysis
| Restraint | (~) % Impact on CAGR Forecast | Geographic Relevance | Impact Timeline |
|---|---|---|---|
| MMA cost volatility | -1.3% | APAC core, EU, North America | Short term (≤ 2 years) |
| Tariff-led price inflation | -0.9% | India core, North America, APAC trade lanes | Short term (≤ 2 years) |
| EU compliance burden | -0.8% | EU core, UK spill-over, export APAC | Medium term (2-4 years) |
| Nonresidential build softness | -0.7% | North America core, EU | Short term (≤ 2 years) |
| Housing program lag | -0.6% | India core, South Asia | Medium term (2-4 years) |
| Low-cost substitute pressure | -0.5% | Global, strongest in APAC and price-led EMEA | Long term (≥ 4 years) |
Opportunity Analysis
This is an untapped opportunity because acrylic solid surface is still rarely embedded as a standardized public-procurement material family across schools, transit amenities, government offices, and civic washrooms, even though public construction spending is expanding and procurement systems increasingly favor durable, maintainable, and documented products over one-off finishes; in April 2026, U.S. public construction spending reached USD 532.7 billion annualized, including USD 113.7 billion for education and USD 149.6 billion for highways, indicating a large but only partially penetrated public infrastructure base.
The strategic upside lies in converting acrylic solid surface from discretionary architect selection into approved standard detail libraries for sinks, counters, transaction tops, and wet-area panels, which can shorten bid cycles, create recurring replenishment revenue, and reduce tendering friction enough to improve win rates by an estimated 5 to 8 percentage points in repeat public accounts, particularly when tied to maintenance contracts and standardized repair kits rather than pure one-time material supply.
Opportunity Impact Analysis
| Opportunity | (~) % Potential CAGR Upside | Geographic Relevance | Execution Window |
|---|---|---|---|
| Healthcare retrofit kits | +1.4% | North America core, EU, GCC | Short term (≤ 2 years) |
| EU renovation-spec products | +1.2% | EU core, UK spill-over, export APAC | Medium term (2-4 years) |
| Affordable modular housing | +0.9% | India core, Southeast Asia, MENA | Medium term (2-4 years) |
| Circular recycled-content lines | +0.8% | EU core, North America, Japan | Medium term (2-4 years) |
| Fabricator roll-up platforms | +0.7% | North America, EU, India metros | Short term (≤ 2 years) |
| Public project standardization | +0.6% | U.S. public sector, EU civic builds, India urban | Long term (≥ 4 years) |
Challenges Analysis
Macro risk is an ongoing challenge that shapes the volatility of demand and input costs without freezing market activity; the World Bank’s January 2026 Global Economic Prospects outlines global growth slowing to roughly 2.5–2.6% in 2026, with downside risks skewed toward geopolitical tensions, energy price spikes, and trade disruptions that can raise commodity and transport costs, while energy prices are projected in some scenarios to rise by double digits as supply shortfalls persist.
For acrylic solid surface suppliers, this creates a moving target for resin, energy, and logistics costs, with potential 5–10% annual volatility in key input baskets and 2–4% swings in contractors’ capex appetite, especially for discretionary commercial interiors; margins and growth trajectories therefore become more path-dependent, with some years requiring aggressive repricing and others demanding discounting to defend volumes. Over a 2–4 year mitigation horizon, acrylic solid surface players must deepen macro risk monitoring, utilise staggered contract tenors, diversify geographically across EMDEs and advanced economies, and design product tiers that can flex between premium and value segments as macro conditions dictate.
Challenges Impact Analysis
| Challenge | (~) % CAGR Friction Drag | Geographic Relevance | Mitigation Horizon |
|---|---|---|---|
| Cross-border logistics friction | -1.0% | APAC–EU/NA trade lanes, India corridors | Medium term (2–4 years) |
| Construction workforce shortages | -0.9% | North America core, EU hubs | Long term (≥ 4 years) |
| Regulatory compliance complexity | -0.7% | EU, UK, export APAC, India | Medium term (2–4 years) |
| Project delivery volatility | -0.6% | North America, EU, GCC | Short term (≤ 2 years) |
| Macro demand and price risk | -0.5% | Global, especially EMDEs | Medium term (2–4 years) |
Geopolitical Impact Analysis
The existing Russian-Ukrainian conflict and rising tensions in the Middle East region have created a high-volatility scenario for the petrochemical industry, which plays an important role in the production of acrylic. This is because both the Methyl Methacrylate (MMA) and acrylic resins can be considered derivative products of the raw crude oil and natural gas. Due to the interruption in energy supplies from the mentioned regions, there is a sharp rise in the manufacturing cost. As of early 2026, MMA prices are at all-time highs, creating a dilemma for companies between either accepting the higher cost burden or passing it on to the consumers.
The difficulties have escalated due to the presence of wars in the Middle East, which has disrupted important transport links such as the Strait of Hormuz and the Red Sea. The current scenario has resulted in severe delays in the transportation of feedstock from key players in Saudi Arabia and UAE to Asian and European manufacturers. This situation has caused the sector to experience “inventory depletion,” as well as prolonged project lead times. Key players in the industry, such as Mitsubishi Chemical and Lotter Chemical, have also issued warnings on supply constraints or force majeure due to the increasing cost of transporting cargo across continents.
Regional Analysis
The Asia-Pacific area undoubtedly ranks first on the global stage, holding a dominant market share of 43.2%. This area’s supremacy is mostly influenced by urbanization and the scale of development in China and India, with a boom in the construction of high-rise apartment buildings and extensive business centres. Moreover, due to its position as the world’s fastest-growing market and its reputation as the largest manufacturer in the world, it is cheaper to produce and transport products here than elsewhere.
The rest of the global market is mainly driven by the more established regions of Europe and North America. On the other hand, growing areas such as Latin America and the Middle East & Africa have smaller shares of the market. Although Europe and North America are expanding at a slower pace compared to developing regions, they are still key and advanced areas that focus a lot on high-end technical improvements, eco-friendly building projects, and top-quality medical uses.
Key Regions and Countries Covered
- North America
- The US
- Canada
- Europe
- Germany
- France
- The UK
- Spain
- Italy
- Russia & CIS
- Rest of Europe
- APAC
- China
- Japan
- South Korea
- India
- ASEAN
- Rest of APAC
- Latin America
- Brazil
- Mexico
- Rest of Latin America
- Middle East & Africa
- GCC
- South Africa
- Rest of MEA
Key Players Analysis
The market for acrylic solid surfaces exists in a concentrated market environment and displays clear oligopoly characteristics. Few major companies in the form of chemical and material conglomerates dominate the higher echelons in the market. On the other hand, the market is riddled with numerous fragmented companies that serve smaller niches by meeting the customized needs of customers through niche fabrication services. Nevertheless, it is worth noting that the strategic and price-setting trends in the market are determined by the top five players, which together account for over 50% of the global market.
The competitive landscape is led by major corporations such as DuPont (Corian), LG Hausys (HI-MACS), Lotte Chemical (Staron), and Aristech Surfaces (Avonite). These key players maintain their market dominance through a strategy of continuous product differentiation, focusing on advanced properties like self-healing surfaces and integrated smart-surface technologies. This consolidated nature ensures that while smaller players may compete on local price points, the major players secure high-value commercial and infrastructural contracts by providing the technical scale and certification necessary for large-scale urban development.
Market Key Players
- DuPont de Nemours, Inc.
- LX Hausys, Ltd.
- Lotte Chemical Corporation
- Aristech Surfaces LLC
- Hanwha Solutions
- Porcelanosa Group
- Durasein
- Wilsonart LLC
- Meganite Inc.
- Tristone Solid Surfaces
- Swan Surfaces, LLC
- Kanger
Key Development
- In April 2026, DuPont strengthened its acrylic solid surface portfolio through new product development by launching 7 new Corian Solid Surface aesthetics and 2 new Corian Quartz colors. This move helped the company support designers looking for natural, seamless, and premium surface options in kitchens, bathrooms, healthcare, and commercial interiors.
- In February 2026, LX Hausys introduced 4 new HIMACS solid surface colors at KBIS 2026. The launch focused on acrylic-based, non-porous, repairable, and hygienic surfaces, helping the company improve its position in residential and commercial interior applications.
Report Scope
| Report Features | Description |
|---|---|
| Market Value (2025) | USD 3.1 Billion |
| Forecast Revenue (2035) | USD 4.2 Billion |
| CAGR (2023-2032) | 3.1% |
| Base Year for Estimation | 2025 |
| Historic Period | 2020-2025 |
| Forecast Period | 2026-2035 |
| Report Coverage | Revenue Forecast, Market Dynamics, Competitive Landscape, Recent Developments |
| Segments Covered | By Product Type (Pure acrylic solid surface, Modified / blended acrylic solid surface), By Application (Kitchen and bathroom countertops, Wall cladding and vertical surfaces, Furniture and fixtures, Healthcare and laboratory surfaces, Others), By End User (Residential, Commercial spaces, Hotels & restaurants, Healthcare & medical facilities) |
| Regional Analysis | North America – The US, Canada, & Mexico; Western Europe – Germany, France, The UK, Spain, Italy, Portugal, Ireland, Austria, Switzerland, Benelux, Nordic, & Rest of Western Europe; Eastern Europe – Russia, Poland, The Czech Republic, Greece, & Rest of Eastern Europe; APAC – China, Japan, South Korea, India, Australia & New Zealand, Indonesia, Malaysia, Philippines, Singapore, Thailand, Vietnam, & Rest of APAC; Latin America – Brazil, Colombia, Chile, Argentina, Costa Rica, & Rest of Latin America; Middle East & Africa – Algeria, Egypt, Israel, Kuwait, Nigeria, Saudi Arabia, South Africa, Turkey, United Arab Emirates, & Rest of MEA |
| Competitive Landscape | DuPont de Nemours, Inc., LX Hausys, Ltd., Lotte Chemical Corporation, Aristech Surfaces LLC, Hanwha Solutions, Porcelanosa Group, Durasein
Wilsonart LLC, Meganite Inc., Tristone Solid Surfaces, Swan Surfaces, LLC, Kanger. |
| Customization Scope | Customization for segments, region/country-level will be provided. Moreover, additional customization can be done based on the requirements. |
| Purchase Options | We have three licenses to opt for: Single User License, Multi-User License (Up to 5 Users), Corporate Use License (Unlimited User and Printable PDF) |


