One Stop Shop For Reports One Stop Shop For Reports
  • All Reports
  • All Sectors
    • Chemicals & Materials
      • Advanced Materials
      • Bulk Chemicals
      • Coatings | Paints and Additives
      • Composites
      • Renewable | Speciality chemicals
    • Consumer Goods
      • Baby Products
      • Consumer Electronics
      • Consumer Packaging
      • Cosmetics & Personal Care
      • Homecare & Decor
      • Luxury & premium products
    • Energy and Power
      • Energy Efficiency and Conservation
      • Green | Renewable Energy
      • Non Renewable | Conventional Energy
      • Power Equipment and Devices
    • Life Science
      • Biotechnology
      • Diagnostics
      • Healthcare
      • Healthcare IT
      • Medical Devices & Supplies
      • Pharmaceuticals
    • Food and Beverage
      • Agriculture & Agri Products
      • Beverages
      • Food Ingredients
      • Food Services and Hospitality
      • Nutraceutical | Wellness Food
      • Processed & Frozen Foods
    • Automotive and Transportation
      • Automotive components
      • Automotive Logistics
      • Automotive systems and accessories
    • Information and Communications Technology
      • E Commerce and Outsourcing
      • Entertainment & Media
      • High Tech | Enterprise & Consumer IT
      • Information & Network Security
      • Mobility | Telecom & Wireless
      • Software and Services
    • Semiconductor and Electronics
      • Semiconductor Materials and Components
      • Display Technology
      • Electronics System and Components
      • Emerging technologies
      • Security and Surveillance
      • Sensors and Controls
    • Building and Construction
      • Construction Materials
      • HVAC
      • Residential Construction and Improvement
      • Roads & Highways
    • Manufacturing
      • Manufacturing Services
      • Heavy Manufacturing
      • Packaging
      • Engineering | Equipment and Machinery
  • Who Trust Us
  • [email protected]
  • +1 718 874 1545 (International)
  • +91 78878 22626 (Asia)

More Results

One Stop Shop For Reports One Stop Shop For Reports
  • All Reports
  • All Sectors
    • Chemicals & Materials
      • Advanced Materials
      • Bulk Chemicals
      • Coatings | Paints and Additives
      • Composites
      • Renewable | Speciality chemicals
    • Consumer Goods
      • Baby Products
      • Consumer Electronics
      • Consumer Packaging
      • Cosmetics & Personal Care
      • Homecare & Decor
      • Luxury & premium products
    • Energy and Power
      • Energy Efficiency and Conservation
      • Green | Renewable Energy
      • Non Renewable | Conventional Energy
      • Power Equipment and Devices
    • Life Science
      • Biotechnology
      • Diagnostics
      • Healthcare
      • Healthcare IT
      • Medical Devices & Supplies
      • Pharmaceuticals
    • Food and Beverage
      • Agriculture & Agri Products
      • Beverages
      • Food Ingredients
      • Food Services and Hospitality
      • Nutraceutical | Wellness Food
      • Processed & Frozen Foods
    • Automotive and Transportation
      • Automotive components
      • Automotive Logistics
      • Automotive systems and accessories
    • Information and Communications Technology
      • E Commerce and Outsourcing
      • Entertainment & Media
      • High Tech | Enterprise & Consumer IT
      • Information & Network Security
      • Mobility | Telecom & Wireless
      • Software and Services
    • Semiconductor and Electronics
      • Semiconductor Materials and Components
      • Display Technology
      • Electronics System and Components
      • Emerging technologies
      • Security and Surveillance
      • Sensors and Controls
    • Building and Construction
      • Construction Materials
      • HVAC
      • Residential Construction and Improvement
      • Roads & Highways
    • Manufacturing
      • Manufacturing Services
      • Heavy Manufacturing
      • Packaging
      • Engineering | Equipment and Machinery
  • Who Trust Us
Home ➤ Chemicals & Materials ➤ Advanced Materials ➤ Nanocatalysts Market
Nanocatalysts Market
Published date: August 2026 • Formats:
[email protected] +1 718 874 1545
Request Sample Schedule a Call
Table of Contents
  • Report Overview
  • Key Takeaways
  • By Material Type
  • By Types of Nanocatalysts
  • By Application
  • Key Market Segments
  • Driver Analysis
  • Restraint Analysis
  • Opportunity Analysis
  • Challenges Analysis
  • Geopolitical Impact Analysis
  • Regional Analysis
  • Key Players Analysis
  • Key Development
  • Report Scope
  • Home ➤ Chemicals & Materials ➤ Advanced Materials ➤ Nanocatalysts Market

Nanocatalysts Market Size, Share And Analysis Report By Material Type (Metal & Alloy Nanocatalysts, Carbon-Based Nanocatalysts), By Type of Nanocatalysts (Homogeneous Nanocatalysts, Heterogeneous Nanocatalysts), By Application (Wastewater Treatment, Energy & Fuel Production, Petroleum Refining, Drug Synthesis, Others), By Region and Companies Industry Segment Outlook, Market Assessment, Competition Scenario, Trends and Forecast 2026 2035

  • Published date: August 2026
  • Report ID: 83579
  • Number of Pages: 256
  • Format:
Fact Checked
Nanocatalysts Market https://market.us/report/nanocatalysts-market/
Cite this Research
  • Overview
  • Table of Contents
  • Segmentation
  • currency-icon
    Revenue, 2025 (US$B)
    2.7 Bn
    growth-icon
    Forecast, 2035 (US$B)
    6.2 Bn
    chart-icon
    CAGR, 2025 - 2035
    7.9%
    globe-icon
    Leading Region
    Asia Pacific

    Quick Navigation

    • Report Overview
    • Key Takeaways
    • By Material Type
    • By Types of Nanocatalysts
    • By Application
    • Key Market Segments
    • Driver Analysis
    • Restraint Analysis
    • Opportunity Analysis
    • Challenges Analysis
    • Geopolitical Impact Analysis
    • Regional Analysis
    • Key Players Analysis
    • Key Development
    • Report Scope

    Report Overview

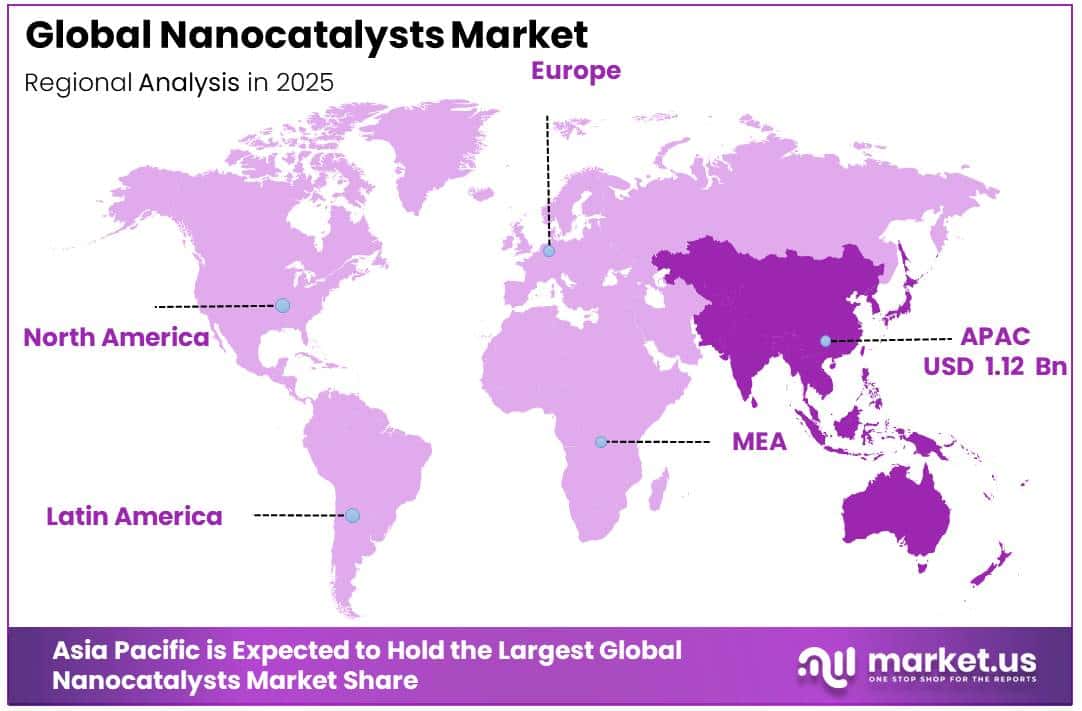
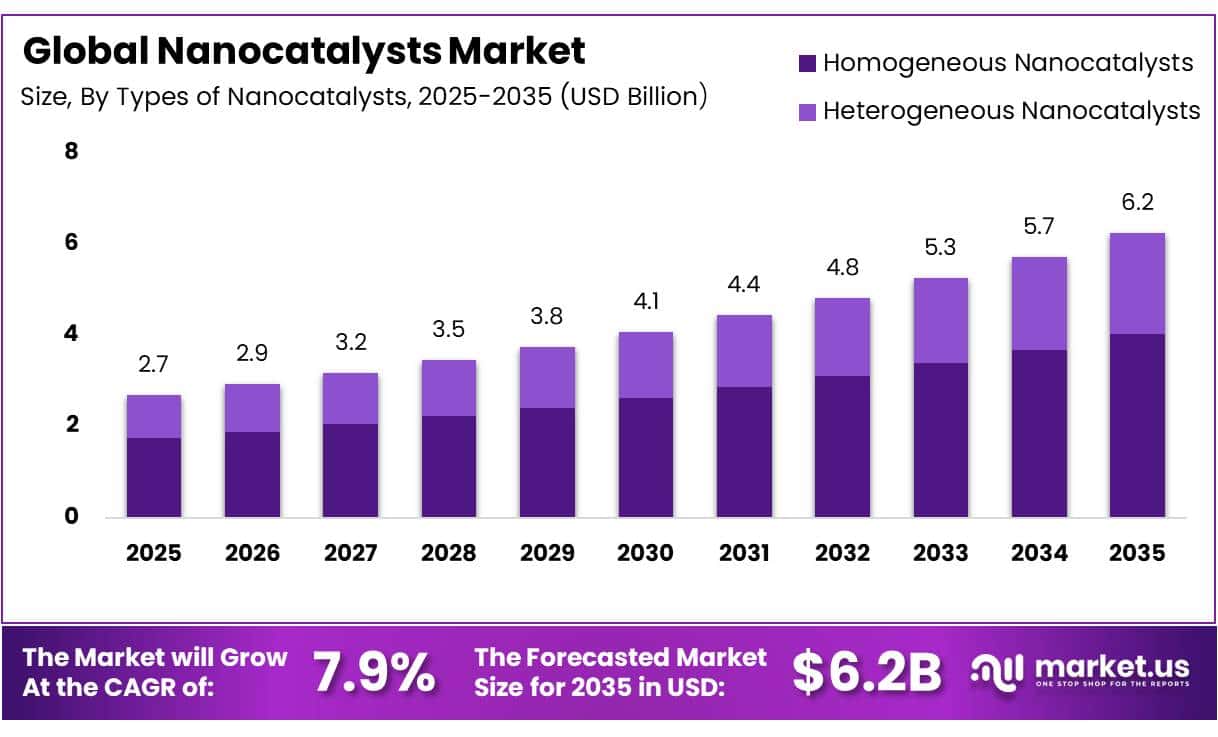
    In 2025, the Global Nanocatalysts Market was valued at USD 2.7 billion, and between 2026 and 2035, this market is estimated to register a CAGR of 7.9%, reaching about USD 6.2 billion by 2035. Asia Pacific held a dominant market position, capturing more than a 41.3% share, holding USD 1.12 billion in revenue.

    Nanocatalysts, engineered from metals such as platinum, palladium, and gold at the nanoscale, represent a significant advancement in chemical process technology. Their nanoscale dimensions confer a substantially higher surface area than conventional catalysts, improving reaction efficiency, selectivity, and energy consumption. This positions nanocatalysts as a critical enabler across petrochemical refining, chemical manufacturing, and environmental remediation, where enhanced catalytic performance lowers operational costs and reduces emissions during large scale industrial production.
    Key Takeaways

    • The global nanocatalysts market was valued at USD 2.7 billion in
    • The global market is projected to grow at a CAGR of 7.9% and is estimated to reach USD 6.2 billion by 2035.
    • On the basis of material type, Metal-based Nanocatalysts dominated the market, constituting 46.2% of the total market share.
    • Based on the type of Nanocatalysts, Homogeneous Nanocatalysts dominated the market, with a substantial market share of around 64.34%.
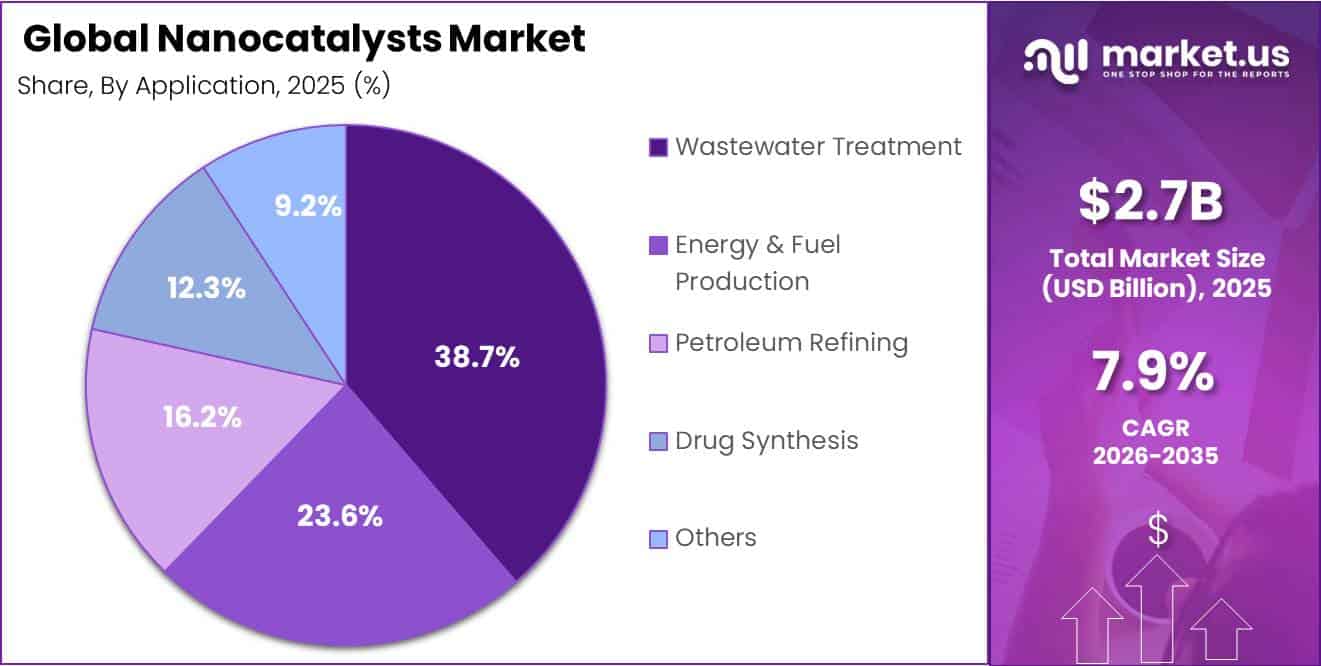
    • Based on the application, wastewater treatment led the market, comprising 38.7% of the total market.
    • In 2025, Asia Pacific was the most dominant region in the nanocatalysts market, accounting for 41.3% of the total global market.

    Industrially, nanocatalysts are deployed extensively in petroleum refining for cracking and hydrotreating operations, in chemical synthesis for producing polymers and specialty chemicals, and in automotive catalytic converters for emission control. The United States Environmental Protection Agency and the United States Department of Energy have both recognized advanced catalytic materials as central to reducing industrial emissions. Fuel cell development and green hydrogen production increasingly depend on nanoscale catalytic systems to improve efficiency and lower clean energy costs.

    Growth in the nanocatalysts sector is primarily driven by tightening environmental regulations, rising demand for cleaner fuel production, and the global transition toward decarbonized industrial processes. The United States Department of Energy allocated 81 million United States Dollars for electrolyzer catalyst, membrane, and component development to advance affordable hydrogen production, under the Infrastructure Investment and Jobs Act. This investment illustrates growing opportunities for nanocatalysts in electrolysis, fuel cell technology, and industrial decarbonization, as manufacturers pursue scalable synthesis methods for consistent performance.

    Government support remains a substantial growth enabler for this sector. The United States National Nanotechnology Initiative requested 2.16 billion United States Dollars in its fiscal year 2024 budget, bringing cumulative federal funding to over 43 billion United States Dollars since its establishment in 2001. The European Commission Horizon Europe programme, with an indicative budget of 93.5 billion Euros for the 2021 to 2027 period, funds nanotechnology and advanced materials research across member states

    By Material Type

    Metal-based Nanocatalysts dominate with 46.2% share due to their broad use across established catalytic processes.

    In 2025, Metal-based Nanocatalysts held a dominant market position, capturing more than a 46.2% share. Their leading position was supported by their continued use in a wide range of catalytic applications where consistent reaction performance and process efficiency are important. Metal-based nanocatalysts remained a preferred choice across industries because they can be produced in different compositions to suit specific chemical reactions. During 2025, their adoption continued across industrial operations that require stable catalytic activity under controlled processing conditions.

    Carbon-based Nanocatalysts emerged as the growing material type as industries increasingly explored lightweight and advanced catalyst materials for next-generation applications. During 2025 and into 2026, interest in carbon-based nanocatalysts continued to expand because of their unique structural properties and their potential to support more efficient catalytic reactions. Research institutions and publicly funded scientific programs continued to investigate new carbon nanomaterials for environmental and energy-related applications, contributing to the growing attention toward this segment.

    By Types of Nanocatalysts

    Homogeneous Nanocatalysts dominate with 64.34% share owing to their high catalytic efficiency in controlled reactions.

    In 2025, Homogeneous Nanocatalysts held a dominant market position, capturing more than a 64.34% share. Their strong market presence was supported by their ability to provide uniform interaction with reactants, making them suitable for applications that require high reaction efficiency and precise control. Throughout 2025, they remained widely used in chemical processing and laboratory-based catalytic applications where consistent performance was important.

    Heterogeneous Nanocatalysts emerged as the growing segment as industries increased their focus on catalyst recovery, reuse, and process efficiency. During 2025 and into 2026, interest in this segment continued to rise because heterogeneous systems can be more easily separated from reaction mixtures, making them attractive for large-scale industrial operations. Public research programs and scientific institutions continued to explore new catalyst designs and improved surface materials to enhance catalytic performance.

    By Application

    Wastewater Treatment leads with 38.7% share driven by the growing need for effective water purification.

    In 2025, Wastewater Treatment held a dominant market position, capturing more than a 38.7% share. Its leading position was supported by the continued demand for advanced treatment technologies that help remove pollutants and improve water quality. Across 2025, nanocatalysts remained an important part of research and treatment processes aimed at improving the breakdown of contaminants and increasing treatment efficiency.

    Energy & Fuel Production emerged as the growing application segment as the focus on cleaner energy systems and more efficient fuel production continued to increase. During 2025 and into 2026, research supported by government laboratories, public energy programs, and scientific institutions expanded the development of nanocatalysts for energy-related applications. The growing interest in improving reaction efficiency and reducing environmental impact encouraged further exploration of advanced catalytic materials.
    Key Market Segments

    By Material Type

    • Metal-based Nanocatalysts
    • Carbon-based Nanocatalysts
    • Polymeric Nanocatalysts
    • Composite Nanocatalysts

    By Types of Nanocatalysts

    • Homogeneous Nanocatalysts
    • Heterogeneous Nanocatalysts

    By Application

    • Wastewater Treatment
    • Energy & Fuel Production
    • Petroleum Refining
    • Drug Synthesis
    • Others

    Driver Analysis

    Green-hydrogen electrocatalyst scale-up

    Hydrogen deployment is the strongest demand-expansion vector for nanocatalysts because electrolyser economics are governed by catalyst loading, current density, voltage efficiency, durability and stack replacement cycles rather than merely by reactor capacity. Global installed water-electrolyser capacity reached about 2 GW in 2024, while more than 1 GW was added during the first seven months of 2025; China accounted for roughly 65% of installed capacity and projects at final investment decision, and nearly 60% of manufacturing capacity, making Chinese alkaline-electrolyser supply chains a decisive volume market for nickel-, iron-, cobalt- and ruthenium-based nanoscale catalyst formulations.

    In parallel, the U.S. Department of Energy’s 2026 clean-hydrogen benchmark is $2/kg, progressing toward $1/kg by 2031, alongside a high-temperature-electrolyser stack target of $125/kW, 1.2 A/cm², 1.28 V and 40,000 operating hours. These targets change nanocatalyst value capture from selling a high-performance powder into supplying qualified membrane-electrode assemblies, supported catalyst inks, coated electrodes and performance warranties: suppliers that lower platinum-group-metal loading without sacrificing degradation rates can earn a higher share of stack bill-of-material value. The commercial constraint is project slippage—more than half of prospective electrolyser capacity was reported at risk of missing original operating dates—so near-term sales will concentrate in projects that have reached FID, especially in China, the EU, North America, India and Gulf export corridors.

    Drivers Impact Analysis

    Driver (~) % Impact on CAGR Geographic Relevance Impact Timeline
    Green-hydrogen electrocatalyst scale-up +2.1 pp China, North America, EU, India, Gulf Medium term (2–4 years)
    Tightening vehicle-emissions compliance +1.5 pp EU, China, North America, India Short term (≤ 2 years)
    Low-carbon chemical process intensification +1.7 pp EU, North America, China, Japan, Korea Medium term (2–4 years)
    Precious-metal thrift and catalyst recycling +1.2 pp Global refining, automotive and fuel-cell hubs Short term (≤ 2 years)
    Water treatment and VOC-abatement investment +1.0 pp China, India, Southeast Asia, North America Medium term (2–4 years)
    CO₂ conversion and circular-carbon projects +0.9 pp EU, North America, China, Gulf, Japan Long term (≥ 4 years)

    Restraint Analysis

    PGM price and supply volatility

    Precious-metal-bearing nanocatalysts face structural margin compression because platinum, palladium, rhodium, ruthenium and iridium can represent a disproportionate share of the finished catalyst’s working-capital requirement even when metal loading is low, while price movements occur faster than many fixed-price customer contracts can be renegotiated. Platinum prices rose nearly 30% in the first half of 2025 and were reported at roughly 62% above their 2025 average during the first half of 2026; platinum and palladium also recorded gains of around 90% between early April and mid-October 2025, illustrating how metal-price shocks can overwhelm planned gross-margin assumptions.

    This reduces adoption in price-sensitive emissions control, electrolysis, fuel-cell and petrochemical applications even where nanoscale dispersion lowers metal intensity, because buyers assess total cost per operating hour rather than theoretical activity per gram. The impact is global but acute in U.S., EU, Chinese, Japanese and Korean value chains dependent on imported PGMs, deducting an estimated -1.7 percentage points from near-term CAGR until leasing, take-back and closed-loop refining models scale sufficiently to buffer input volatility.

    Restraint Impact Analysis

    Restraint (~) % Impact on CAGR Geographic Relevance Impact Timeline
    Scale-up and batch reproducibility -2.2 pp North America, EU, Japan, Korea Medium term (2–4 years)
    PGM price and supply volatility -1.7 pp Global; US, EU, China, Japan Short term (≤ 2 years)
    Durability, sintering and leaching -1.8 pp Global refining, chemicals, hydrogen Medium term (2–4 years)
    Nanoform safety compliance -1.3 pp EU core, UK, North America, Japan Short term (≤ 2 years)
    Long customer qualification cycles -1.5 pp EU, North America, China, India Medium term (2–4 years)
    Trade friction and supply concentration -0.9 pp US–China corridor, EU, APAC Short term (≤ 2 years)

    Opportunity Analysis

    PGM-free electrolyser materials

    The next major white space is not simply additional electrolyser demand—which is already a baseline driver—but the replacement of expensive and supply-constrained iridium-, ruthenium- and platinum-group-metal catalyst systems with scalable nickel-iron, manganese, cobalt-lean, molybdenum, tungsten or atomically dispersed base-metal nano-architectures for alkaline, anion-exchange-membrane and selected PEM-adjacent platforms. Global installed water-electrolysis capacity reached 2 GW in 2024 and added more than 1 GW through July 2025, while China accounted for roughly 65% of installed capacity and final-investment-decision capacity and nearly 60% of global electrolyser manufacturing capacity; this installed-manufacturing base creates a large future qualification pool for low-cost catalyst platforms rather than an immediately captured market.

    The value proposition is defined by stack economics: DOE identifies a $2/kg clean-hydrogen objective for 2026 and $1/kg by 2031, while low-temperature electrolyser system cost targets include $250/kW in 2026; a catalyst system that reduces noble-metal exposure by 70–90%, maintains 1.0 A/cm² at 1.8 V in alkaline operation, and achieves 30,000–50,000-hour durability could reduce stack material volatility and accelerate adoption in cost-sensitive projects. The estimated +2.4 percentage-point CAGR upside therefore depends on suppliers converting laboratory formulations into qualified catalyst inks, electrodes and membrane-electrode assemblies during 2026–2030, principally in China, India, Europe and North America, rather than merely selling nanopowders into research markets.

    Opportunity Impact Analysis

    Opportunity (~) % Potential CAGR Geographic Relevance Execution Window
    Catalyst-as-a-service platforms +1.8 pp North America, EU, China, Japan Short term (≤ 2 years)
    PGM-free electrolyser materials +2.4 pp China, India, EU, North America Medium term (2–4 years)
    CO₂-to-molecules modular plants +1.7 pp EU, Gulf, North America, China Long term (≥ 4 years)
    Quaternary-water treatment modules +1.5 pp EU core, North America, India Medium term (2–4 years)
    E-waste catalyst metal recovery +1.2 pp EU, Japan, Korea, North America Short term (≤ 2 years)
    Catalyst formulators M&A roll-up +1.0 pp EU, China, India, North America Medium term (2–4 years)

    Challenges Analysis

    Pilot-to-Plant Process Drift

    The defining operational challenge is not whether a nanocatalyst can be synthesized, but whether the same active-site distribution can be reproduced continuously after moving from gram-scale batches to 10–100 kg pilot lots and eventually multi-tonne output; continuous-flow nanocatalyst production still encounters reactor fouling, channel clogging, process drift, inconsistent downstream drying and loss of structural fidelity during scale-up and handling. At industrial scale, a 2–5 nm shift in median particle size, a 5–10% reduction in accessible surface area, or a small change in metal-support interaction can materially alter selectivity, pressure drop, leaching and regeneration behavior, forcing producers to quarantine lots, repeat analytical testing and maintain higher safety stock.

    The financial effect is a recurring 3–8 percentage-point yield-loss risk during process transfer, plus 6–12 months of additional pilot validation for refinery or chemical-unit adoption, which constrains asset utilization and defers revenue recognition. Rather than a current hard restraint, this is a persistent engineering-management task requiring statistically controlled synthesis, inline particle analytics, digital batch records, redundant precursor specifications, accelerated ageing protocols and customer-agreed equivalency windows; until these capabilities normalize, the challenge creates an estimated -1.6 percentage-point drag on achievable CAGR in North America, Europe, Japan and South Korea.

    Challenges Impact Analysis

    Challenge (~) % CAGR Friction Geographic Relevance Mitigation Horizon
    Pilot-to-plant process drift -1.6 pp North America, EU, Japan, Korea Medium term (2–4 years)
    Fragmented performance standards -1.3 pp EU, North America, China, Japan Long term (≥ 4 years)
    Critical-input logistics volatility -1.1 pp US–China corridor, EU, APAC Medium term (2–4 years)
    Specialist workforce scarcity -0.9 pp North America, EU, Japan, India Long term (≥ 4 years)
    Application data interoperability -0.8 pp Global industrial hubs Medium term (2–4 years)
    Project-demand timing mismatch -1.2 pp EU, North America, Australia, Gulf Medium term (2–4 years)

    Geopolitical Impact Analysis

    Geopolitical tensions reshape nanocatalysts supply chains and research priorities.

    The current geopolitical environment, including the continuing conflicts in Ukraine and the Middle East, has influenced the nanocatalysts market by affecting the movement of raw materials, industrial chemicals, and specialized manufacturing equipment. During 2025, disruptions in global shipping routes, higher freight costs, and longer delivery times created additional pressure on manufacturers that depend on imported materials for catalyst production. These challenges encouraged many producers to review their sourcing strategies and reduce reliance on a single region.

    Government agencies in several countries also increased attention on securing supplies of critical minerals and advanced materials used in chemical manufacturing. This has led to greater support for domestic production, research programs, and collaboration between public laboratories and industrial partners. As a result, investments in local manufacturing capabilities and alternative material development have gained importance.

    Despite these challenges, the nanocatalysts market has remained resilient. Companies and research institutions continue to adapt by diversifying suppliers, strengthening regional production networks, and focusing on technologies that improve resource efficiency and reduce dependence on vulnerable global supply chains.

    Regional Analysis

    Asia Pacific Dominant Region, 41.3% share, USD 1.12 Bn.

    Asia Pacific stands as the dominating region in the global nanocatalysts industry, accounting for 41.3% of the market with a value of 1.12 billion United States Dollars, driven substantially by large scale petrochemical refining and extensive industrial chemical manufacturing activity across the region. China anchors this regional leadership, with its total refinery capacity reaching 19 million barrels per day in 2024, according to the United States Energy Information Administration. This expansive refining base creates sustained demand for advanced catalytic materials, including nanocatalysts, across cracking, hydrotreating, and petrochemical feedstock processing operations.

    The International Energy Agency projects that new global refining capacity additions through 2030 will be concentrated predominantly in the Asian region, reinforcing the region’s structural advantage in sustained catalyst demand. Petrochemical feedstock production, particularly naphtha and liquefied petroleum gas processing integrated with refining operations, is expanding across Chinese facilities, further supporting nanocatalyst adoption in polymer and specialty chemical synthesis. National carbon neutrality commitments across the region are accelerating investment in cleaner catalytic technologies for emissions reduction and improved fuel efficiency.

    Key Regions and Countries Covered

    • North America
      • The US
      • Canada
    • Europe
      • Germany
      • France
      • The UK
      • Spain
      • Italy
      • Russia & CIS
      • Rest of Europe
    • APAC
      • China
      • Japan
      • South Korea
      • India
      • ASEAN
      • Rest of APAC
    • Latin America
      • Brazil
      • Mexico
      • Rest of Latin America
    • Middle East & Africa
      • GCC
      • South Africa
      • Rest of MEA

    Key Players Analysis

    Nanocatalysts manufacturers focus on strengthening material performance, production consistency, and application-specific development to remain competitive in the market. A major priority is the design of advanced nanocatalyst materials with improved surface area, stability, and catalytic efficiency for industrial and environmental processes. Companies continue to invest in research aimed at enhancing catalyst durability while reducing the use of expensive metals through optimized material formulations.

    Another important strategy is expanding manufacturing capabilities and strengthening supply chains to meet growing industrial demand. Companies are working to secure stable access to raw materials while improving production efficiency to manage operating costs. Many manufacturers are also focusing on application-driven product portfolios, offering customized nanocatalysts for wastewater treatment, chemical processing, petroleum refining, energy production, and pharmaceutical synthesis. Investments in pilot-scale production and advanced testing facilities help validate product performance before commercial deployment.

    Market Key Players

    • BASF SE
    • Dow, Inc.
    • Bayer AG
    • Evonik Industries AG
    • NanoScale Corporation
    • Nanophase Technologies Corporation
    • Catalytic Solution, Inc.
    • Hyperion Catalysis International
    • Headwaters NanoKinetix, Inc.
    • Nanostellar, Inc.

    Key Development

    • March 2026: Evonik Industries AG launched Chlorocel 909, a next generation mixed metal oxide chloride adsorbent for catalytic reformer applications, offering more than 15 percent higher chloride loading capacity compared to existing mixed metal oxide alternatives.

    Report Scope

    Report Features Description
    Market Value (2025) USD 2.7 Bn
    Forecast Revenue (2035) USD 6.2 Bn
    CAGR (2026 2035) 7.9%
    Base Year for Estimation 2025
    Historic Period 2020 2024
    Forecast Period 2026 2035
    Report Coverage Revenue Forecast, Market Dynamics, Competitive Landscape, Recent Developments
    Segments Covered By Material Type (Metal & Alloy Nanocatalysts, Carbon-Based Nanocatalysts), By Type of Nanocatalysts (Homogeneous Nanocatalysts, Heterogeneous Nanocatalysts), By Application (Wastewater Treatment, Energy & Fuel Production, Petroleum Refining, Drug Synthesis, Others)
    Regional Analysis North America  – The US & Canada; Europe  – Germany, France, The UK, Spain, Italy, Russia & CIS, Rest of Europe; APAC  China, Japan, South Korea, India, ASEAN & Rest of APAC; Latin America  Brazil, Mexico & Rest of Latin America; Middle East & Africa  GCC, South Africa, & Rest of MEA
    Competitive Landscape BASF SE, Dow, Inc., Bayer AG, Evonik Industries AG, NanoScale Corporation, Nanophase Technologies Corporation, Catalytic Solution, Inc., Hyperion Catalysis International, Headwaters NanoKinetix, Inc., and Nanostellar, Inc.
    Customization Scope Customization for segments, region/country level will be provided. Moreover, additional customization can be done based on the requirements.
    Purchase Options We have three licenses to opt for: Single User License, Multi User License (Up to 5 Users), Corporate Use License (Unlimited Users and Printable PDF)


    keyboard_arrow_up
  • Segments Sub-segments
    By Material Type
    • Metal-based Nanocatalysts
    • Carbon-based Nanocatalysts
    • Polymeric Nanocatalysts
    • Composite Nanocatalysts
    By Types of Nanocatalysts
    • Homogeneous Nanocatalysts
    • Heterogeneous Nanocatalysts
    By Application
    • Wastewater Treatment
    • Energy & Fuel Production
    • Petroleum Refining
    • Drug Synthesis
    • Others

     
    North America Europe Asia Pacific Latin America Middle East & Africa
    • US
    • Canada
    • Germany
    • France
    • The UK
    • Spain
    • Italy
    • Rest of Europe
    • China
    • Japan
    • South Korea
    • India
    • Australia
    • Rest of APAC
    • Brazil
    • Mexico
    • Rest of Latin America
    • GCC
    • South Africa
    • Rest of MEA
Nanocatalysts Market
Published date: August 2026
add_shopping_cartBuy Now get_appDownload Sample

Related Reports

  • Animal-Free Dairy Products Market
  • AI in Food Preservatives Market
  • Jesuit Tea Market
  • Broccoli Seed Oil Market
  • Ready to Drink Premixes Market
  • Plant Based Proteins Market
  • Superconducting Wire Market
  • Carbon Black Market
  • Power Tool Market
  • Nuts Market
Nanocatalysts Market
  • 83579
  • August 2026
    • ★★★★★
      ★★★★★
Buy Now
Trusted by more than 17382 organizations globally
  • Client Logo
  • Client Logo
  • Client Logo
  • Client Logo
  • Client Logo
  • Client Logo
  • Client Logo
  • Client Logo
  • Client Logo
  • Client Logo
  • Client Logo
  • Client Logo
  • Client Logo
  • Client Logo
  • Client Logo
  • Client Logo

Our Clients

philips
pentair
suez
ecowater
ergobaby
fabricato
genomatica
lenzing
lilly
siemens
honeywell
valspar
pactiv
petsure
schweitzer-online
sappi
pfizer
unilabs
lonza
BD
mckinsey
hilti
✖
Request a Sample Report
We'll get back to you as quickly as possible
CAPTCHA Code

✖
Request a Sample Report
We'll get back to you as quickly as possible
CAPTCHA Code

  • location_on420 Lexington Avenue, Suite 300 New York City, NY 10170,
    United States
  • phone+1 718 874 1545 (International)
  • phone+91 78878 22626 (Asia)
  • email[email protected]
  • Facebook Logo
  • Twitter Logo
  • LinkedIn Logo
Find Help
  • Contact Us
  • How to Order
Legal
  • Privacy Policy
  • Refund Policy
  • Frequently Asked Questions
  • Terms and Conditions
Explore
  • About Us
  • Our Clients
  • Media Mentions
  • Infographics
  • Statistics and Facts
  • Research Methodology
  • Why Choose Us?
Secured Payment Options

© 2026 Market.Us. All Rights Reserved.