


Report Overview
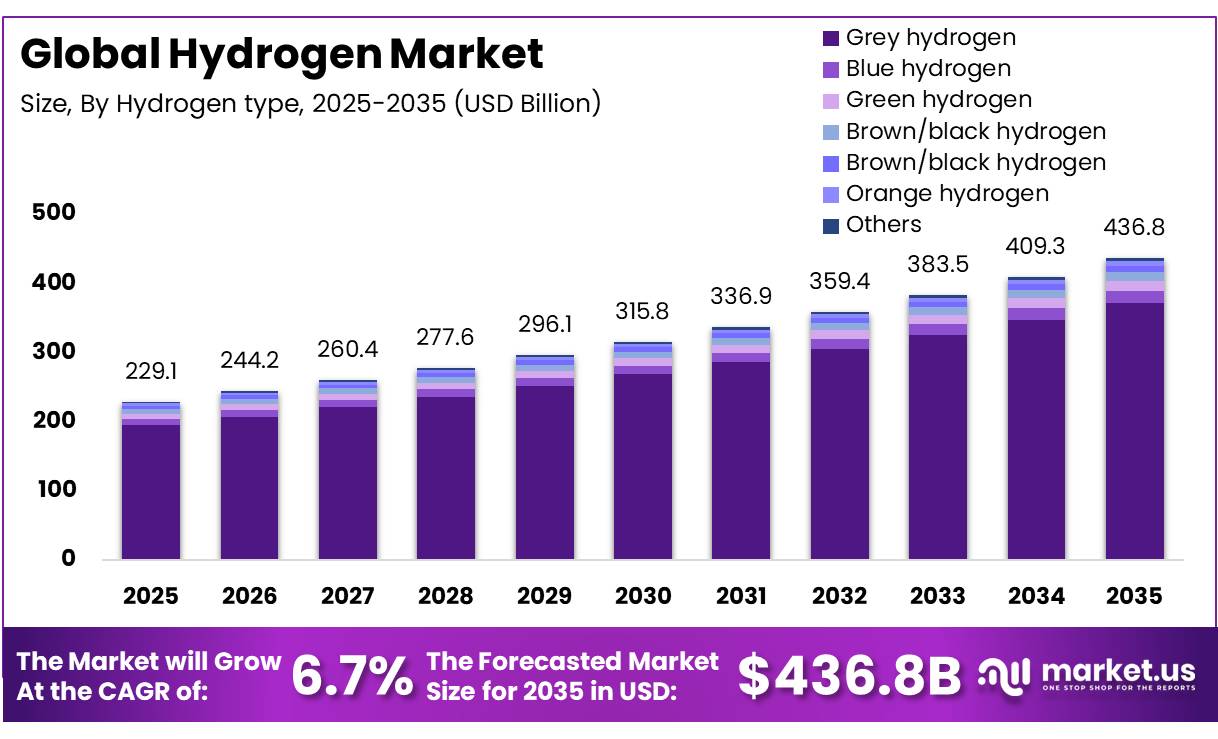
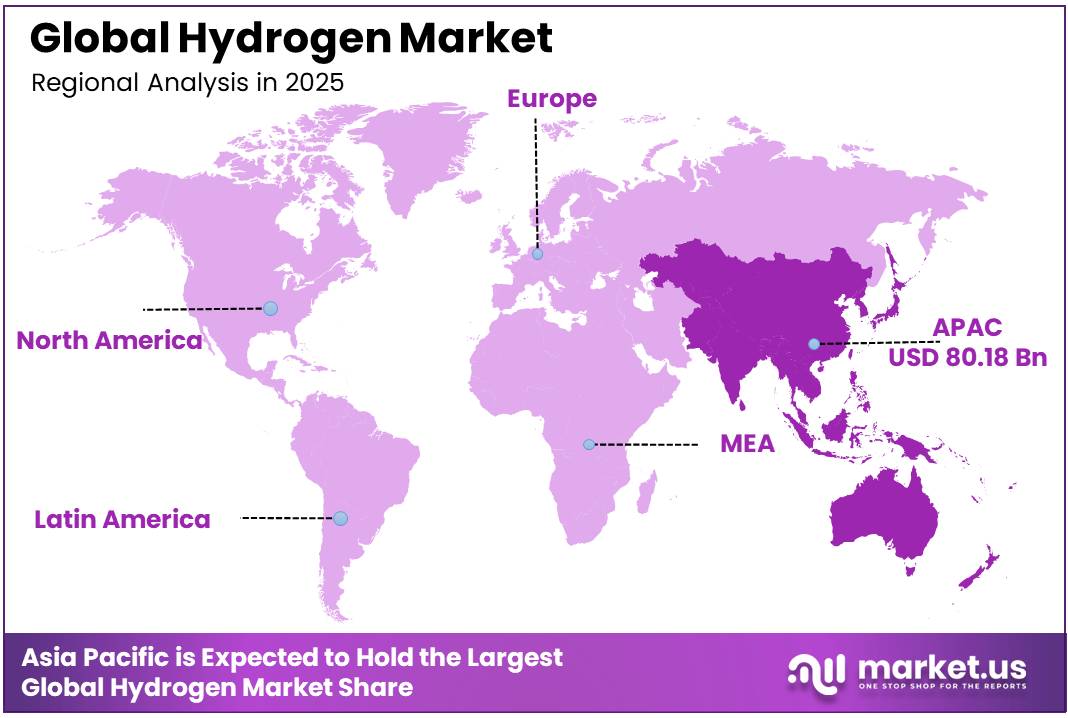
In 2025, the Hydrogen Market was valued at USD 229.1 Billion, and between 2026 and 2035, this market is estimated to register a CAGR of 6.7%, reaching about USD 436.8 Billion by 2035. Asia Pacific held a dominant market position, capturing more than a 35% share, holding USD 80.18 Billion in revenue.
The global hydrogen market represents a critical pillar of the ongoing energy transition, encompassing production, storage, distribution, and end-use applications across refining, ammonia, methanol, and steelmaking sectors.
- According to the International Energy Agency (IEA), worldwide hydrogen demand increased to almost 100 million tonnes (Mt) in 2024, up 2% from 2023, in line with overall energy demand growth. This demand growth signals continued reliance on hydrogen for industrial feedstock uses, even as low-emissions production pathways gradually gain traction across the world.
Key Takeaways
- The Global Hydrogen Market was valued at USD 229.1 billion in 2025.
- The global hydrogen market is projected to grow at a CAGR of 6.7% and is estimated to reach USD 436.8 billion by 2035.
- On the basis of hydrogen type, Grey Hydrogen dominated the market, constituting 85% of the total market share.
- Based on the production technology, Steam Methane Reforming dominated the market, accounting for 60% of the total market share.
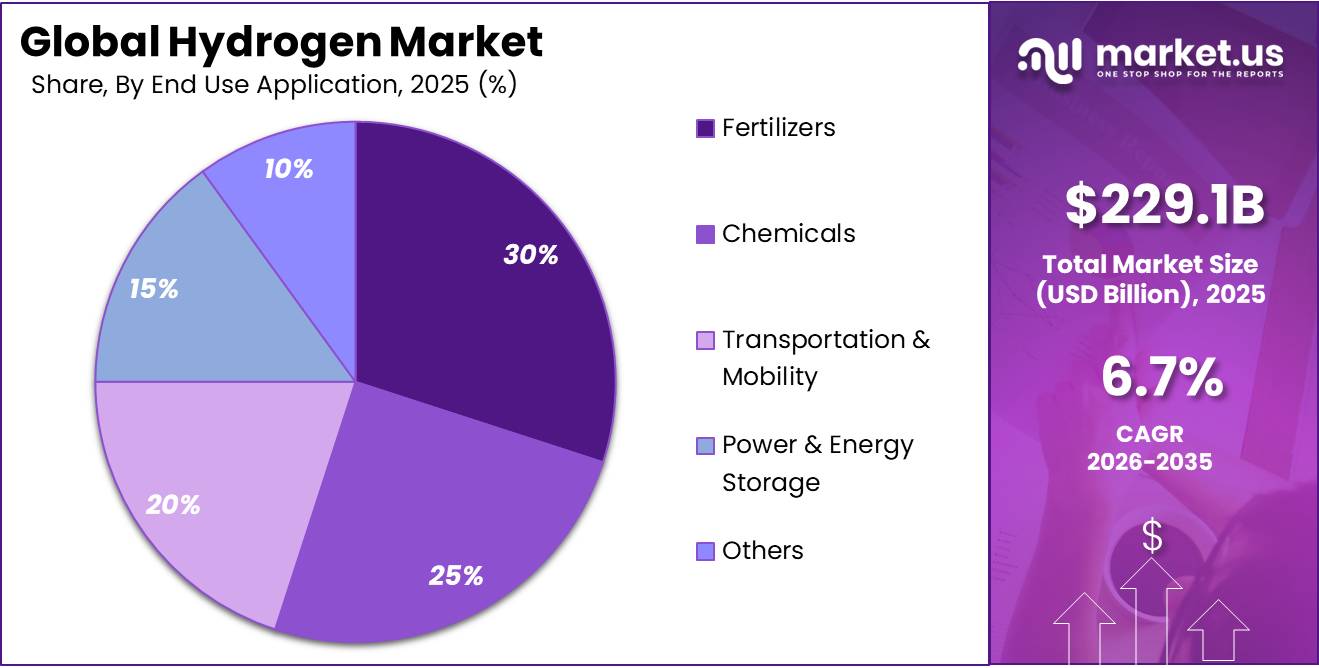
- Based on the end use application, Fertilizers dominated the market, accounting for 30% of the total market share.
- In 2025, Asia Pacific was the most dominant region in the hydrogen market, accounting for 35% of the global market.
The industrial scenario remains dominated by fossil-fuel-based production methods. The IEA notes that low-emissions hydrogen production from projects that are operational or have reached final investment decision (FID) is set to reach 4.2 million tonnes per annum (Mtpa) by 2030, a fivefold increase compared with 2024 production levels. Total announced low-emissions project capacity by 2030 has, however, declined to 37 Mtpa from 49 Mtpa a year earlier, due to project cancellations and delays, with electrolysis-based projects accounting for more than 80% of this decline.
Growth opportunities are emerging from federal funding programs and decarbonisation mandates. The United States Department of Energy (DOE) reports that the Infrastructure Investment and Jobs Act (IIJA) allocated $9.5 billion for hydrogen, including $8 billion for regional Hydrogen Hubs and $1 billion for electrolysis research, development and demonstration. The Inflation Reduction Act (IRA) additionally offers a production tax credit of up to $3 per kilogram of hydrogen and a 30% investment tax credit for new hydrogen-production facilities.
Government initiatives continue to accelerate market development globally. The DOE’s Hydrogen Shot initiative targets an 80% cost reduction to $1 per kilogram within a decade, aiming to expand hydrogen use in iron and steel production, ammonia, heavy-duty trucking, and energy storage. Separately, the European Commission’s REPowerEU Plan sets a target of producing 10 million tonnes of renewable hydrogen domestically and importing 10 million tonnes by 2030, with hydrogen currently accounting for less than 2% of Europe’s energy consumption.
By Hydrogen Type
Grey Hydrogen dominates with 85% share due to its established production base and extensive industrial adoption.
In 2025, Grey Hydrogen held a dominant market position, capturing more than 85% share in the Hydrogen Market by hydrogen type. Its strong market presence was supported by its well-established production infrastructure and long-standing use across industrial operations. Many hydrogen producers continued to depend on conventional production methods because of their commercial maturity, operational reliability, and compatibility with existing facilities.
Blue Hydrogen is expected to witness growth over the forecast period as industries and governments continue to promote lower-emission hydrogen production. In 2026, ongoing investments in carbon capture technologies, clean hydrogen projects, and industrial decarbonization programs supported greater interest in this segment. Companies are increasingly evaluating Blue Hydrogen as a practical transition option because it can utilize existing production infrastructure while reducing emissions.
By Production Technology
Steam Methane Reforming dominates with 60% share due to its mature technology and widespread industrial deployment.
In 2025, Steam Methane Reforming held a dominant market position, capturing more than 60% share in the Hydrogen Market by production technology. Its leading position was supported by its long-established commercial use, proven operational efficiency, and broad integration across large-scale hydrogen production facilities. The technology remained the preferred choice for industries requiring continuous and high-volume hydrogen output because it is supported by well-developed infrastructure and extensive operational experience.
Electrolysis is expected to witness growth over the forecast period as the global focus on clean hydrogen production continues to strengthen. In 2026, governments, energy agencies, and industrial stakeholders increased support for low-emission hydrogen projects through policy initiatives and investments in renewable energy integration. The growing availability of renewable electricity and continued advancement in electrolyzer technologies are expected to encourage wider adoption of electrolysis, particularly in regions pursuing long-term decarbonization and energy transition goals.
By End Use Application
Fertilizers dominate with 30% share due to the essential role of hydrogen in ammonia production.
In 2025, Fertilizers held a dominant market position, capturing more than 30% share in the Hydrogen Market by end-use application. The segment maintained its leading position because hydrogen is an essential raw material in the production of ammonia, which is widely used to manufacture nitrogen-based fertilizers. Strong and consistent demand from the agricultural sector supported continuous hydrogen consumption across fertilizer manufacturing facilities.
Chemicals is expected to witness growth over the forecast period as industries continue to increase the use of hydrogen in a wide range of chemical manufacturing processes. In 2026, the focus on cleaner industrial production, improved process efficiency, and lower-emission manufacturing supported greater interest in hydrogen across the chemical sector. Continued investments in industrial modernization and clean hydrogen initiatives by governments and industry stakeholders are expected to encourage broader adoption of hydrogen in chemical applications.
Key Market Segments
By hydrogen type
- Grey hydrogen
- Blue hydrogen
- Green hydrogen
- Brown/black hydrogen
- Turquoise hydrogen
- Orange hydrogen
- Others
By production technology
- Steam methane reforming
- Electrolysis
- Coal Gasification & Auto Thermal Reforming (ATR)
By End Use Application
- Chemicals
- Fertilizers
- Transportation & Mobility
- Power & Energy Storage
- Others
Driver Analysis
Subsidy-backed project bankability
The most immediate growth driver in 2026 is the conversion of announced hydrogen capacity into financeable projects through direct production support, auction mechanisms, and tax-credit clarity. The EU Hydrogen Bank has moved beyond signaling into funded award cycles: the first auction awarded nearly €720 million to 7 projects, the second auction selected 15 projects from 61 bids with fixed-premium support, and the third auction in 2025–2026 awarded over €1 billion to 9 projects expected to provide almost 1.1 GW of electrolyzer capacity and more than 1.3 million tonnes of hydrogen over their first 10 years, while Spain and Germany added another €1.7 billion through national funding channels.
In parallel, the US finalized Section 45V rules in January 2025, preserving a measurable emissions-based incentive structure with a statutory ceiling of 4 kg CO2e per kg of hydrogen for qualification, which matters because large projects cannot reach final investment decision without a settled accounting framework for power sourcing and lifecycle emissions.
Drivers Impact Analysis
| Driver | (~) % Impact on CAGR Forecast | Geographic Relevance | Impact Timeline |
|---|---|---|---|
| Subsidy-backed project bankability | +2.4% | EU core, US core, APAC selective | Short term (≤ 2 years) |
| Electrolyzer cost compression and China-led manufacturing scale | +2.1% | China core, EU, Middle East, India, Latin America spill-over | Medium term (2-4 years) |
| Industrial decarbonization pull from ammonia, refining, steel | +1.9% | EU, China, Middle East, North America, Japan-Korea import corridor | Medium term (2-4 years) |
| Certification, carbon accounting, and emissions-threshold clarity | +1.4% | US, EU, UK-aligned markets, export-oriented APAC | Short term (≤ 2 years) |
| Hydrogen derivatives and cross-border trade build-out | +1.7% | Middle East, North Africa, Australia, Chile, EU import markets, Japan, South Korea | Long term (≥ 4 years) |
| Grid-linked flexibility and renewable curtailment capture | +1.3% | China, Iberia, Nordics, India, Australia, US renewables belts | Medium term (2-4 years) |
Restraint Analysis
Cost gap vs grey hydrogen
The largest restraint in 2026 remains simple unit economics: even after subsidy support, renewable hydrogen in many markets still struggles to compete with incumbent grey hydrogen because electricity, utilization, and balance-of-plant costs remain too high relative to feedstock-based production; published 2025 references place green hydrogen broadly around $3.50–$6.00/kg in many current cases, with parity typically requiring renewable electricity below roughly $20–$30/MWh, while IRENA continues to describe renewable hydrogen as roughly two to three times more expensive than fossil references under typical long-term fossil price assumptions, and Germany-focused 2025 cost work places renewable electrolytic hydrogen above 7.50 EUR/kg against 3.50–4.50 EUR/kg for steam reforming, creating a spread that can exceed 70%–100% before transport and storage are added.
That spread destroys merchant demand, forces developers into subsidy-maximizing rather than market-clearing behavior, raises minimum offtake price floors, and delays CapEx sanctioning because projects with 4,000–6,000 annual full-load hours often still miss target IRRs unless they secure both low-cost power and long-duration incentive support, so the commercial model remains dependent on policy rather than self-sustaining cost competitiveness.
Restraint Impact Analysis
| Restraint | (~) % Impact on CAGR Forecast | Geographic Relevance | Impact Timeline |
|---|---|---|---|
| Cost gap vs grey hydrogen | -2.8% | EU core, North America core, Japan-Korea, India | Short term (≤ 2 years) |
| Low FID conversion | -2.3% | Global, especially EU and North America | Short term (≤ 2 years) |
| Infrastructure deficit | -1.9% | EU corridors, North America, Middle East export hubs, APAC import routes | Medium term (2-4 years) |
| Accounting and certification friction | -1.5% | US core, EU core, export-oriented APAC | Medium term (2-4 years) |
| Weak end-use demand uptake | -1.7% | Europe, North America, Japan-Korea, selected APAC | Short term (≤ 2 years) |
| Water and power-site constraints | -1.2% | India, Middle East, Australia, China, Iberia, Chile | Medium term (2-4 years) |
Opportunity Analysis
Derivatives-led export platforms
The World Bank’s hydrogen trade work indicates emerging markets may need to supply roughly half of global clean hydrogen output by 2030, equal to around 20 Mt/year, while clean ammonia projects under development in emerging markets alone account for well over 100 Mt of capacity and global hydrogen-derivative demand from ammonia, methanol, steel, and aviation fuel could dominate 2030 demand formation, meaning exporters that lock in derivative-capable hubs can capture margin across multiple nodes rather than only the electrolyzer gate.
The strategic upside comes from converting stranded renewable resource zones into export platforms with 2–3 monetization layers hydrogen production, derivative synthesis, and logistics intermediation—which can raise realized revenue per tonne-equivalent by an estimated 20%–35% versus merchant hydrogen sales and enlarge serviceable obtainable market beyond local offtake constraints, especially for Middle East, North Africa, Chile, and Australia projects targeting Europe and Northeast Asia.
Opportunity Impact Analysis
| Opportunity | (~) % Potential CAGR Upside | Geographic Relevance | Execution Window |
|---|---|---|---|
| Derivatives-led export platforms | +2.6% | Middle East, North Africa, Australia, Chile, EU import hubs, Japan-Korea | Medium term (2-4 years) |
| eSAF and shipping fuel integration | +2.1% | EU core, North America, Middle East, Singapore corridors | Medium term (2-4 years) |
| Green steel cluster capture | +1.9% | EU, India, Middle East, North America, Australia | Medium term (2-4 years) |
| Electrolyzer-as-a-service models | +1.6% | North America, EU, India, Southeast Asia | Short term (≤ 2 years) |
| Hydrogen market aggregation platforms | +1.4% | EU core, Northeast Asia, export-oriented APAC | Short term (≤ 2 years) |
| Distressed asset and M&A roll-ups | +1.8% | Europe, North America, selected APAC | Short term (≤ 2 years) |
Challenges Analysis
Critical materials exposure
Electrolyzer scale-up is being challenged by upstream dependence on platinum-group metals and other specialized inputs, particularly in PEM systems where iridium and platinum availability can create procurement bottlenecks, pricing volatility, and design trade-offs even if nominal nameplate manufacturing capacity looks sufficient; 2025 supply-chain analysis explicitly identifies rare materials such as platinum and iridium as scalability constraints, and the problem is not simply raw availability but concentration risk, long refining cycles, and the fact that catalyst loading reductions often require parallel engineering changes that can affect durability, stack life, and maintenance intervals.
The operational impact is a persistent risk of BOM inflation, supplier concentration, and delayed stack deliveries for high-specification projects, forcing OEMs to dual-source, redesign around lower-load catalysts, or maintain strategic inventory buffers that tie up working capital and can add several percentage points to system cost if spot procurement replaces planned sourcing.
Challenges Impact Analysis
| Challenge | (~) % CAGR Friction Drag | Geographic Relevance | Mitigation Horizon |
|---|---|---|---|
| Critical materials exposure | -1.3% | EU, North America, India, Japan-Korea | Medium term (2-4 years) |
| Grid queue congestion | -1.6% | North America core, EU regulatory hubs, India, Australia | Medium term (2-4 years) |
| Safety code fragmentation | -1.1% | Global, especially EU, India, APAC logistics corridors | Medium term (2-4 years) |
| Storage network mismatch | -1.4% | EU corridors, North America, Middle East hubs | Long term (≥ 4 years) |
| Hydrogen skills shortage | -0.9% | India, EU, North America, Middle East | Medium term (2-4 years) |
| System integration complexity | -1.2% | Global project markets | Short term (≤ 2 years) |
Geopolitical Impact Analysis
Middle East Conflict Reshapes Hydrogen Supply Chains and Increases Energy Security Focus.
The ongoing conflict in the Middle East has increased uncertainty across the global Hydrogen Market by disrupting energy trade routes, raising natural gas price volatility, and affecting the movement of hydrogen-related products such as ammonia, methanol, and refined fuels.
- According to the International Energy Agency (IEA), the Middle East accounts for around one-sixth of global hydrogen production, while the region represents more than 10% of global refining capacity, close to 17% of methanol production, and over one-quarter of global ammonia trade.
The IEA also reported in 2026 that several refineries and petrochemical facilities in the region have reduced or halted operations because of supply disruptions and damage to infrastructure, limiting the availability of hydrogen-based products in international markets. These conditions have increased operational uncertainty for industries that depend on stable hydrogen supplies, particularly fertilizer, refining, and chemical manufacturers.
The conflict has also highlighted the importance of secure energy transportation. The IEA states that around 20 million barrels per day of oil and oil products moved through the Strait of Hormuz in 2025, representing around 25% of global seaborne oil trade, while about 19% of global LNG trade also passed through the same route. Any disruption affects natural gas availability, a key feedstock for conventional hydrogen production, and increases production costs in many importing countries.
Regional Analysis
Hydrogen Market – Regional Segmental Analysis: Asia Pacific.
Asia Pacific dominates the global hydrogen market, holding an estimated 35.00% share valued at USD 80.18 billion. This dominance is underpinned by China’s outsized role across the hydrogen value chain. According to the International Energy Agency (IEA), China accounts for almost 95% of the world’s fuel cell commercial vehicle stock, reflecting the region’s lead in road transport applications.
China also holds 65% of global installed water electrolysis capacity and a similar share of capacity that has reached final investment decision, positioning it as the primary driver of regional hydrogen production growth. Elsewhere in the region, Japan and Korea remain the most active markets for hydrogen use in the power sector, with policy support helping first-mover projects advance and build on lessons from earlier support programmes.
Southeast Asia further reinforces Asia Pacific’s regional weight, with hydrogen demand reaching 4 million tonnes per annum (Mtpa) in 2024, led by Indonesia, which accounted for 35% of subregional demand, followed by Malaysia, Viet Nam, and Singapore. This concentration of demand, production capacity, and vehicle deployment across China, Japan, Korea, and Southeast Asia collectively explains Asia Pacific’s dominant regional position within the global hydrogen market, distinguishing it from other regions where hydrogen activity remains more fragmented across policy, production, and end-use segments.
Key Regions and Countries Covered
- North America
- The US
- Canada
- Europe
- Germany
- France
- The UK
- Spain
- Italy
- Russia & CIS
- Rest of Europe
- APAC
- China
- Japan
- South Korea
- India
- ASEAN
- Rest of APAC
- Latin America
- Brazil
- Mexico
- Rest of Latin America
- Middle East & Africa
- GCC
- South Africa
- Rest of MEA
Key Players Analysis
Hydrogen market participants focus on expanding production capacity, improving technology efficiency, and building integrated value chains to strengthen their competitive position. A major priority is increasing the availability of low-emission hydrogen through investments in advanced electrolysis systems, carbon capture integration for hydrogen production, and large-scale infrastructure development.
Strategic partnerships with renewable energy developers, industrial gas suppliers, and manufacturing companies help secure long-term hydrogen demand while supporting project execution. Many producers also invest in hydrogen storage, transportation, and refueling infrastructure to create complete hydrogen ecosystems that improve supply reliability and customer access.
Leading companies including Linde plc, Air Liquide S.A., Air Products and Chemicals, Inc., Shell plc, Chart Industries, Inc., Siemens Energy AG, ENGIE S.A., BP p.l.c., Plug Power Inc., Cummins Inc. through its Accelera business, Nel ASA, ITM Power plc, thyssenkrupp nucera AG & Co. KGaA, Sinopec Corp., and Ballard Power Systems Inc. continue to strengthen their market presence through large-scale hydrogen projects, technology development, and strategic collaborations.
These companies emphasize expanding electrolyzer manufacturing capacity, developing integrated hydrogen production facilities, and supporting industrial decarburization across refining, chemicals, transportation, and power applications. Long-term supply agreements, joint ventures, research partnerships, and investments in clean hydrogen infrastructure remain central to their growth strategies.
Market Key Players
- Linde plc
- Air Liquide S.A.
- Air Products and Chemicals, Inc.
- Shell plc
- Chart Industries, Inc.
- Siemens Energy AG
- ENGIE S.A.
- BP p.l.c.
- Plug Power Inc.
- Cummins Inc. / Accelera
- Nel ASA
- ITM Power plc
- thyssenkrupp nucera AG & Co. KGaA
- Sinopec Corp.
- Ballard Power Systems Inc.
Key Development
- In February 2025, Air Liquide announced two large-scale electrolyzer projects in collaboration with TotalEnergies to produce renewable and low-carbon hydrogen in Europe. The ELYgator project, a 200 MW electrolyzer in Rotterdam, is designed to produce up to 23,000 tons of hydrogen annually, while a new 50/50 joint venture will develop a 250 MW electrolyzer in Zeeland with a targeted output of 30,000 tons annually. Combined, the two projects represent an investment of more than EUR 1 billion and are expected to avoid up to 500,000 tonnes of CO2-equivalent emissions per year.
- In November 2025, Nel ASA received a firm purchase order from the HyFuel and Kaupanes hydrogen projects in Norway, valued at more than USD 50 million. Each project has a capacity of 20 megawatts (MW), totaling 40 MW, based on Nel’s MC 500 containerized proton exchange membrane (PEM) systems. The company described it as the second-largest firm purchase order it has ever received and its largest order to date for PEM equipment.
- In January 2026, Plug Power completed the installation of 100 megawatts (MW) of PEM GenEco electrolyzers at Galp’s Sines Refinery in Portugal. Once commissioned, the system is projected to produce up to 15,000 tons of renewable hydrogen annually, replacing approximately 20% of the refinery’s grey hydrogen use and reducing greenhouse gas emissions by 110,000 tons per year.
Report Scope
| Report Features | Description |
|---|---|
| Market Value (2025) | USD 229.1 Bn |
| Forecast Revenue (2035) | USD 436.8 Bn |
| CAGR (2026 2035) | 6.7% |
| Base Year for Estimation | 2025 |
| Historic Period | 2020-2024 |
| Forecast Period | 2026-2035 |
| Report Coverage | Revenue Forecast, Market Dynamics, Competitive Landscape, Recent Developments |
| Segments Covered | By Hydrogen Type (Grey Hydrogen, Blue Hydrogen, Green Hydrogen, Brown/Black Hydrogen, Turquoise Hydrogen, Orange Hydrogen, Others), By Production Technology (Steam Methane Reforming, Electrolysis, Coal Gasification & Auto Thermal Reforming (ATR)), By End Use Application (Chemicals, Fertilizers, Transportation & Mobility, Power & Energy Storage, Others) |
| Regional Analysis | North America The US & Canada; Europe Germany, France, The UK, Spain, Italy, Russia & CIS, Rest of Europe; APAC China, Japan, South Korea, India, ASEAN & Rest of APAC; Latin America Brazil, Mexico & Rest of Latin America; Middle East & Africa GCC, South Africa, & Rest of MEA |
| Competitive Landscape | Linde plc, Air Liquide S.A., Air Products and Chemicals, Inc., Shell plc, Chart Industries, Inc., Siemens Energy AG, ENGIE S.A., BP p.l.c., Plug Power Inc., Cummins Inc. / Accelera, Nel ASA, ITM Power plc, thyssenkrupp nucera AG & Co. KGaA, Sinopec Corp., and Ballard Power Systems Inc. |
| Customization Scope | Customization for segments, region/country level will be provided. Moreover, additional customization can be done based on the requirements. |
| Purchase Options | We have three licenses to opt for: Single User License, Multi User License (Up to 5 Users), Corporate Use License (Unlimited Users and Printable PDF) |





































