


Report Overview
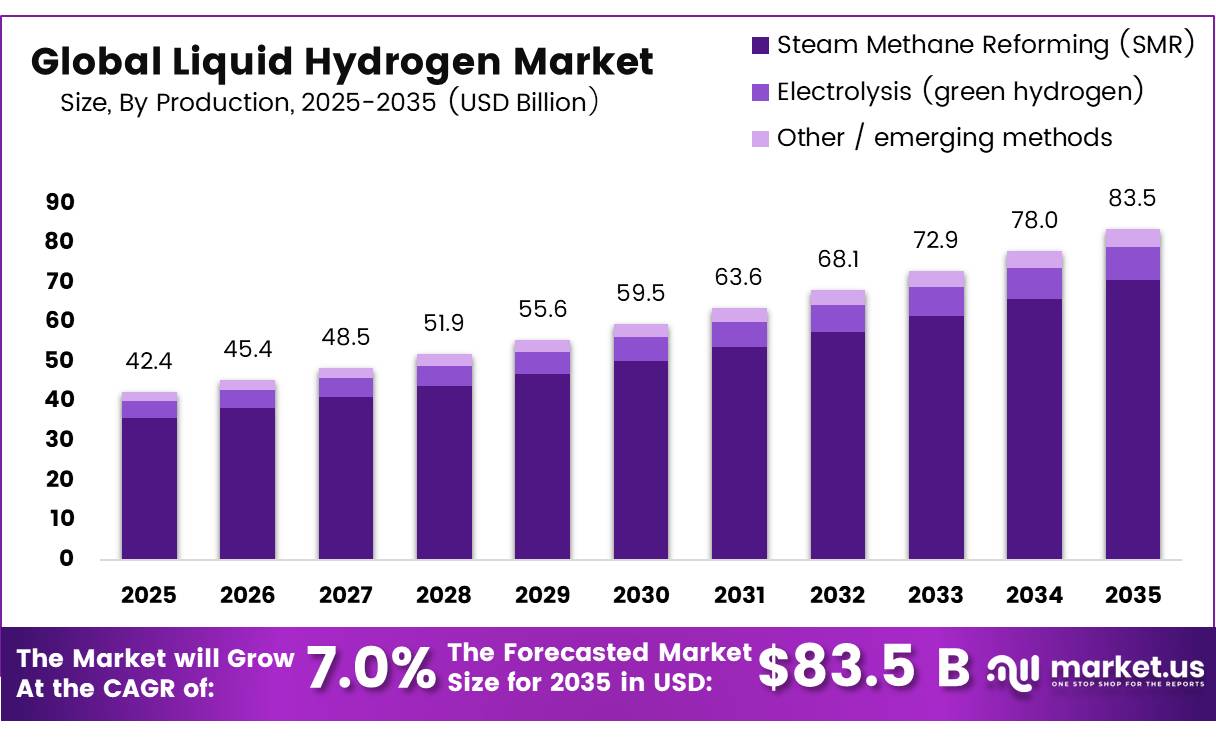
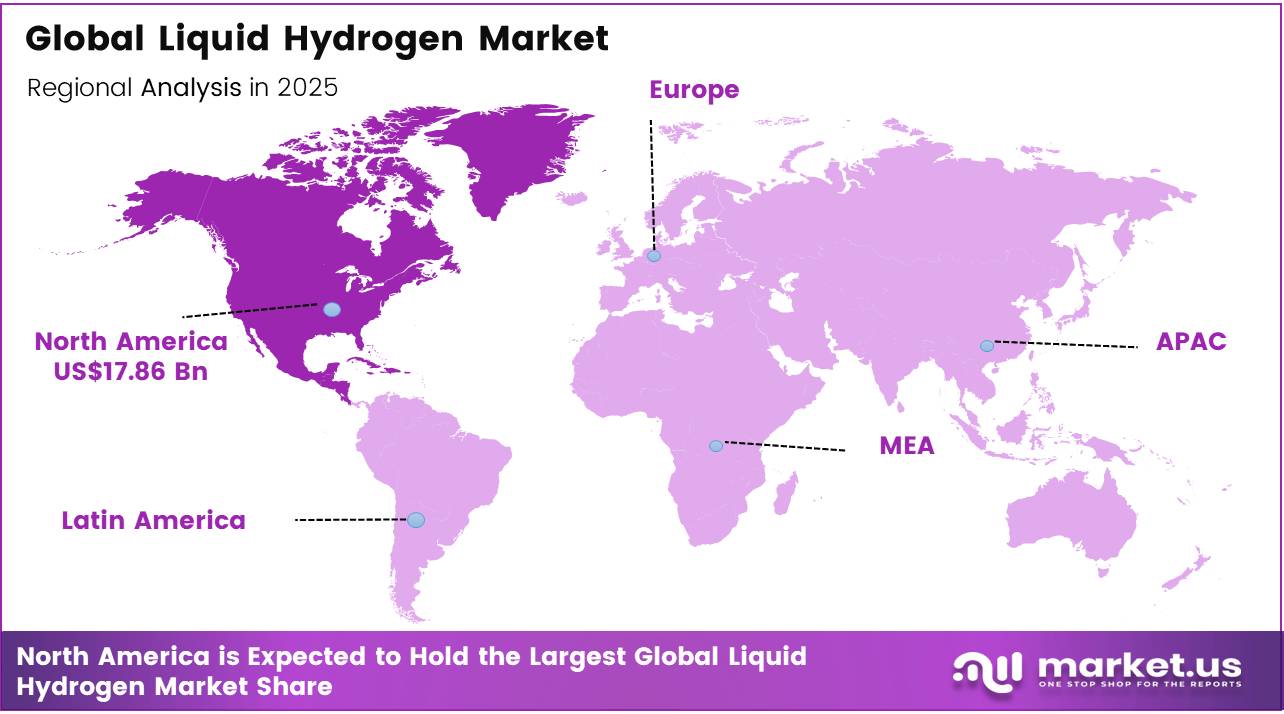
In 2025, the Global Liquid Hydrogen Market was valued at USD 42.4 billion, and between 2026 and 2035, this market is estimated to register a CAGR of 7.0%, reaching about USD 83.5 billion by 2035. In 2025, North America held a dominant market position, capturing more than a 42.1% share, holding USD 17.86 Billion revenue.
Liquid hydrogen is hydrogen cooled below −253°C and stored as a cryogenic liquid for bulk transportation and high-energy applications. It is used in space propulsion, mobility, industrial energy systems and emerging maritime and aviation fuel chains. Compared with compressed gas, it enables larger hydrogen loads in road tankers.
- The U.S. Department of Energy states that current liquefaction technology consumes more than 30% of hydrogen’s energy content. Storage requires insulated vessels operating at no more than 5 bar, while boil-off control remains a major engineering challenge.
- It must be cooled below minus 253 degrees Celsius, while hydrogen provides 120 megajoules per kilogram compared with 44 megajoules per kilogram for gasoline. This combination supports high-performance applications but demands specialised liquefiers, insulated tanks and transfer equipment.
The industrial scenario remains early but increasingly strategic as refiners, ammonia producers, transport operators and space agencies examine lower-emission hydrogen supply chains. Global hydrogen demand recently surpassed 100 million tonnes, low-emissions production increased by 20%, and output approached 1 million tonnes. Liquid hydrogen can extend distribution reach, although boil-off, complex handling and liquefaction costs continue to constrain broader commercial deployment.
Future growth will depend on larger liquefaction plants, improved insulation, reliable offtake and coordinated production-to-user infrastructure. The United States committed up to USD 7 billion for 7 regional clean hydrogen hubs, while the European Hydrogen Bank offered EUR 1.2 billion through its renewable-hydrogen auction. These initiatives strengthen commercial opportunities in aviation, maritime transport, industrial heat, renewable-energy storage and broader international hydrogen trade.
Key Takeaways
- The global Liquid Hydrogen market was valued at USD 42.4 billion in 2025.
- The global market is projected to grow at a CAGR of 7.0% and is estimated to reach USD 83.5 billion by 2035.
- On the basis of production, the Steam Methane Reforming (SMR) dominated the market, constituting 84.5% of the total market share.
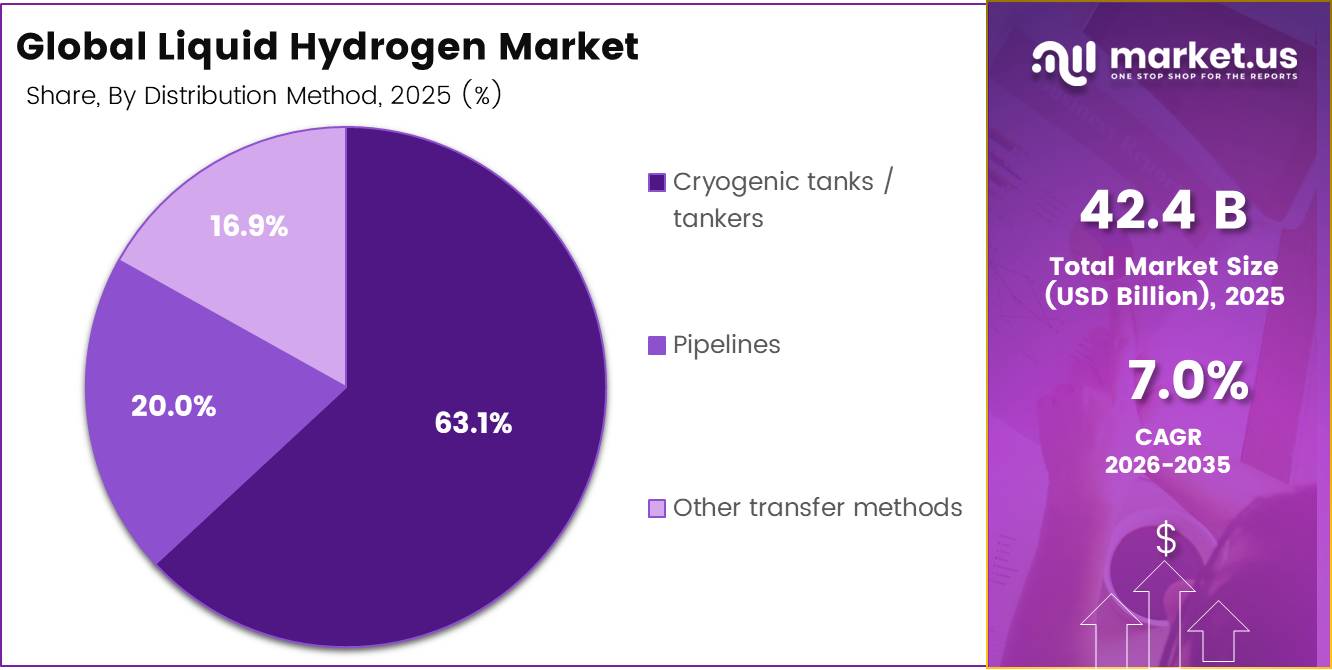
- Based on the Distribution Method, the Cryogenic tanks / tankers dominated the Liquid Hydrogen market, with a substantial market share of around 63.1%.
- Based on the End-use Industry, Aerospace / Space Launch led the market, comprising 70.2% of the total market.
- Among the Application, the Mobility fuel held a major share in the Liquid Hydrogen market, 45.6% of the market share.
- Among the Type, the Merchant liquid hydrogen is the most considerable within the market, accounting for around 55.1% of the revenue.
- In 2025, the North America was the most dominant region in the Liquid Hydrogen market, accounting for 42.1% of the total global consumption.
Production Analysis
Steam Methane Reforming (SMR) represents dominant Segment in the Market.
Steam methane reforming (SMR) leads the liquid hydrogen production market with an 84.5% share, supported by mature facilities, established natural-gas infrastructure and dependable large-scale output. During SMR, methane reacts with steam at 700°C–1,000°C under pressures of 3–25 bar. The U.S. Department of Energy states that natural-gas reforming supplies around 95% of hydrogen produced in the United States, explaining its strong use in refineries, ammonia plants and other high-volume industries. Its cost advantage and operational familiarity continue to support demand, although carbon emissions remain a major concern.
Electrolysis is the growing production segment because it separates water into hydrogen and oxygen using electricity, allowing producers to use renewable or nuclear power. For PEM electrolysis, the Department of Energy’s 2026 targets include energy consumption of 51 kWh per kilogram, an uninstalled system cost of USD 250 per kW, and a hydrogen production cost of USD 2 per kilogram. Future growth will depend on cheaper clean electricity, improved electrolyzer durability and larger projects connected with storage, transport and industrial users.
Distribution Method Analysis
Cryogenic tanks / tankers is significant Distribution Method.
Cryogenic tanks and tankers lead the liquid hydrogen distribution market with a 63.1% share, supported by their ability to move bulk hydrogen to aerospace, industrial and remote locations without pipeline access. NASA’s newer storage tank can hold 1.25 million gallons, making it 50% larger than its earlier tanks. NASA also reports that glass-bubble insulation can reduce liquid-hydrogen boil-off losses by up to 46%, improving storage reliability and lowering product losses during distribution.
Pipelines are the growing distribution method because they can provide stable, continuous hydrogen supplies to concentrated chemical and refining clusters. The U.S. Department of Energy allocated USD 1.5 million to research hydrogen-compatible pipeline steels, supported by USD 375,000 in additional funding. The project has a total value of USD 1.875 million and evaluates pipeline grades ranging from X52 to X80, helping address embrittlement, strength and long-term infrastructure safety.
End-Use Industry Analysis
Aerospace / Space Launch Separators Are the Most Widely Used Separators.
Aerospace and space launch lead the liquid hydrogen application market with a 70.2% share, driven by its high energy per unit of weight and suitability for powerful cryogenic rocket engines. NASA’s Space Launch System core stage carries 537,000 gallons of liquid hydrogen to feed its engines during launch. The stage operates for approximately 500 seconds before separating near low-Earth orbit.
Automotive and transportation represent the growing application segment as hydrogen gains attention for buses, trucks and long-distance vehicles that need quick refuelling. U.S. government data show that 54 public retail hydrogen stations operated in California in 2024, with 1 additional station in Hawaii and more than 20 California stations under construction or planning. Wider station availability and dependable hydrogen deliveries could gradually create opportunities for liquid hydrogen in high-volume transport corridors
Application Analysis
Mobility fuel Held a Major Share of the Liquid Hydrogen Market.
Mobility fuel leads the liquid hydrogen application market with a 45.6% share, supported by rising interest in heavy trucks, buses, port equipment and railway systems that require longer operating ranges and rapid refuelling. In August 2024, the U.S. Department of Energy selected nearly USD 62 million for 20 hydrogen projects across 15 states. This included USD 8.5 million for four medium- and heavy-duty hydrogen-fuelling projects and USD 40 million for four standardised commercial truck stations, strengthening future liquid hydrogen demand.
Power generation and energy storage are the growing application as hydrogen can preserve surplus electricity and provide dispatchable or backup power when renewable output falls. In August 2024, the Department of Energy announced USD 8.8 million for 11 research projects developing turbines capable of using up to 100% hydrogen. In September 2024, it offered another USD 4 million for reversible solid-oxide systems supporting hydrogen storage, microgrids and electricity generation.
Type Analysis
Merchant liquid hydrogen is a significant type.
Merchant liquid hydrogen leads the market with a 55.1% share, supported by centralised production and scheduled bulk deliveries to aerospace, research and industrial facilities. This model allows customers to purchase cryogenic hydrogen without investing in dedicated liquefaction plants. In November 2025, NASA established agency-wide liquid-hydrogen supply contracts beginning on December 1, 2025, with a two-year base period and three additional one-year options extending through November 2030. The long procurement period highlights the importance of dependable merchant suppliers, tanker availability and coordinated storage infrastructure.
Renewable liquid hydrogen is the growing segment as governments support commercial green-hydrogen production that can later supply liquefaction and distribution networks. In July 2025, the UK government confirmed that 10 commercial-scale green-hydrogen projects had signed long-term contracts. These developments are expected to support more than 700 jobs across construction, engineering and operations. Greater renewable electricity availability and electrolyser deployment should gradually improve green-hydrogen supply for mobility, shipping and low-carbon industrial applications.
Key Market Segments
By Production
- Steam Methane Reforming (SMR)
- Electrolysis (green hydrogen)
- Other / emerging methods
By Distribution Method
- Cryogenic tanks / tankers
- Pipelines
- Other transfer methods
By End-use Industry
- Aerospace / Space Launch
- Automotive & Transportation
- Energy & Power
- Chemical / Industrial
- Others
By Application
- Mobility fuel
- Industrial feedstock & process use
- Power generation & energy storage / backup
- Other niche uses
By Type
- Merchant liquid hydrogen
- Captive / on-site liquefaction
- Space / aerospace‑grade LH2
- Renewable (green) liquid hydrogen
Driver Analysis
Hydrogen hub and port-cluster infrastructure scaling
The market’s second major accelerator is the concentration of production, liquefaction, storage, and end use inside regional clusters, because liquid hydrogen economics weaken quickly when utilization rates are low or distribution radii are fragmented. The U.S. Bipartisan Infrastructure Law allocated $9.5 billion for clean hydrogen initiatives, including $7 billion for seven Regional Clean Hydrogen Hubs, while DOE indicates these efforts have already catalyzed more than $40 billion in private-sector investment tied to the hub ecosystem.
Cluster logic improves liquefier loading factors, cuts trucking deadhead, and enables shared boil-off management, which can move delivered-cost curves materially even before feedstock costs decline. Strategically, this driver favors industrial gas majors, EPC firms, tank specialists, and terminal operators that can own corridor economics from production to dispensing; the value pool shifts from standalone plant margins toward integrated infrastructure returns anchored in port, steel, refining, mobility, and backup-power demand concentrated in the same geography.
Drivers Impact Analysis
| Driver | (~) % Impact on CAGR Forecast | Geographic Relevance | Impact Timeline |
|---|---|---|---|
| Heavy-transport and aerospace fueling build-out | +1.8% | North America core, EU, Japan, South Korea, Gulf hubs | Short term (≤ 2 years) |
| Hydrogen hub and port-cluster infrastructure scaling | +1.5% | U.S. hubs, Rotterdam-North Sea corridor, Middle East export corridors, East Asia import nodes | Medium term (2-4 years) |
| Electrolyzer cost compression and manufacturing scale-up | +1.4% | China cost anchor, U.S., EU, India spill-over | Medium term (2-4 years) |
| EU RFNBO compliance and industrial decarbonization mandates | +1.2% | EU core, North Africa-to-EU trade lanes, Norway, UK spill-over | Short term (≤ 2 years) |
| Safety-code modernization reducing station and storage capex | +0.9% | North America core, EU, advanced APAC markets | Short term (≤ 2 years) |
| Long-distance trade economics for liquid hydrogen and derivatives | +1.1% | Australia/Japan, Middle East/Europe, Korea, Singapore and maritime corridors | Long term (≥ 4 years) |
Restraint Analysis
High cost of clean LH₂ supply
The most immediate brake on liquid hydrogen adoption is the still-elevated cost of low-emission hydrogen at the plant gate, which compresses margins and delays investment decisions even before liquefaction and logistics costs are considered, because green hydrogen produced via electrolysis typically sits in a cost band comparable to or above $3–$5 per kg in many markets while gray hydrogen remains near the $1–$2 per kg range in the techno-economic literature, creating a 50–200% premium that customers must absorb to decarbonize.
Electrolysis efficiency is often cited around 60–70%, meaning roughly 1.4–1.7 units of electricity are required per unit of hydrogen energy, and this amplifies exposure to volatile power prices, especially in Europe where wholesale electricity can oscillate between tens and hundreds of euros per MWh during tight periods. When liquefaction energy demand and boil-off losses are added, the delivered cost of liquid hydrogen can rise by an additional 1–2 €/kg equivalent in early-stage projects, unless plants achieve high utilization factors and access very cheap renewable power.
Restraint Impact Analysis
| Restraint | (~) % Impact on CAGR Forecast | Geographic Relevance | Impact Timeline |
|---|---|---|---|
| High cost of clean LH₂ supply | -2.3% | North America core, EU, APAC corridors | Medium term (2-4 years) |
| Liquefaction & storage capex intensity | -1.9% | North America, EU, Japan, Korea | Long term (≥ 4 years) |
| Infrastructure gaps & station density | -1.7% | North America corridors, EU, China | Short term (≤ 2 years) |
| Policy fragmentation & regulatory uncertainty | -1.5% | Global, esp. EU, U.S., emerging markets | Medium term (2-4 years) |
| Critical materials & equipment bottlenecks | -1.4% | Global manufacturing, APAC supply chains | Medium term (2-4 years) |
| Safety, public acceptance, and permitting drag | -1.1% | North America, EU, urban/APAC hubs | Long term (≥ 4 years) |
Opportunity Analysis
Aviation and long-haul mobility LH₂ platforms
Current forecasts mostly bake in modest fuel-cell truck and bus deployment and limited aerospace prototypes, but a scenario where 5–10% of new narrow-body aircraft orders post-2030 are LH₂-ready, combined with thousands of heavy-duty trucks and buses on dedicated LH₂ corridors, could easily translate into multi-million-ton annual demand beyond today’s baselines, particularly in EU, UK, North America, Japan, and Korea where aviation and logistics emissions are under regulatory pressure.
Strategically, this is an opportunity rather than a driver because aircraft certification, airport retrofit economics, and OEM platform decisions are still unresolved; capturing it requires coordinated CapEx into airport-side liquefaction and storage, OEM partnerships to co-develop LH₂ propulsion architectures, and new long-term fuel supply contracts that lock in margin-positive pricing structures, potentially supporting EBITDA margins 200–400 basis points above commodity hydrogen sales due to the mission-critical nature of aviation fuel.
Opportunity Impact Analysis
| Opportunity | (~) % Potential CAGR Upside | Geographic Relevance | Execution Window |
|---|---|---|---|
| Aviation and long-haul mobility LH₂ platforms | +2.4% | EU, UK, North America, Japan, Korea | Medium term (2-4 years) |
| LH₂-based grid balancing and backup power | +2.0% | North America, EU, APAC urban hubs | Medium term (2-4 years) |
| Port-centric LH₂ bunkering and maritime fuels | +2.2% | Global ports, EU, Middle East, East Asia | Long term (≥ 4 years) |
| Cryogenic IP licensing and storage technology platforms | +1.7% | Global OEMs, EU, Japan, Korea | Short term (≤ 2 years) |
| Cross-border LH₂ trade hubs and financial structuring | +1.9% | Middle East, Australia, EU, Japan, Korea | Long term (≥ 4 years) |
| Integrated LH₂-as-a-service and mobility subscription models | +1.6% | North America corridors, EU, China, Japan | Medium term (2-4 years) |
Challenges Analysis
Project slippage and execution risk
Industry commentary notes that hydrogen deployment is “stuck in the pilot phase,” with numerous projects cancelled or delayed and executives ranking costs and weak demand as main bottlenecks for viable business cases; this translates into schedule overruns of 6–24 months for many large projects relative to initial FIDs.
Strategically, these frictions require corporates to build in higher contingency budgets, stage investments in smaller tranches, adopt more flexible EPC contracting, and maintain dynamic portfolio management to keep risk-adjusted returns acceptable, collectively shaving around 1–1.5 percentage points off maximum attainable CAGR but not freezing sales.
Challenges Impact Analysis
| Challenge | (~) % CAGR Friction Drag | Geographic Relevance | Mitigation Horizon |
|---|---|---|---|
| Project slippage and execution risk | -1.4% | North America core, EU regulatory hubs | Medium term (2-4 years) |
| Demand uncertainty and off-take volatility | -1.2% | EU, UK, North America, APAC | Medium term (2-4 years) |
| Talent and specialist skills deficit | -1.0% | Global, esp. EU and North America | Long term (≥ 4 years) |
| Complex multi-node supply chain coordination | -1.1% | APAC logistics corridors, global trade routes | Medium term (2-4 years) |
| Capital intensity and cost overrun risk | -1.3% | Global large-scale projects | Long term (≥ 4 years) |
| Policy complexity and planning delays | -1.0% | EU regulatory hubs, UK, North America | Medium term (2-4 years) |
Geopolitical Impact Analysis
Geopolitical Funding Alliances Reshaping Liquid Hydrogen Supply Chains.
Europe is directing hydrogen investment toward regional infrastructure to improve energy security and reduce dependence on imported natural gas. In February 2024, the European Commission approved up to EUR 6.9 billion of public support from 7 member states, expected to mobilise EUR 5.4 billion in additional investment. The programme includes about 2,700 kilometres of hydrogen pipelines, at least 370 GWh of storage and terminals designed to handle 6,000 tonnes annually. This scale could attract hydrogen equipment, skilled labour and production capacity toward supported European clusters.
The United Kingdom is following a more nationally focused approach. In June 2025, the government committed over GBP 500 million to its first regional hydrogen transport and storage network, which is planned to operate from 2031. Separately, 27 electrolytic hydrogen projects were shortlisted in April 2025. These policies could strengthen domestic supply, but differing subsidies, certification requirements and infrastructure schedules may make cross-border liquid-hydrogen trade more complicated and costly.
Regional Analysis
North America Held the Largest Share of the Global Liquid Hydrogen Market.
North America leads the liquid hydrogen market with a 42.1% share, supported by established aerospace demand, industrial hydrogen networks and expanding clean-production capacity. In March 2024, the U.S. Department of Energy announced USD 750 million for 52 hydrogen projects across 24 states. The programme is expected to create more than 1,500 direct jobs while strengthening electrolyser manufacturing, component recycling and domestic supply. This wider production base can improve hydrogen availability for liquefaction, cryogenic storage and bulk distribution.
Asia Pacific is the growing regional market as governments connect renewable hydrogen production with shipping, heavy industry and export infrastructure. Australia’s 2024 National Hydrogen Strategy reported that the country represented 20% of announced hydrogen projects worldwide. By May 2026, its Hydrogen Headstart programme offered up to AUD 2.25 billion, including AUD 1 billion for the second funding round. These measures can encourage larger production hubs, cryogenic terminals and future liquid-hydrogen trade routes.
Key Regions and Countries Covered
- North America
- The US
- Canada
- Europe
- Germany
- France
- The UK
- Spain
- Italy
- Russia & CIS
- Rest of Europe
- APAC
- China
- Japan
- South Korea
- India
- ASEAN
- Rest of APAC
- Latin America
- Brazil
- Mexico
- Rest of Latin America
- Middle East & Africa
- GCC
- South Africa
- Rest of MEA
Key Players Analysis
Liquid hydrogen producers focus on improving liquefaction efficiency, cryogenic handling, and supply-chain reliability to remain competitive. A key priority is continuous technology development, including advanced liquefiers, high-performance insulation, and low-loss storage systems that reduce energy consumption and control boil-off during transport and long-term storage. Companies also invest in larger production facilities, as higher-capacity plants can improve operating economics and support growing demand from aerospace, mobility, power, and industrial users.
Integration with renewable electricity suppliers, hydrogen production sites, storage terminals, and transport operators helps strengthen supply security and reduce logistical disruptions. Strategic infrastructure expansion near ports, launch facilities, industrial clusters, and major transport corridors enables closer alignment with concentrated demand.
In addition, producers emphasise safety engineering, automation, equipment standardisation, and regulatory compliance to maintain consistent cryogenic operations. Long-term supply agreements with space agencies, fuel distributors, industrial customers, and transport operators further improve revenue visibility, strengthen customer relationships, and support positioning in high-value liquid hydrogen applications.
The Major Players In The Industry
- Linde plc
- Air Liquide S.A.
- Air Products and Chemicals, Inc.
- Iwatani Corporation
- Messer Group
- ENGIE S.A.
- Cummins Inc
- Plug Power Inc.
- Ballard Power Systems Inc.
- FuelCell Energy, Inc.
- Bloom Energy
- Kawasaki Heavy Industries, Ltd
- Shell plc
- Saudi Arabian Oil Co.
- Nel ASA
- Others
Key Development
- In December 2025, Plug Power launched its first NASA liquid-hydrogen contract, worth up to USD 2.8 million, to supply as much as 218,000 kilograms across two research facilities, expanding its aerospace presence.
- In August 2025, Kawasaki Heavy Industries, LTD began building a 50,000-cubic-metre liquid-hydrogen tank, designed to store about 3,550 tonnes, with a 26% daily boil-off target, strengthening Japan’s commercial-scale import and distribution infrastructure.
Report Scope
| Report Features | Description |
|---|---|
| Market Value (2025) | USD 42.4 Bn |
| Forecast Revenue (2035) | USD 83.5 Bn |
| CAGR (2026-2035) | 7.0% |
| Base Year for Estimation | 2025 |
| Historic Period | 2020-2024 |
| Forecast Period | 2026-2035 |
| Report Coverage | Revenue Forecast, Market Dynamics, Competitive Landscape, Recent Developments |
| Segments Covered | By Production (Steam Methane Reforming (SMR), Electrolysis (green hydrogen) and Other / emerging methods), By Distribution Method (Cryogenic tanks / tankers, Pipelines and Other transfer methods), By End-use Industry (Aerospace / Space Launch, Automotive & Transportation, Energy & Power, Chemical / Industrial and Others), By Application (Mobility fuel, Industrial feedstock & process use, Power generation & energy storage / backup and Other niche uses), By Type (Merchant liquid hydrogen, Captive / on-site liquefaction, Space / aerospace‑grade LH2 and Renewable (green) liquid hydrogen) |
| Regional Analysis | North America – The US & Canada; Europe – Germany, France, The UK, Spain, Italy, Russia & CIS, Rest of Europe; APAC– China, Japan, South Korea, India, ASEAN & Rest of APAC; Latin America– Brazil, Mexico & Rest of Latin America; Middle East & Africa– GCC, South Africa, & Rest of MEA |
| Competitive Landscape | Linde plc, Air Liquide S.A., Air Products and Chemicals, Inc., Iwatani Corporation, Messer Group , ENGIE S.A., Cummins Inc, Plug Power Inc., Ballard Power Systems Inc., FuelCell Energy, Inc., Bloom Energy, Kawasaki Heavy Industries, Ltd, Shell plc, Saudi Arabian Oil Co., Nel ASA, Others. |
| Customization Scope | Customization for segments, region/country-level will be provided. Moreover, additional customization can be done based on the requirements. |
| Purchase Options | We have three licenses to opt for: Single User License, Multi-User License (Up to 5 Users), Corporate Use License (Unlimited Users and Printable PDF) |





































