


Report Overview
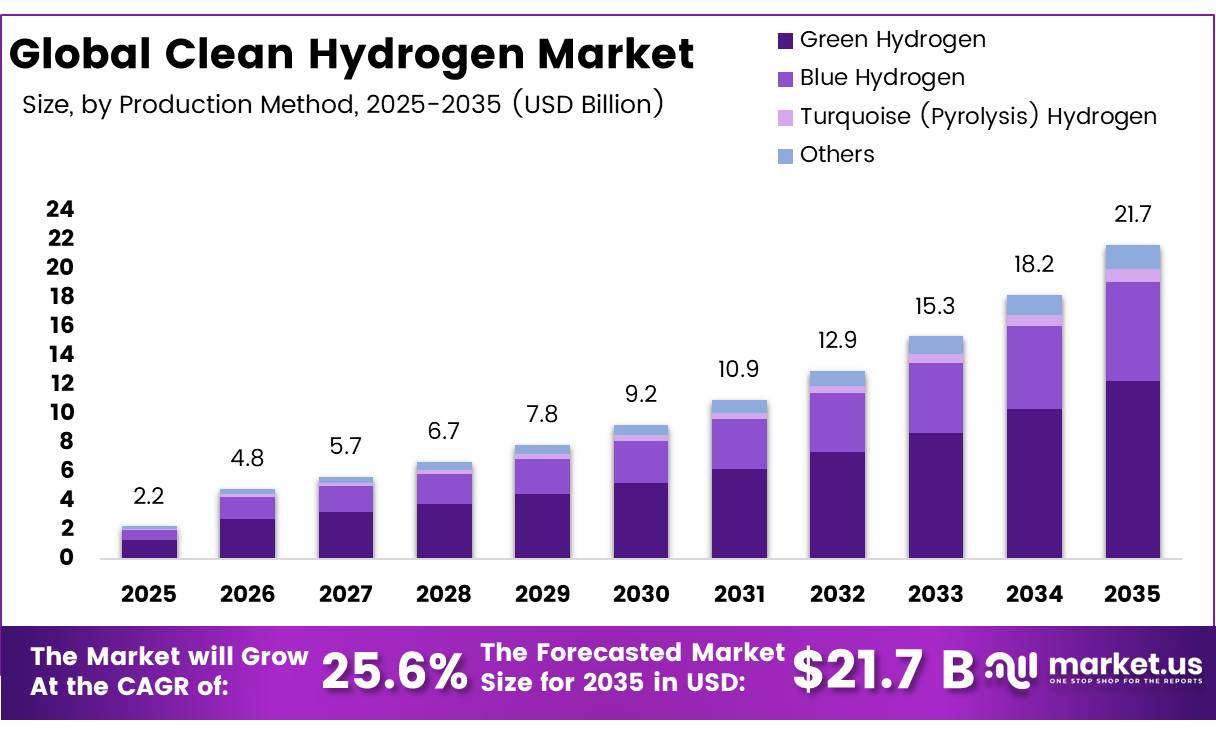
In 2025, the global clean hydrogen market was valued at USD 2.2 billion. The market is projected to grow at a CAGR of 25.6% during 2026 to 2035, reaching approximately USD 21.7 billion by 2035. In 2025, North America dominated the market, accounting for more than 34.5% of the global share and generating approximately USD 0.76 billion in revenue.
This growth is supported by increasing production capacity and strong government investments. According to the IEA Global Hydrogen Review 2025, global hydrogen demand reached nearly 100 million tonnes in 2024, but less than 1% was produced as low-emissions or clean hydrogen. This large supply gap is creating significant opportunities for market expansion.
- The IEA also estimates that announced global electrolyzer projects total approximately 520 GW by 2030. In addition, low-emissions hydrogen production is expected to reach 1 million tonnes (Mt) in 2025, representing a 10% increase over 2024. Expanding electrolyzer capacity continues to drive demand for hydrogen production systems, storage infrastructure, and renewable energy integration, supporting long-term market growth.
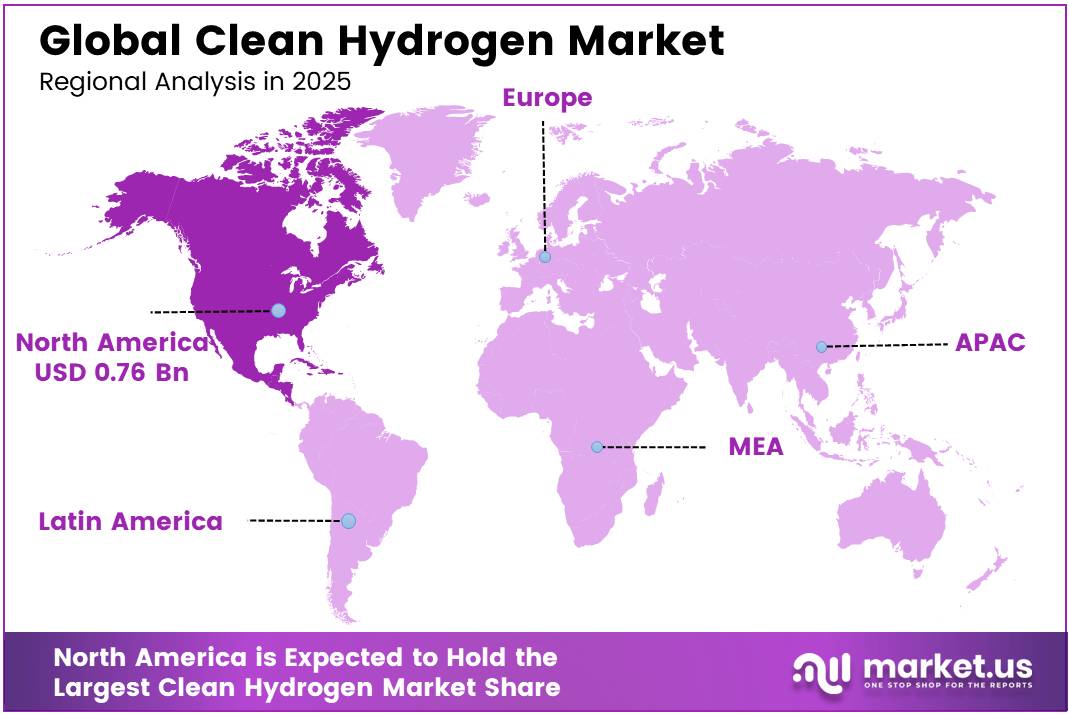
North America accounted for 34.5% of the global clean hydrogen market in 2025, generating approximately US$0.76 billion in revenue. The region’s leadership is supported by strong government policies and funding. According to the U.S. Department of Energy (DOE) National Clean Hydrogen Strategy and Roadmap, the U.S. aims to produce 10 million metric tonnes (MMT) of clean hydrogen annually by 2030, increasing to 20 MMT by 2040 and 50 MMT by 2050.
The Bipartisan Infrastructure Law allocated US$9.5 billion for clean hydrogen development, including US$1 billion for electrolysis cost reduction and US$316 million for large-scale electrolyzer manufacturing. Through the Hydrogen Energy Earthshot initiative, the DOE aims to reduce clean hydrogen production costs by 80% to US$1/kg within a decade. According to the IEA, global investment in low-emissions hydrogen reached US$8 billion in 2025, up 80% year-over-year, with North America accounting for nearly one-third of global CCUS-based hydrogen investments, further strengthening its market position.
Key Takeaways
- The global Clean Hydrogen market was valued at USD 2.2 billion in 2025.
- This market is projected to grow at a CAGR of 25.6% and is estimated to reach USD 21.7 billion by 2035.
- Green Hydrogen dominated the market, constituting 56.7% of the total market share.
- Alkaline Electrolyzers led the market, accounting for 58.0% of the global clean hydrogen market share.
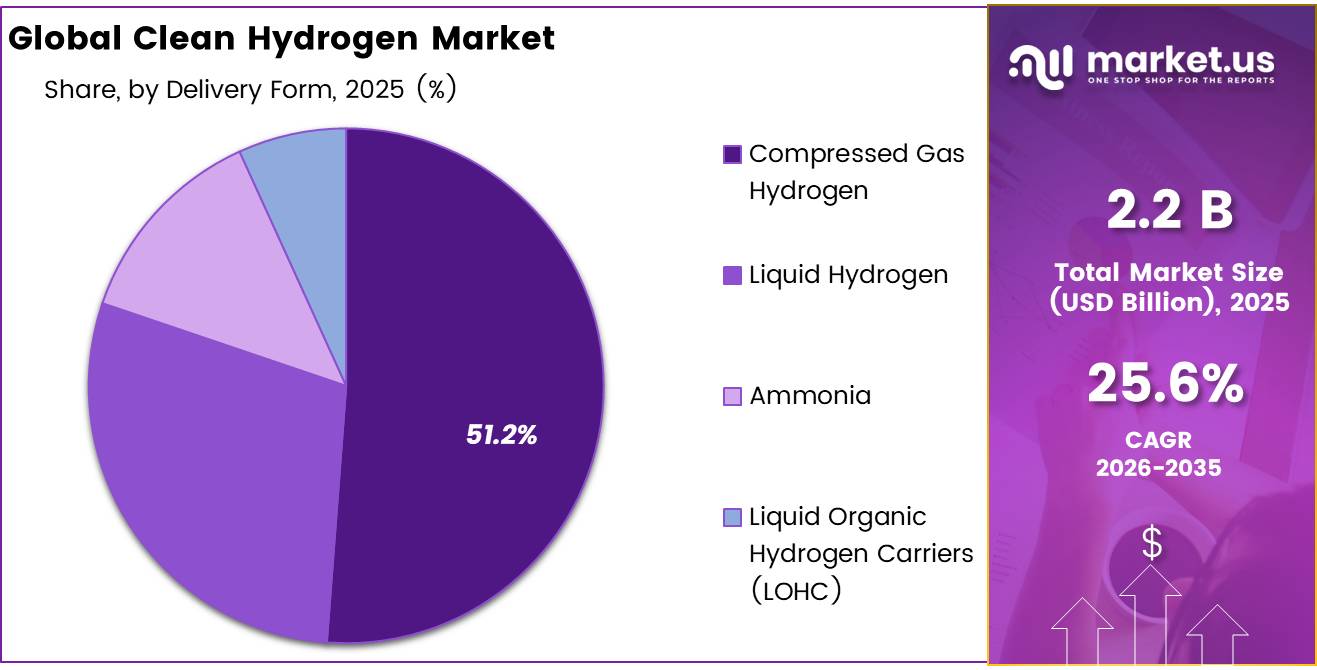
- Compressed Gas Hydrogen dominated the market, representing 51.2% of the total market share.
- Transportation held the largest share in the clean hydrogen market, accounting for 26.5% of the overall market revenue.
- In 2025, North America emerged as the dominant regional market, capturing 34.5% of the total clean hydrogen market share.
Production Method Analysis
Green hydrogen accounted for a dominant 56.7% share of the clean hydrogen market, mainly due to the sharp decline in renewable electricity costs, which are the largest expense in green hydrogen production. According to the International Renewable Energy Agency (IRENA), the global weighted average levelized cost of electricity (LCOE) from utility-scale solar PV declined by 90% between 2010 and 2024, reaching USD 0.043/kWh, making it 41% cheaper than the lowest-cost fossil fuel alternative. Onshore wind recorded an even lower LCOE of USD 0.034/kWh, which is 53% below fossil fuel generation costs. Since electricity represents the largest share of electrolysis costs, lower renewable power prices have significantly improved the commercial viability of green hydrogen production.
The rapid expansion of renewable energy capacity is further strengthening green hydrogen’s market position. IRENA reported that global renewable energy additions reached a record 582 GW in 2024, representing a 19.8% increase over 2023 and raising total installed renewable capacity to 4,443 GW. This expanding renewable power base ensures a reliable supply of low-cost, clean electricity for electrolyzers. China, which holds around 60% of global electrolyzer manufacturing capacity, achieved solar PV electricity costs as low as USD 0.033/kWh in 2024, making green hydrogen production increasingly cost competitive across Asia. As renewable capacity continues to grow and electrolyzer technologies become more efficient, green hydrogen is expected to maintain a strong cost and sustainability advantage over blue and turquoise hydrogen, supporting its leading market position through 2035.
Electrolyzer Technology Analysis
Alkaline electrolyzer a significant share of the market.
Alkaline electrolyzers held a dominant 58.0% share of the clean hydrogen market in 2025, supported by their proven performance, lower capital cost, and suitability for large-scale hydrogen production. Their leadership is reinforced by a well-established manufacturing base, the use of nickel-based electrodes instead of costly precious metals such as platinum and iridium, and lower investment requirements. According to a 2024 industry delivery analysis, alkaline electrolyzers accounted for 2.7 GW of the 3.2 GW global electrolyzer shipments, representing about 84% of total deliveries. In addition, data from John Cockerill indicates that alkaline systems consistently account for 70–90% of annual global electrolyzer shipments. The company also reports that PEM electrolyzers typically cost 15–30% more than comparable alkaline systems, making alkaline technology more attractive for large industrial projects.
The segment’s leadership is further supported by its large installed base and widespread industrial adoption. According to the World Bank (2025), global operational electrolyzer capacity reached approximately 2.15 GW by mid-2025, with alkaline electrolyzers representing the majority of installed capacity due to their durability and ability to operate continuously. China received 1.44 GW of the 3.2 GW electrolyzers shipped globally in 2024, accounting for nearly half of worldwide deliveries, with most projects using alkaline technology. The technology is widely deployed in fertilizer production, petroleum refining, and steel manufacturing, where continuous, high-volume hydrogen production is essential. These advantages continue to strengthen the market position of alkaline electrolyzers and support their long-term dominance.
Delivery Form Analysis
Compressed Gas Hydrogen Leads Due to Easy Storage and Transport.
The compressed gas hydrogen segment accounted for 51.2% of the clean hydrogen market in 2025, mainly due to its strong compatibility with existing industrial and transportation infrastructure. Compressed hydrogen is typically stored and transported at pressures of 350–700 bar, making it the most widely used hydrogen delivery method worldwide. Unlike liquid hydrogen, it does not require cryogenic cooling or chemical conversion, which lowers infrastructure and operating costs.
According to H2stations (Ludwig-Bölkow-Systemtechnik), there were 980 hydrogen fueling stations operating globally by the end of 2024, with most dispensing compressed hydrogen at 350 or 700 bar. Supporting this trend, the compressed gas station segment captured 72% of the global hydrogen fueling station market revenue in 2025, highlighting its widespread use in fuel cell vehicle refueling.
Compressed gas hydrogen also leads industrial distribution because of its well-established transportation network. High-pressure tube trailers, capable of carrying up to 1,100 kg of hydrogen per load at 500 bar, remain the primary delivery solution for chemical plants, glass manufacturers, and food processing facilities that do not have pipeline access. As hydrogen demand continues to increase across manufacturing, transportation, and energy storage applications, compressed gas remains the preferred delivery option because it offers lower infrastructure requirements, established logistics, and cost-effective distribution.
Application Analysis
Transportation Held a Major Share of the Clean Hydrogen Market.
The transportation segment accounted for 26.5% of the clean hydrogen market in 2025, driven by the rapid adoption of hydrogen-powered vehicles and expanding refueling infrastructure. According to the IEA Advanced Fuel Cells Technology Collaboration Programme (AFC TCP) Annual Report 2024, the global fuel cell vehicle (FCV) fleet reached 97,356 vehicles by the end of 2024, supported by 1,302 hydrogen refueling stations across 28 countries. Hydrogen demand is rising as each passenger FCV typically consumes 1–5 kg of hydrogen per refueling, while heavy-duty fuel cell trucks require 30–80 kg per fill. This growing vehicle fleet is directly increasing hydrogen consumption worldwide.
The heavy-duty transport sector is a major growth driver. According to the Hydrogen Council’s Hydrogen Insights 2024, long-haul trucks account for nearly 26% of global road transport CO₂ emissions, making hydrogen a key solution for decarbonization. China remains the global leader with more than 5,600 hydrogen fuel cell buses in operation. In addition, South Korea’s Ministry of Environment allocated KRW 576.2 billion (approximately US$420 million) in 2026 to deploy 7,820 hydrogen vehicles, including 1,800 hydrogen buses. Increasing government investments, expanding hydrogen refueling networks, and the development of heavy-duty hydrogen transport corridors across Asia, Europe, and North America continue to strengthen transportation as the leading demand segment in the clean hydrogen market.
Key Market Segments
Production Method
- Green Hydrogen
- Blue Hydrogen
- Turquoise (Pyrolysis) Hydrogen
- Others
Electrolyzer Technology
- Alkaline Electrolyzer
- Proton Exchange Membrane (PEM) Electrolyzer
- Solid-Oxide Electrolyzer (SOEC)
- Anion-Exchange Membrane (AEM) Electrolyzer
Delivery Form
- Compressed Gas Hydrogen
- Liquid Hydrogen
- Ammonia
- Liquid Organic Hydrogen Carriers (LOHC)
Application
- Transportation
- Power Generation
- Others
Driver Analysis
Policy bankability from 45V and auction-backed revenue floors
In 2026, the strongest near-term accelerator remains policy conversion from aspiration into bankable cash flow. In the U.S., final 45V rules clarified eligibility, preserved multiple production pathways, kept the four-tier structure, and maintained a credit worth up to $3.00/kg for qualifying projects over 10 years, while setting a 4 kg CO2e/kg H2 lifecycle threshold and a 2030 shift to hourly matching for electricity accounting.
That matters because hydrogen project underwriting is unusually sensitive to subsidy visibility: a $1.00–$3.00/kg support band can materially change debt-service coverage, shorten payback periods, and move projects from subscale pilots toward final investment decision, especially where uncontracted green hydrogen still struggles against fossil-based hydrogen on delivered cost.
Drivers Impact Analysis
| Driver | (~) % Impact on CAGR Forecast | Geographic Relevance | Impact Timeline |
|---|---|---|---|
| Policy bankability from 45V and auction-backed revenue floors | +2.2% | North America core, EU core, selected Middle East export corridors | Short term (≤ 2 years) |
| Industrial offtake mandates and decarbonization pull in steel, refining, ammonia | +1.9% | EU core, North America early clusters, India and Gulf export links, East Asia industrial belts | Medium term (2-4 years) |
| Electrolyzer scale-up and balance-of-plant localization improving project economics | +1.6% | China manufacturing base, EU, U.S., India emerging supply chain | Medium term (2-4 years) |
| Hydrogen hubs, pipeline-storage buildout, and demand-supply matching platforms | +1.4% | U.S. hub regions, EU cross-border corridors, North Sea and Iberia, Gulf-to-Europe links | Medium term (2-4 years) |
| Renewable power abundance and curtailment capture lowering delivered input cost | +1.3% | Iberia, Nordics, Middle East, Australia, India, parts of U.S. wind-solar belts | Short term (≤ 2 years) |
| Derivatives-led trade via ammonia, methanol, and e-fuels unlocking seaborne scale | +1.1% | EU import markets, Japan, South Korea, Singapore, Middle East, Chile, Australia, India | Long term (≥ 4 years) |
Restraint Analysis
High levelized cost and price volatility
High production cost remains the single most powerful drag on clean hydrogen growth, because even with strong subsidies many projects still struggle to reach delivered costs below the mid-single-digit dollars per kilogram range at scale, while fossil-based hydrogen often sits materially lower when gas prices are benign. Electricity can account for 60%–70% of green hydrogen variable cost, so volatility in wholesale power markets and uncertainty about future PPA prices directly translate into unstable hydrogen pricing bands, making it difficult for industrial buyers to sign 10–15-year offtake agreements at fixed or narrow collar prices.
At the same time, capital costs for large-scale electrolysis systems remain high: recent industry evidence points to system-level investments at several thousand dollars per kilowatt for integrated projects, with balance-of-plant and grid connection often matching or exceeding stack costs, which raises levelized cost of hydrogen and forces developers to demand higher floor prices or stronger policy support to meet debt-service coverage ratios.
Restraint Impact Analysis
| Restraint | (~) % Impact on CAGR | Geographic Relevance | Impact Timeline |
|---|---|---|---|
| High levelized cost and price volatility | -2.3% | EU core, North America, APAC demand centers | Short term (≤ 2 years) |
| Slow infrastructure and distribution build-out | -1.9% | North America hubs, EU corridors, APAC ports | Medium term (2-4 years) |
| Complex and evolving regulatory eligibility | -1.7% | EU RFNBO markets, U.S. tax-credit users | Medium term (2-4 years) |
| Technology and scale-up risk in projects | -1.6% | India, emerging markets, early-stage hub regions | Medium term (2-4 years) |
| Sustainability and supply-chain footprint concerns | -1.4% | EU, OECD importers, global export corridors | Long term (≥ 4 years) |
| Capital intensity and constrained project finance | -1.8% | Global, particularly non-OECD and higher-rate markets | Medium term (2-4 years) |
Opportunity Analysis
Derivative chemicals and fuels platforms
Between now and 2035, potential derivative demand easily runs into tens of millions of tonnes per year of equivalent hydrogen if even 20%–30% of global ammonia and methanol production plus a low single-digit share of jet fuel is converted to green routes, representing incremental TAM in the hundreds of billions of dollars annually, much of which is not in baseline clean hydrogen projections that focus primarily on domestic industrial substitution.
Strategically, this white space allows first movers to build multi-sided platforms—linking producers, shipowners, fertilizer buyers, and aviation customers—charging volume-based access fees, optimization margins, and certification services that can add 300–500 basis points to operating margins versus single-asset hydrogen projects, while also unlocking cross-portfolio hedging revenue. The opportunity is differentiated from existing drivers because current policy schemes mainly support discrete projects and limited offtake contracts, whereas platform models would monetize connectivity, pooling, and derivative trading, potentially adding more than two percentage points to sector CAGR if a handful of hubs capture 10%–15% of projected derivative flows by 2030–2035.
Opportunity Impact Analysis
| Opportunity | (~) % Potential CAGR | Geographic Relevance | Execution Window |
|---|---|---|---|
| Derivative chemicals and fuels platforms | +2.4% | EU, Japan, South Korea, Singapore, Middle East export hubs | Medium term (2-4 years) |
| Deep industrial decarbonization bundles in steel, cement, chemicals | +2.1% | EU core, North America, China, India, GCC industrial belts | Medium term (2-4 years) |
| Hydrogen-as-a-service and digital optimization platforms | +1.8% | North America, EU, APAC advanced industrial clusters | Short term (≤ 2 years) |
| Clean hydrogen for road transport in emerging markets | +1.9% | Latin America, Africa, South and Southeast Asia | Long term (≥ 4 years) |
| Distributed hydrogen for storage and grid balancing | +1.7% | North America, EU, high-renewables APAC and Australia | Medium term (2-4 years) |
| Cross-border M&A roll-ups and integrated value chains | +1.5% | Global, especially EU–GCC, EU–LATAM, US–APAC corridors | Medium term (2-4 years) |
Challenges Analysis
Pilot-phase project execution drag
Across regions, many announced projects remain in pre-FID or early construction, with only a minority transitioning into steady-state operation, and recent European Hydrogen Valleys data shows that although the share of operational valleys on the H2V Platform doubled from 9% to 18% between 2024 and mid-2026, this still means more than four out of five initiatives are not yet fully delivering commercial volumes, leaving capacity utilization and ecosystem maturity below potential.
This results in operational friction: EPC teams must cope with high first-of-a-kind error rates, commissioning delays often measured in months, and iterative redesigns that raise soft costs per megawatt of electrolysis capacity, while lenders demand more conservative covenants and contingencies, adding several percentage points to total project budgets and forcing sponsors to stretch development timelines over 4–6 years rather than 2–3. Strategically, companies must institutionalize robust stage-gate frameworks, standardize reference designs, and build centralized project management offices capable of handling portfolios of pilots without losing focus on replication, or they risk locking scarce engineering talent and capital into perpetual prototypes, which manifests as about a 1–1.5 percentage point drag on achievable CAGR relative to a scenario where projects move more swiftly from demonstration to scaled roll-out.
Challenges Impact Analysis
| Challenge | (~) % CAGR Friction | Geographic Relevance | Mitigation Horizon |
|---|---|---|---|
| Pilot-phase project execution drag | -1.3% | EU, North America, China, emerging hubs | Medium term (2-4 years) |
| Complex storage and transport logistics | -1.1% | EU regulatory hubs, APAC logistics corridors, North America | Long term (≥ 4 years) |
| Fragmented hydrogen valley ecosystems | -1.0% | EU valleys, selected APAC and North American clusters | Medium term (2-4 years) |
| Specialized talent and skills gap | -0.9% | Global, especially emerging markets and new hubs | Long term (≥ 4 years) |
| Volatile macro and policy signaling | -1.2% | North America core, EU policy centers, APAC trade routes | Medium term (2-4 years) |
| Supply chain variability and cost inflation | -1.0% | Global manufacturing bases and project EPC networks | Medium term (2-4 years) |
Geopolitical Impact Analysis
The growing US-China trade conflict is increasing costs and creating supply chain risks across the clean hydrogen market, especially for electrolyzers and fuel cell components. In April 2025, China’s Ministry of Commerce introduced export licensing requirements for 7 heavy rare earth elements (REEs), followed by controls on 5 additional REEs in October 2025 in response to U.S. tariffs. China currently accounts for around 92% of global REE processing capacity. Key materials such as ytterbium, holmium, and erbium are widely used in PEM electrolyzer membranes, fuel cell catalysts, and permanent magnets for hydrogen compressors.
- According to the European Parliament Research Service, REE prices in Europe increased by up to 6 times after the restrictions, significantly raising manufacturing costs for non-Chinese producers. At the same time, the Yale Budget Lab estimated that U.S. effective tariff rates reached 17.9% by October 2025, the highest level since 1934, increasing the import cost of Chinese electrolyzer stacks and hydrogen equipment. The California Energy Commission also reported that U.S. tariffs could increase green hydrogen production costs by up to 14%, reducing its price competitiveness.
Governments are responding by strengthening domestic supply chains and reducing dependence on imported critical materials. The European Union’s Critical Raw Materials Act (CRMA), which came into force in May 2024, selected 60 strategic projects across 13 member states with planned investments of €22.5 billion to expand domestic mining, processing, and recycling of critical minerals. The Act targets 40% domestic processing of critical minerals by 2030 and limits dependence on any single foreign supplier to 65% of annual consumption.
Meanwhile, China maintained about 70% of global electrolyzer manufacturing capacity with 3.5 GW installed by the end of 2024. However, its global market share is expected to decline from around 60% to 30% by 2030 as manufacturing capacity expands across Europe and the United States. These developments are reshaping investment, production, and trade across the global clean hydrogen value chain.
Regional Analysis
North America Held the Largest Share of the Global Clean Hydrogen Market.
North America dominated the worldwide clean hydrogen market in 2025, with 34.5% of the total market share. The region’s leadership is largely due to strong government support, considerable expenditures in hydrogen infrastructure, and the presence of premier hydrogen technology innovators and clean energy enterprises. The United States and Canada have developed a variety of financial programs, tax breaks, and legislative initiatives to encourage low-carbon hydrogen production and speed industrial decarbonization.
Europe is a key market because to its lofty climate goals, extensive hydrogen programs, and strong regulatory support for renewable hydrogen development. Asia Pacific is predicted to see the quickest growth throughout the forecast period, owing to rapid industrialization, increased clean energy investments, and rising hydrogen use in countries such as China, Japan, South Korea, and India. Latin America is progressively emerging as a promising market, aided by vast renewable energy supplies and increased interest in green hydrogen export initiatives.
Key Regions and Countries Covered
- North America
- The US
- Canada
- Europe
- Germany
- France
- The UK
- Spain
- Italy
- Russia & CIS
- Rest of Europe
- APAC
- China
- Japan
- South Korea
- India
- ASEAN
- Rest of APAC
- Latin America
- Brazil
- Mexico
- Rest of Latin America
- Middle East & Africa
- GCC
- South Africa
- Rest of MEA
Key Players Analysis
The global clean hydrogen industry is moderately consolidated, with established energy firms, industrial gas producers, and electrolyzer technology providers seeking to increase their market share. Competition is largely driven by technological innovation, large-scale project development, strategic partnerships, and investments in hydrogen production infrastructure. Companies are working on growing electrolyzer manufacturing capacity, expanding renewable hydrogen projects, and bolstering their positions along the hydrogen value chain.
Leading companies are also investing heavily in research and development to improve hydrogen production efficiency, reduce costs, and accelerate commercialization. Companies such as, Siemens Energy, Nel ASA, and ITM Power, are focusing on advancing electrolyzer technologies, scaling up hydrogen production capacity, and developing innovative storage and transportation solutions.
The Major Players In The Industry
- Siemens Energy
- Nel ASA
- ITM Power
- Ballard Power Systems
- Plug Power
- Air Liquide
- Linde plc
- Topsoe
- Cummins Inc.
- Bloom Energy
- Enapter
- Fortescue Future Industries
- ACWA Power
- Reliance Industries
- Other Key Players
Key Development
- In March 2026, Siemens Energy expanded its electrolyzer manufacturing capabilities to support growing global demand for green hydrogen projects and strengthen supply capacity for utility-scale hydrogen production facilities.
- In May 2025, Through its subsidiary TEC H2 MAG, the company applied for an environmental permission in Chile for a USD 16 billion green hydrogen and ammonia project. The project, which includes seven electrolysis centers, a massive wind farm, and export infrastructure, is one of the world’s largest proposed green hydrogen production projects.
Report Scope
| Report Features | Description |
|---|---|
| Market Value (2025) | USD 2.2 Bn |
| Forecast Revenue (2035) | USD 21.7 Bn |
| CAGR (2026-2035) | 25.6% |
| Base Year for Estimation | 2025 |
| Historic Period | 2020-2024 |
| Forecast Period | 2026-2035 |
| Report Coverage | Revenue Forecast, Market Dynamics, Competitive Landscape, Recent Developments |
| Segments Covered | By Production Method (Green Hydrogen, Blue Hydrogen, Turquoise (Pyrolysis) Hydrogen, Others); By Electrolyzer Technology (Alkaline Electrolyzer, Proton Exchange Membrane (PEM) Electrolyzer, Solid-Oxide Electrolyzer (SOEC), Anion-Exchange Membrane (AEM) Electrolyzer); By Delivery Form (Compressed Gas Hydrogen, Liquid Hydrogen, Ammonia, Liquid Organic Hydrogen Carriers (LOHC)); By Application (Transportation, Power Generation, Others). |
| Regional Analysis | North America – The US & Canada; Europe – Germany, France, The UK, Spain, Italy, Russia & CIS, Rest of Europe; APAC– China, Japan, South Korea, India, ASEAN & Rest of APAC; Latin America– Brazil, Mexico & Rest of Latin America; Middle East & Africa– GCC, South Africa, & Rest of MEA |
| Competitive Landscape | Siemens Energy, Nel ASA, ITM Power, Ballard Power Systems, Plug Power, Air Liquide, Linde plc, Topsoe, Cummins Inc., Bloom Energy, Enapter, Fortescue Future Industries, ACWA Power, Reliance Industries, Other Key Players. |
| Customization Scope | Customization for segments, region/country-level will be provided. Moreover, additional customization can be done based on the requirements. |
| Purchase Options | We have three licenses to opt for: Single User License, Multi-User License (Up to 5 Users), Corporate Use License (Unlimited Users and Printable PDF) |





































