


Report Overview
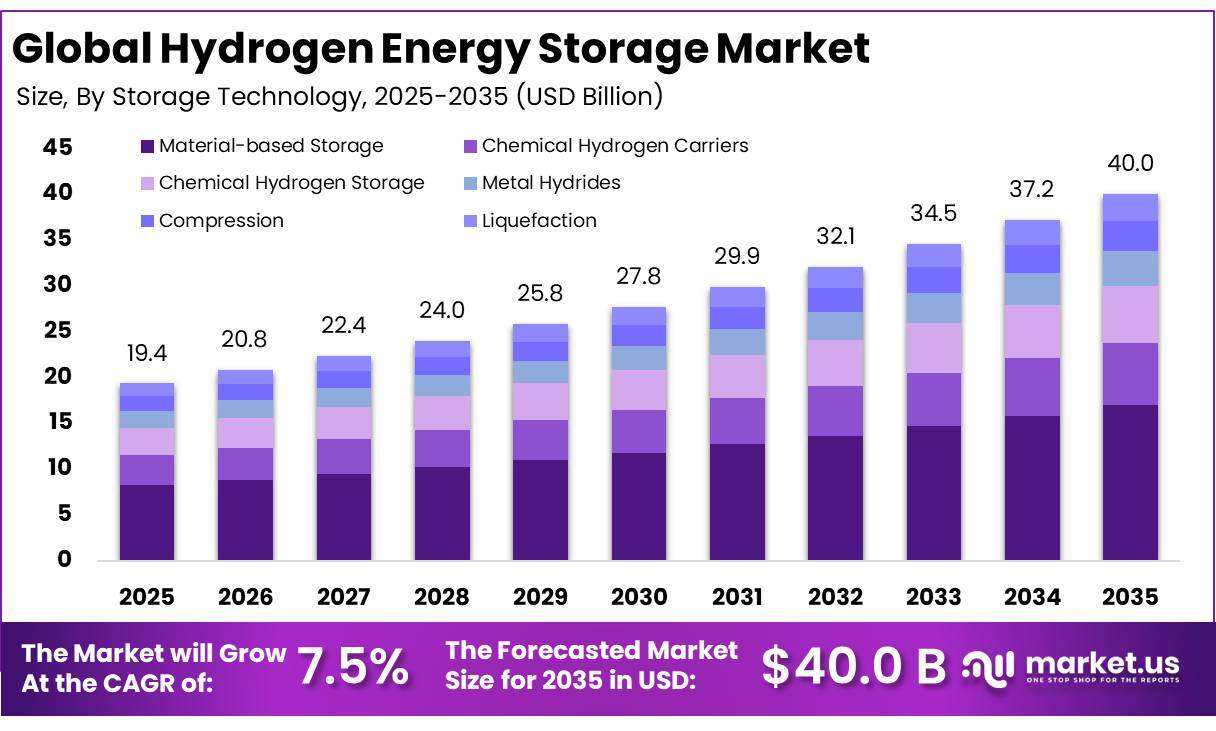
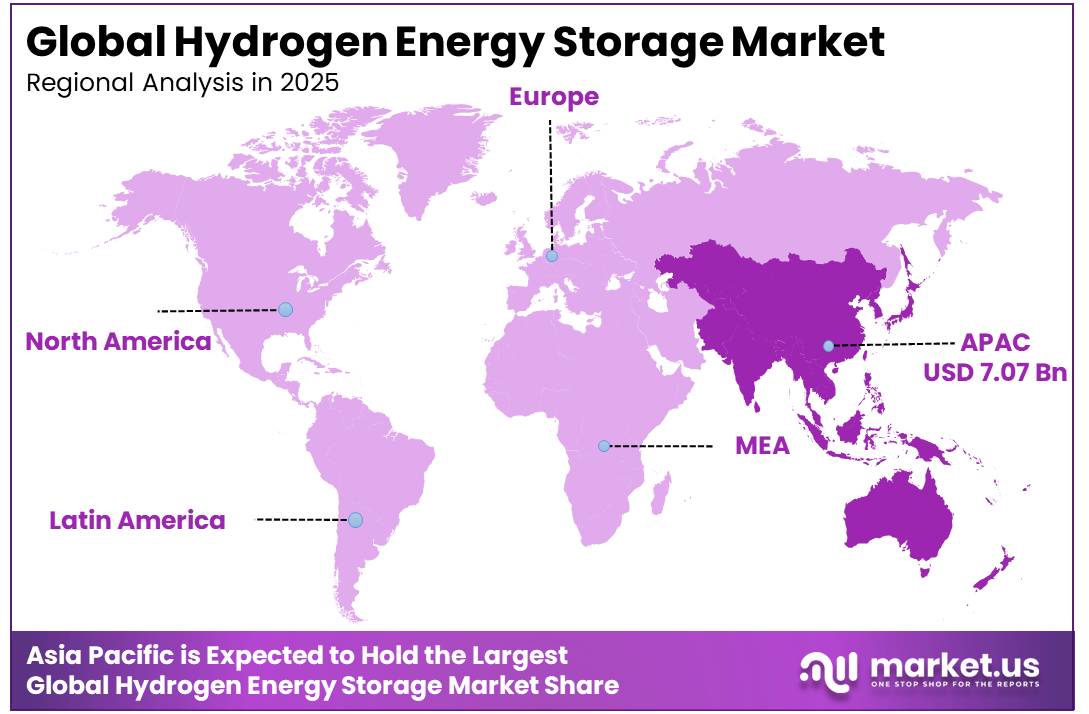
In 2025, the Global Hydrogen Energy Storage Market was valued at USD 19.4 billion, and between 2026 and 2035, this market is estimated to register a CAGR of 7.5%, reaching about USD 40.0 billion by 2035. In 2025, Asia Pacific led the market, achieving over 36.5% share with a revenue of USD 7.07 Billion.
Hydrogen energy storage is emerging as a strategic long-duration flexibility solution because surplus renewable electricity can be converted into hydrogen through electrolysis and retained for later use in electricity generation, industrial processes or transportation. Hydrogen can be stored as compressed gas, cryogenic liquid, chemical carriers or in underground geological formations.
- The current U.S. Department of Energy guidance states that liquid hydrogen is stored at -253°C, normally at pressures no higher than 5 bar, while four salt caverns are presently used for hydrogen storage. These characteristics support large-volume and seasonal energy shifting.
Key Takeaways
- The Global Hydrogen Energy Storage Market was valued at US$19.4 billion in 2025.
- The market is projected to grow at a CAGR of 7.5% and is estimated to reach US$40.0 billion by 2035.
- On the basis of storage technology, material-based storage dominated the market, constituting 42.6% of the total market share.
- Based on the physical state, solid dominated the market, with a substantial market share of around 42.3%.
- Based on the application, stationary power led the market, comprising 32.0% of the total market.
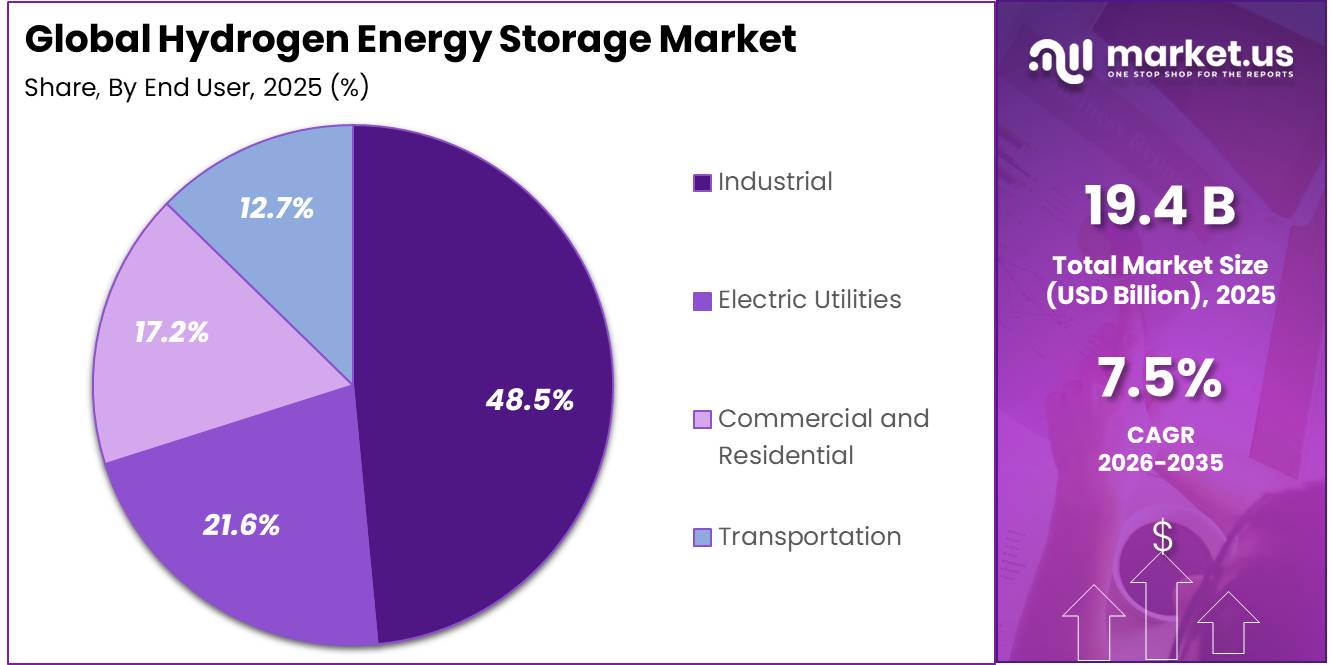
- On the basis of end user, industrial dominated the market, constituting 48.5% of the total market share.
- In 2025, Asia Pacific was the most dominant region in the market, accounting for 36.5% of the total global consumption.
The industrial scenario expanded during 2025. The International Energy Agency’s Global Hydrogen Review 2026 reported that global hydrogen demand surpassed 100 million tonnes in 2025, although refining and established industrial applications continued to dominate consumption. Low-emissions hydrogen production reached almost 1 million tonnes in 2025, while installed electrolysis capacity exceeded 4 GW during the same year. These additions are enlarging the potential supply base for storage-linked renewable power, industrial decarbonisation and dispatchable electricity projects.
- Hydrogen storage infrastructure remains considerably less developed than hydrogen production capacity. The IEA reported in 2026 that announced underground hydrogen storage projects could provide approximately 11 TWh of capacity by 2035, equivalent to around 335,000 tonnes of hydrogen.
The U.S. Department of Energy’s official storage guidance, accessed in July 2026, continued to identify only four salt caverns currently used for hydrogen storage. This limited operating base creates opportunities in cavern engineering, compression equipment, pipeline interconnection, leakage detection and storage-integrity monitoring.
According to the IEA’s 2026 review, capital spending on low-emissions hydrogen projects reached nearly USD 7 billion in 2025 and could approach USD 10 billion in 2026. The agency also identified USD 41 billion in public funding through policy updates made after its 2025 review. Such support can reduce project risk and improve the bankability of integrated facilities combining renewable generation, electrolysers, hydrogen storage and flexible electricity production.
Government programmes are beginning to connect hydrogen production with end-use demand. In January 2026, the European Commission confirmed that six renewable hydrogen projects selected through the 2024 Innovation Fund auction had signed grant agreements worth EUR 270.6 million. These projects are expected to install 381.25 MW of electrolyser capacity across Spain, Finland and Norway. By supporting verified renewable hydrogen production, the programme is intended to narrow the difference between production costs and the prices industrial users can afford.
Future growth opportunities will concentrate in salt caverns, depleted reservoirs, hydrogen-ready turbines, transmission networks and integrated renewable-energy hubs. The United Kingdom’s July 2026 Clean Flexibility Roadmap confirmed that a 2% green-hydrogen blend was successfully used at Brigg Power Station in October 2025.
- The IEA reported in 2026 that announced hydrogen pipelines exceeded 40,000 km by 2035, but only 9% of this length was operational or supported by committed investment. Faster permitting, long-term offtake agreements and coordinated infrastructure planning will therefore be essential for industry expansion.
Storage Technology Analysis
Material-based Storage leads with a 42.6% share due to its flexible and efficient hydrogen-storage properties.
In 2025, Material-based Storage held a dominant market position, capturing more than a 42.6% share. The segment benefits from its ability to store hydrogen within solid or liquid materials rather than relying only on large pressurized tanks. Metal hydrides, sorbent materials and chemical hydrogen-storage materials are being developed to improve storage density, operating safety and hydrogen release performance. The U.S. Department of Energy also identifies material-based systems as a promising long-term option for stationary, portable and transportation applications because they can reduce storage pressure and support more compact system designs.
Chemical Hydrogen Carriers is the fastest-growing segment. In 2025, the segment gained attention because these carriers can hold hydrogen in liquid or solid chemical compounds and release it when required. This approach can use existing chemical-handling, storage and transportation infrastructure more easily than free hydrogen in certain applications. Liquid organic carriers, chemical hydrides, ammonia and other carrier materials are being studied for long-distance hydrogen delivery, industrial storage and marine fuel use. Continued work on regeneration efficiency, hydrogen-release control and operating costs is expected to support wider adoption.
Physical State Analysis
Solid dominates the hydrogen energy storage market with a 42.3% share due to its compact and safer storage characteristics.
In 2025, Solid held a dominant market position, capturing more than a 42.3% share of the Hydrogen Energy Storage Market by physical state. Solid-state systems store hydrogen within materials such as metal hydrides, chemical compounds and porous sorbents. This method offers high volumetric storage density and can reduce the need for extremely high-pressure tanks. It is particularly suitable for stationary energy storage, industrial backup power and locations where safety and available space are major concerns.
In 2025, the European Union’s REMEDHYS project began developing a solid-state metal-hydride system capable of storing 100 kg of hydrogen at a pressure below 50 bar. The system will be tested alongside a 2 MW electrolyser, showing the potential of solid storage for larger industrial and renewable-energy applications. The U.S. Department of Energy is also supporting research into metal hydrides, chemical hydrogen storage materials and sorbents to improve storage capacity, operating performance and lifecycle reliability.
Gas is the fastest-growing segment in the Hydrogen Energy Storage Market by physical state. In 2025, demand for gaseous hydrogen storage continued to strengthen because compressed gas systems can be installed close to electrolysers, refuelling facilities, industrial plants and renewable power projects. These systems allow hydrogen to be stored and released quickly, making them suitable for short-term grid balancing, transportation, industrial buffering and distributed energy applications.
Application Analysis
Stationary Power leads the hydrogen energy storage market with a 32.0% share due to its reliable grid-support capabilities.
In 2025, Stationary Power held a dominant market position, capturing more than a 32.0% share. The segment benefits from hydrogen’s ability to store surplus renewable electricity and return it as dependable power during periods of low generation or high demand. In its June 2025 update, the European Commission reported that the HYFLEXPOWER demonstration was designed to produce 12 MW of electricity using fuel mixtures containing up to 100% hydrogen. This progress supports the wider use of stationary hydrogen storage for grid balancing, industrial power supply, and emergency backup systems.
Transportation is the fastest growing segment. Its expansion is supported by hydrogen’s suitability for commercial vehicles that require longer driving ranges and quick refuelling. According to a November 2025 factsheet from the EU Clean Hydrogen Partnership, the H2Accelerate Trucks project plans to deploy 150 hydrogen-powered trucks across 8 European Union member states, with vehicles designed to travel more than 600 km. These deployments are strengthening refuelling corridors and demonstrating the practical use of stored hydrogen in freight and fleet operations.
End User Analysis
Industrial leads the end-user segment with a 48.5% share, supported by heavy hydrogen use in refining and chemical production.
In 2025, Industrial held a dominant market position, capturing more than a 48.5% share. Its leadership comes from the continuous use of hydrogen in petroleum refining, ammonia manufacturing, chemical processing and high-temperature operations. UK government data reported hydrogen demand of 12 TWh during the year, with petroleum refineries accounting for 75% of total consumption. These established industrial processes require reliable hydrogen production, storage and onsite supply, giving the segment a strong advantage over newer end-use applications.
The Electric Utilities segment is the fastest-growing segment. Utilities are increasingly assessing hydrogen storage for absorbing surplus renewable power and generating electricity when wind or solar availability falls. According to the U.S. Energy Information Administration, the country had 186 operating fuel-cell electricity generators with a combined capacity of approximately 364 MW at the end of 2025. This development, alongside total utility-scale electricity generation of about 4.43 trillion kWh, highlights the need for flexible storage technologies that can support grid reliability and long-duration energy supply.
Key Market Segments
Storage Technology
- Material-based Storage
- Chemical Hydrogen Carriers
- Chemical Hydrogen Storage
- Metal Hydrides
- Compression
- Liquefaction
Physical State
- Solid
- Gas
- Liquid
Application
- Stationary Power
- Transportation
- Portable Power
- Power Generation
- Others
End User
- Industrial
- Electric Utilities
- Commercial and Residential
- Transportation
Driver Analysis
DOE Hydrogen Shot Cost-Parity Mandate
The U.S. Department of Energy’s Hydrogen Shot initiative, launched June 7, 2021, anchors an “1-1-1” framework cutting clean hydrogen costs 80% to $1/kg within a decade with an interim 2026 checkpoint of $2/kg production cost and electrolyzer capital cost targets of $250/kW for low-temperature PEM systems and $500/kW for high-temperature SOEC systems. Congress appropriated over $250 million for DOE hydrogen and fuel cell activities in FY2026, including $160 million routed through the new Alternative Fuels & Feedstocks Office and $80 million specifically for fossil-based hydrogen storage, transport, and utilization R&D, alongside a new directive to launch an industry-led collaboration on underground hydrogen storage.
Historical cost trajectories reinforce feasibility: PEM electrolyzer capital costs have already fallen 80% since 2005, automotive fuel cell costs are down 70% since 2008, and compressed onboard hydrogen storage costs have dropped 30% since 2013, establishing a credible cost-decline curve for storage-linked infrastructure. Strategically, this shifts hydrogen storage economics from grant-dependent demonstration projects toward bankable, tariff-referenced infrastructure assets, as storage system BOM costs converge toward the DOE’s long-term $9/kWh target, unlocking merchant storage business models rather than purely subsidized pilot deployments.
Driver Impact Analysis
| Driver | (~) % Impact on CAGR Forecast | Geographic Relevance | Impact Timeline |
|---|---|---|---|
| Federal cost-parity mandates via DOE Hydrogen Shot accelerating electrolyzer and storage system deployment | +2.1% | North America core (US Gulf Coast, Appalachian, Heartland Hubs) | Medium term (2-4 years) |
| India’s National Green Hydrogen Mission SIGHT outlay mobilizing electrolyzer and storage capacity buildout | +1.9% | APAC corridors (India core, spill-over to South/Southeast Asia) | Medium term (2-4 years) |
| EU REPowerEU 40 GW electrolyzer capacity target and Hydrogen Bank auctions driving underground and large-scale storage infrastructure | +1.7% | EU core (Germany, Netherlands, Spain), spill-over to UK/Norway | Long term (≥4 years) |
| China’s NDRC 15th Five-Year Plan and first national green hydrogen capex subsidy formalizing storage-linked production | +2.3% | APAC core (China), spill-over to East Asia supply chains | Long term (≥4 years) |
| US federal policy volatility and Hydrogen Hub funding cancellations reshaping regional investment risk | -1.2% | North America (California, Pacific Northwest, Midwest, Mid-Atlantic hubs) | Short term (≤2 years) |
| Japan’s Hydrogen Society Promotion Act and Contract-for-Difference subsidy mechanism supporting import-dependent storage and refueling buildout | +1.4% | APAC core (Japan), South Korea spill-over | Medium term (2-4 years) |
Restraint Analysis
Pipeline and storage infra lag
Hydrogen storage demand cannot scale efficiently without linked transport and backbone infrastructure, yet the fact that the EU’s Hy2Infra package still needs public support of up to €6.9 billion to unlock about €5.4 billion of private investment for 3.2 GW of electrolyzers, around 2,700 km of pipelines, and at least 370 GWh of storage shows that the market is still infrastructure-deficient rather than self-propelling.
In the U.S., PHMSA’s 2025 advance rulemaking activity indicates that the regulatory architecture for pipeline modernization and hydrogen-relevant safety oversight is still evolving, which typically extends routing, engineering approval, and lender due-diligence timelines by 9 to 24 months for large linear assets. The business consequence is that many storage projects are stranded behind unavailable offtake connections or must rely on trucked or modular delivery, increasing delivered-logistics costs by 15% to 40% versus connected pipeline scenarios and depressing utilization rates in the first years of operation
Restraint Impact Analysis
| Restraint | (~) % Impact on CAGR Forecast | Geographic Relevance | Impact Timeline |
|---|---|---|---|
| High storage system cost | -2.4% | North America core, EU, Japan, Korea | Medium term (2-4 years) |
| RFNBO compliance burden | -1.6% | EU, EU export corridors, MENA-to-EU | Short term (≤ 2 years) |
| Pipeline and storage infra lag | -2.1% | EU, North America core, APAC corridors | Long term (≥ 4 years) |
| Power price volatility | -1.5% | North America core, EU, import-dependent APAC | Short term (≤ 2 years) |
| Imported equipment tariff/logistics drag | -1.2% | North America, EU, India | Medium term (2-4 years) |
| Safety codes and permitting delays | -1.4% | North America core, EU, Japan, Korea | Medium term (2-4 years) |
Opportunity Analysis
Underground storage scale-up
The IEA states that hydrogen infrastructure deployment includes underground storage and that more than 200 committed low-emissions hydrogen investments are moving forward, but it also notes that infrastructure readiness remains a major barrier, which means the market has not yet priced in the step-change that commercial cavern storage could create.
If developers secure salt cavern, depleted field, or lined rock cavern projects in regions with strong renewable curtailment and industrial demand, storage cost per kilogram for long-duration applications could decline by 50-70% versus repeated above-ground expansion, round-trip system economics for seasonal balancing could improve enough to widen addressable utility demand by 2-3 times, and individual hubs could scale into 5-10 times the capacity of current distributed installations; because that would move the sector from project storage to system storage, it carries the largest modeled uplift at around +3.0 percentage points of CAGR above baseline by 2035.
Opportunity Impact Analysis
| Opportunity | (~) % Potential CAGR Upside | Geographic Relevance | Execution Window |
|---|---|---|---|
| Storage-as-a-Service | +2.4% | EU, India, North America core | Short term (≤ 2 years) |
| Hydrogen valley clustering | +2.1% | EU, India, Japan | Medium term (2-4 years) |
| Import-terminal buffering | +1.9% | EU, Japan, Korea-linked APAC | Medium term (2-4 years) |
| Underground storage scale-up | +3.0% | North America core, EU, Australia | Long term (≥ 4 years) |
| Industrial backup power | +1.6% | EU, India, Southeast Asia | Short term (≤ 2 years) |
| Roll-up of niche storage tech | +1.8% | EU, Japan, North America core | Medium term (2-4 years) |
Challenges Analysis
Hydrogen Skills Throughput Deficit
The market also faces a multi-layer workforce challenge: hydrogen storage projects require electrochemistry, cryogenics, rotating equipment, high-pressure systems, subsurface engineering, digital controls, and process safety capabilities at the same time, while public hydrogen programs are expanding faster than specialist training pipelines, as shown by rapid scale-up initiatives in the EU and India, including India’s allocated annual green hydrogen production capacity of 862,000 tonnes and hub-oriented mission spending through 2025-26.
The consequence is not an inability to sell storage systems today, but slower execution quality longer commissioning curves, 5-10 percentage-point higher contractor dependence, greater O&M variance, and more redesign during hazard reviews and startup, which together support an estimated 0.8 percentage-point drag on medium-term market growth. Durable mitigation requires a throughput model for talent rather than ad hoc hiring: companies need multi-year technician academies, OEM-EPC-operator certification tracks, shared training standards across hydrogen hubs and ports, and earlier integration of safety engineering into workforce development so that storage assets can scale without accumulating latent reliability and compliance risk.
Challenges Impact Analysis
| Challenge | (~) % CAGR Friction Drag | Geographic Relevance | Mitigation Horizon |
|---|---|---|---|
| Storage Cost Learning Gap | -1.8% | North America core, EU industrial hubs, Japan-Korea import chains | Medium term (2-4 years) |
| Salt Cavern Site Bottlenecks | -1.4% | EU regulatory hubs, U.S. Gulf Coast, China inland clusters | Long term (≥ 4 years) |
| Pipeline Material Integrity Risk | -1.2% | North America core, EU gas grids, India pilot corridors | Medium term (2-4 years) |
| Certification Complexity Spillover | -1.0% | EU regulatory hubs, export-linked MENA, APAC trade corridors | Short term (≤ 2 years) |
| Port And Terminal Readiness | -0.9% | EU import gateways, Northeast Asia, Australia export nodes | Medium term (2-4 years) |
| Hydrogen Skills Throughput Deficit | -0.8% | India growth zones, EU project clusters, North America scale-up markets | Long term (≥ 4 years) |
Geopolitical Impact Analysis
War-Driven Energy Insecurity Reshapes the Hydrogen Energy Storage Market
The Middle East conflict and the Russia–Ukraine war are reshaping the hydrogen energy storage market by increasing energy-security concerns. Disruptions around the Strait of Hormuz affected nearly 20% of global LNG supply, pushing gas prices higher and raising production costs for conventional hydrogen. The Middle East conflict has interrupted hydrogen, ammonia, methanol and fertiliser production, while damaged facilities and restricted shipping have weakened supply chains.
These pressures create a mixed market effect. High gas, electricity, equipment, insurance and freight costs can delay electrolyser projects, storage terminals and hydrogen transport infrastructure. Investors may also postpone decisions where imported components or fuel supplies remain uncertain. However, the wars are strengthening the long-term case for locally produced renewable hydrogen. Governments and energy companies increasingly view hydrogen storage as a way to reduce dependence on imported fossil fuels, absorb surplus renewable power and provide backup energy during supply shocks.
Europe and parts of Asia are therefore expected to support domestic electrolysis, underground storage, ammonia terminals and diversified import routes. Growth may remain uneven in the near term, but continued geopolitical risk is likely to make hydrogen storage more important within national energy-security and resilience strategies.
Regional Analysis
Asia-Pacific Leads the Hydrogen Energy Storage Market While Europe Accelerates
In 2025, Asia-Pacific held the dominant position in the hydrogen energy storage market, capturing 36.5% and generating USD 7.07 billion. The region benefits from China’s large electrolyser supply chain, Japan’s hydrogen-based power programmes, South Korea’s clean-energy policies, and emerging production projects across Southeast Asia and Australia. Strong solar and wind development is creating greater need for long-duration storage that can absorb surplus electricity and supply energy during seasonal shortages. Industrial users in refining, chemicals, steel, shipping, and power generation also support demand. Continued investment in storage caverns, tanks, ammonia carriers, and hydrogen transport networks is expected to protect regional leadership.
Based on its funding and infrastructure pipeline, Europe is positioned as the fastest-growing regional market, supported by backing for hydrogen production and renewable integration. In 2026, the European Hydrogen Bank awarded more than EUR 1 billion to projects expected to install almost 1.1 GW of electrolyser capacity. This pipeline encourages demand for compressed, liquid, underground, and chemical-carrier storage systems that can balance offshore wind and solar output. The region is also developing hydrogen pipelines, industrial clusters, ports, and cross-border trading mechanisms. Clear certification rules and long-term decarbonisation commitments are improving project confidence, although high costs and slow permitting remain barriers.
Key Regions and Countries Covered
- North America
- The US
- Canada
- Europe
- Germany
- France
- The UK
- Spain
- Italy
- Russia & CIS
- Rest of Europe
- APAC
- China
- Japan
- South Korea
- India
- ASEAN
- Rest of APAC
- Latin America
- Brazil
- Mexico
- Rest of Latin America
- Middle East & Africa
- GCC
- South Africa
- Rest of MEA
Key Players Analysis
Cummins’ Accelera business participates in hydrogen technologies through PEM electrolyzers, fuel cells, and integrated zero-emission systems. In 2025, its largest announced electrolyzer order was a 100 MW system for bp’s Lingen project, designed to produce up to 11,000 tonnes of green hydrogen annually. However, Cummins recorded $458 million in Accelera-related charges and stated that it intended to stop new electrolyzer commercial activity while completing existing commitments.
Siemens Energy supports hydrogen storage development by supplying large-scale PEM electrolyzers that convert renewable electricity into storable hydrogen. Its Berlin joint venture targeted at least 3 GW of annual electrolyzer capacity by 2025, strengthening industrial-scale equipment availability. The company is also supplying technology for the 200 MW Normand’Hy project in France, expected to avoid 250,000 tonnes of carbon dioxide emissions each year.
ENGIE operates across hydrogen production, transport, storage, and end-use development, giving it a broad position in the hydrogen energy storage value chain. Its HyGreen project includes a 240 MW electrolyzer and targets annual production of 30,000 tonnes of renewable hydrogen, requiring about 300,000 cubic metres of water annually.
Chart Industries supplies cryogenic tanks, compression systems, liquefaction equipment, transport solutions, and storage technologies used across hydrogen infrastructure. In the second quarter of 2025, its hydrogen sales increased 29.3% year over year, while Specialty Products orders reached $663.3 million, rising 56.5% with hydrogen and helium contributing to growth.
The Major Players in the Industry
- Linde plc
- Air Liquide S.A.
- Air Products and Chemicals, Inc.
- Plug Power Inc.
- Nel ASA
- ITM Power plc
- Cummins Inc.—Accelera
- Siemens Energy AG
- thyssenkrupp nucera AG & Co. KGaA
- ENGIE S.A.
- Chart Industries, Inc.
- Iwatani Corporation
- Hexagon Purus ASA
- Hydrogenious LOHC Technologies GmbH
- McPhy Energy S.A.
- Other Key Players
Key Development
- In September 2025, Linde plc under New Product Development, company presented its new liquid-hydrogen trailer, which carries 3.9 metric tons, provides 50% more payload than standard European containers and limits heat transfer to below 100 watts, improving hydrogen storage and road distribution efficiency.
- In August 2025, Air Products and Chemicals completed the first liquid hydrogen fill of the world’s largest hydrogen storage sphere at NASA’s Kennedy Space Center, delivering more than 50 trailer loads and over 730,000 gallons of liquid hydrogen. The NASA tank has a total storage capacity of 1.25 million gallons, making it around 50% larger than the earlier storage units.
Report Scope
| Report Features | Description |
|---|---|
| Market Value (2025) | USD 19.4 Bn |
| Forecast Revenue (2035) | USD 40.0 Bn |
| CAGR (2026-2035) | 7.5% |
| Base Year for Estimation | 2025 |
| Historic Period | 2020-2024 |
| Forecast Period | 2026-2035 |
| Report Coverage | Revenue Forecast, Market Dynamics, Competitive Landscape, Recent Developments |
| Segments Covered | By Storage Technology (Material-based Storage, Chemical Hydrogen Carriers, Chemical Hydrogen Storage, Metal Hydrides, Compression, and Liquefaction), By Physical State (Solid, Gas, and Liquid), By Application (Stationary Power, Transportation, Portable Power, Power Generation, and Others), By End User (Industrial, Electric Utilities, Commercial and Residential, and Transportation) |
| Regional Analysis | North America – The US & Canada; Europe – Germany, France, The UK, Spain, Italy, Russia & CIS, Rest of Europe; APAC– China, Japan, South Korea, India, ASEAN & Rest of APAC; Latin America– Brazil, Mexico & Rest of Latin America; Middle East & Africa– GCC, South Africa, & Rest of MEA |
| Competitive Landscape | Linde plc, Air Liquide S.A., Air Products and Chemicals, Inc., Plug Power Inc., Nel ASA, ITM Power plc, Cummins Inc.—Accelera, Siemens Energy AG, thyssenkrupp nucera AG & Co. KGaA, ENGIE S.A., Chart Industries, Inc., Iwatani Corporation, Hexagon Purus ASA, Hydrogenious LOHC Technologies GmbH, McPhy Energy S.A., and Other Key Players |
| Customization Scope | Customization for segments, region/country-level will be provided. Moreover, additional customization can be done based on the requirements. |
| Purchase Options | We have three licenses to opt for: Single User License, Multi-User License (Up to 5 Users), Corporate Use License (Unlimited Users and Printable PDF) |





































