


Report Overview
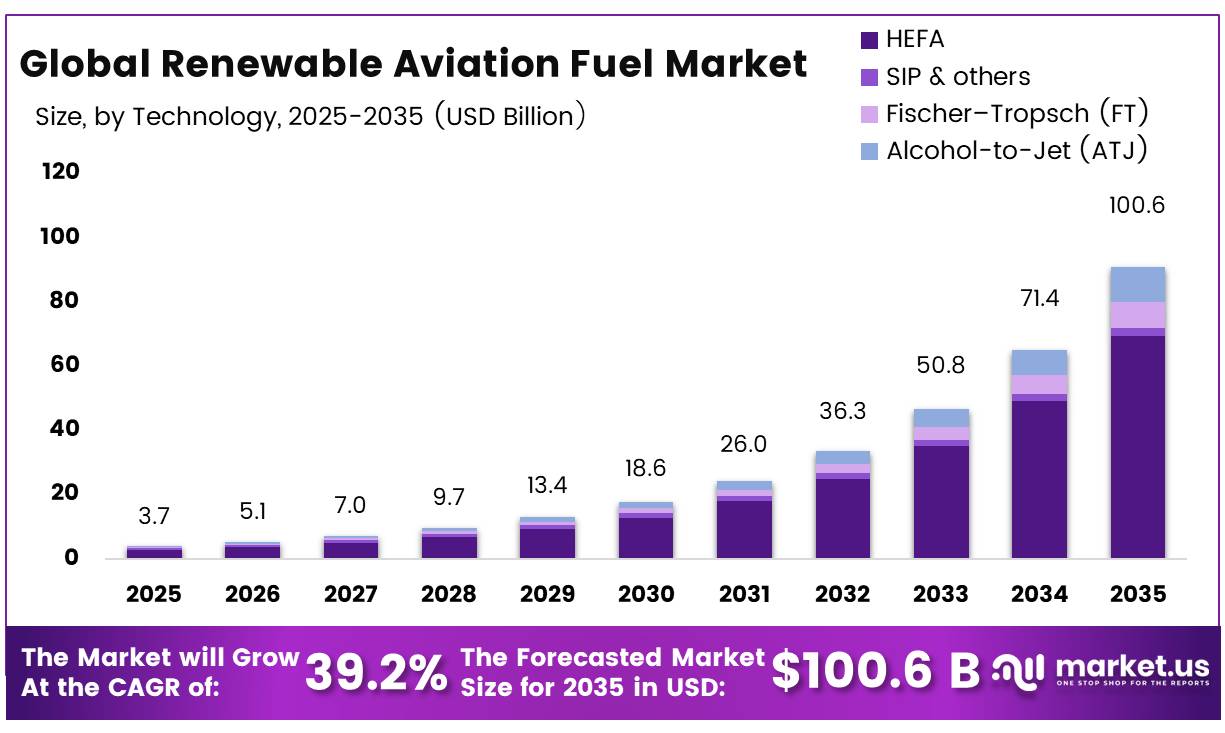
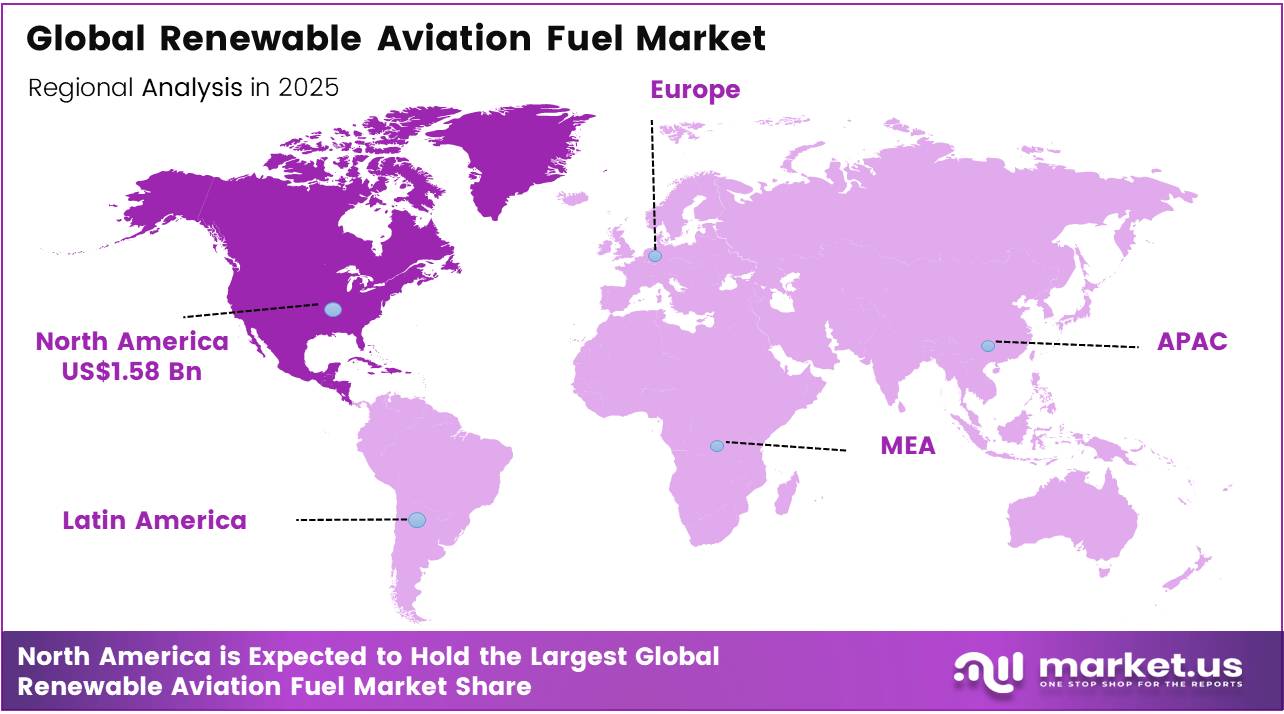
In 2025, the Global Renewable Aviation Fuel Market was valued at USD 3.7 billion, and between 2026 and 2035, this market is estimated to register a CAGR of 39.2%, reaching about USD 100.6 billion by 2035. In 2025, North America held a dominant market position, capturing more than a 42.2% share, holding USD 1.58 Billion revenue.
Renewable aviation fuel, commonly known as sustainable aviation fuel, is a drop-in energy product manufactured from waste oils, agricultural residues, municipal waste, renewable biomass or synthetic pathways using renewable hydrogen and captured carbon. It can use existing aircraft engines, airport storage systems and distribution infrastructure after meeting approved fuel standards. Its strategic importance is increasing because aviation contributes approximately 2% of global human-produced carbon dioxide emissions, while long-distance aircraft continue to depend on energy-dense liquid fuels.
- IATA reported that global SAF output reached 1.9 million tonnes in 2025, equal to 0.6% of jet-fuel consumption, while 2026 production is projected at 2.4 million tonnes, or 0.8%.
- IATA estimated that the SAF premium added USD 3.6 billion to airline fuel costs in 2025, with SAF costing more than twice conventional jet fuel.
- Policy mandates are therefore shaping demand. The European Union requires a 2% SAF share from 2025, rising to 70% by 2050. The United Kingdom mandate also began at 2% in 2025, increasing to 10% in 2030 and 22% in 2040.
Government mandates are creating more predictable demand. The European Union introduced a minimum 2% SAF share in 2025, increasing to 6% in 2030 and 70% in 2050. EASA reported that 193 kilotonnes of SAF supplied during its baseline assessment achieved an average 91% lifecycle emissions reduction and avoided approximately 714 kilotonnes of carbon-dioxide-equivalent emissions. The United Kingdom also introduced a 2% obligation in 2025, equal to approximately 230,000 tonnes, with targets of 10% in 2030 and 22% in 2040.
- Public financing is supporting production expansion. In January 2025, the U.S. Department of Energy closed a USD 1.67 billion loan guarantee for Montana Renewables, consisting of USD 1.44 billion in principal and USD 233 million in capitalized interest.
Future growth opportunities lie in advanced biofuels, power-to-liquid fuels, renewable hydrogen, carbon capture, and dedicated refining capacity. IATA indicates that around 500 million tonnes of annual SAF supply may be required by 2050, creating substantial worldwide investment and development potential across feedstocks, conversion technologies, logistics, certification, and long-term airline offtake agreements.
Key Takeaways
- The global Renewable Aviation Fuel market was valued at USD 3.7 billion in 2025.
- The global market is projected to grow at a CAGR of 39.20% and is estimated to reach USD 100.6 billion by 2035.
- On the basis of Technology, the By HEFA dominated the market, constituting 68.8% of the total market share.
- Based on the grade, the Used cooking oil & waste fats dominated the Renewable Aviation Fuel market, with a substantial market share of around 40.1%.
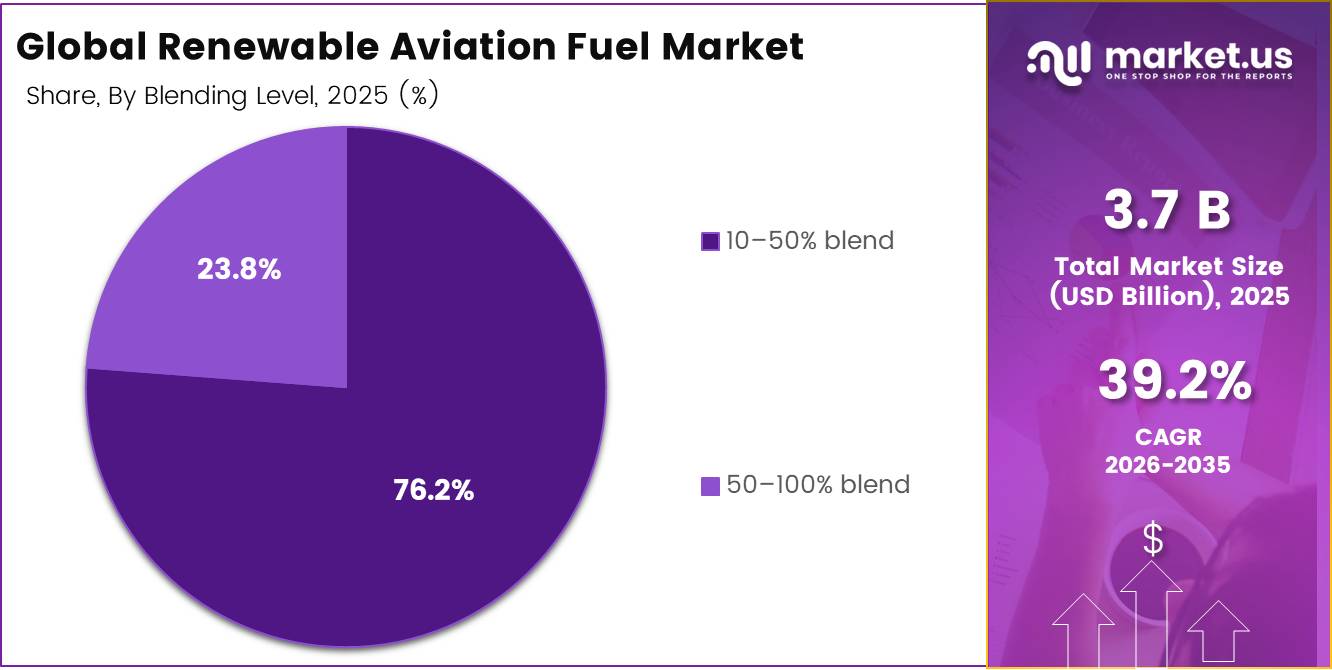
- Based on the Blending Level, 10–50% blend led the market, comprising 76.2% of the total market.
- Among the end-uses, the Commercial airlines held a major share in the Renewable Aviation Fuel market, 80.1% of the market share.
- In 2025, the North America was the most dominant region in the Renewable Aviation Fuel market, accounting for 42.2% of the total global consumption.
Technology Analysis
HEFA represents dominant Segment in the Market.
HEFA remained the leading renewable aviation fuel pathway in 2025, holding 68.8% of the market. Its leadership reflects mature processing technology, established lipid feedstock supply chains, and compatibility with existing refining infrastructure.
- The U.S. Energy Information Administration estimated that domestic SAF capacity, which covered only HEFA production at that stage, reached around 30,000 barrels per day in 2025. U.S. other-biofuels output, increasingly driven by SAF, rose from 33,000 barrels per day in January to 44,000 barrels per day in February. EIA expected this category to more than double during 2025 and expand by a further 20% in 2026.
Alcohol-to-Jet is the fastest-growing pathway as producers seek scalable alternatives based on ethanol and cellulosic materials. UK government modelling shows ATJ’s median production cost falling from £5,016 per tonne in 2025 to £2,627 per tonne in 2030 and £2,384 per tonne in 2040. This improving cost curve and wider feedstock availability support new capacity development and strengthen ATJ’s long-term potential as the industry diversifies beyond waste oils and fats.
Grade Analysis
Used cooking oil & waste fats a significant grade.
Used cooking oil and waste fats remained the leading renewable aviation fuel feedstock segment in 2025, holding a 40.1% of maket share. Their leadership is supported by established collection networks, proven HEFA processing, and the ability to use existing refinery infrastructure.
- EASA’s 2025 technical report found that used cooking oil represented 81.1% of SAF supplied in the European Union, while 69% of the feedstock originated outside the region. The reported SAF volumes delivered lifecycle savings of approximately 714 kilotonnes of CO₂ equivalent, demonstrating the environmental value of waste-based inputs. However, import dependence and limited waste-oil availability may encourage stronger traceability controsls and feedstock diversification.
Industrial CO₂ combined with green hydrogen is the fastest-growing feedstock route, driven by the need for scalable synthetic aviation fuels that do not depend on limited biological resources. In December 2025, the European Commission reported that more than 40 eSAF projects were awaiting final investment decisions, while 8 European countries joined an early-movers coalition to accelerate production and purchasing.
Blending Level Analysis
10-50% blend Is the Most Widely Used Blending Level.
The 10–50% blend segment held a dominant market position, capturing 76.2% of the market. Its leadership reflects established certification, compatibility with existing aircraft, and easy movement through conventional airport pipelines, storage tanks, and hydrant systems.
- The U.S. Department of Energy identifies 7 approved SAF production pathways and reports that airport tank farms commonly maintain fuel equal to 4–6 days of operations. This established distribution base makes lower blending levels practical for routine airline use without major aircraft or airport modifications.
The 50–100% blend segment is the fastest-growing category, supported by testing aimed at reducing dependence on fossil kerosene. NASA evaluated 4 fuel configurations, including unblended SAF, across 8 engine-thrust settings and completed more than 560 minutes of emissions sampling. The tests recorded lower soot emissions across the full engine-power range, strengthening the technical case for higher blending levels.
End Use Analysis
Renewable Aviation Fuel is mostly utilized in Commercial airlines
Commercial airlines held a dominant position in the renewable aviation fuel market, capturing an 80.1% share.The segment remains the largest consumer due to rising regulatory pressure, airline decarbonization targets, and global carbon-reduction programmes. ICAO’s CORSIA scheme entered its first phase in 2024, covering international aviation emissions and allowing the use of eligible sustainable aviation fuels to reduce offsetting obligations.
Defense and military aviation is the fastest-growing end-use segment, supported by government efforts to improve energy resilience and reduce operational dependence on conventional fuels. The U.S. Department of Defense has identified climate change as a national security concern and established a pathway toward achieving net-zero greenhouse gas emissions by 2050 across its operations.
Key Market Segments
By Technology
- HEFA
- SIP & others
- Fischer–Tropsch (FT)
- Alcohol‑to‑Jet (ATJ)
By Grade
- Used cooking oil & waste fats
- Industrial CO₂ + green H₂ (e‑fuels)
- Agricultural & forestry residues
- Algal biofuel
- Other waste‑derived oils/fats
By Blending Level
- 10–50% blend
- 50–100% blend
By End-use
- Commercial airlines
- Defense/military
- Business & corporate jets
- Others (cargo, UAVs)
Driver Analysis
Airline net-zero commitments and SAF as primary decarbonization lever structurally expand renewable aviation fuel demand
Global aviation fuel consumption is projected to exceed 400–450 million tonnes annually by the early 2030s as traffic grows, while IATA and multiple national strategies explicitly identify sustainable aviation fuel (SAF) as the “primary near‑term lever” for aviation decarbonization, with IATA estimating SAF could deliver around 65% of the sector’s emissions reductions needed for net‑zero by 2050.
In 2026, SAF production of about 2.4 million tonnes roughly 0.8% of total jet fuel demand illustrates both the early‑stage nature of the market and the magnitude of the runway if airlines convert their 2050 net‑zero commitments into staged SAF procurement trajectories that might require 10–20% SAF blending by the mid‑2030s and 50%+ by mid‑century, implying multi‑hundred‑million‑tonne annual SAF requirements under aggressive pathways.
Drivers Impact Analysis
| Driver | (~) % Impact on CAGR Forecast | Geographic Relevance | Impact Timeline |
|---|---|---|---|
| Airline net-zero commitments and SAF as primary decarbonization lever structurally expand renewable aviation fuel demand | +2.6% | North America core, EU, UK, developed APAC, GCC hubs | Long term (≥ 4 years) |
| EU Fit-for-55, CORSIA phases, and national SAF blending mandates create enforceable compliance demand for renewable aviation fuel | +2.4% | EU regulatory hubs, UK, North America, early-mover APAC | Medium term (2-4 years) |
| Scale-up of SAF production capacity, HEFA/FT/ATJ pathways, and flexible biorefinery configurations steadily reduce unit costs | +2.1% | North America, EU, Brazil, Middle East, Southeast Asia | Long term (≥ 4 years) |
| Tax credits, subsidies, and carbon price escalation improve SAF project IRRs and de-risk large-scale renewable fuel investments | +2.0% | U.S. core, EU ETS zones, UK, Canada, select APAC | Short to medium term (≤ 4 years) |
| Corporate and cargo customer willingness to pay green premiums accelerates airline SAF offtake and long-term contract depth | +1.8% | North America, EU, global trade lanes | Short term (≤ 2 years) |
| Airport and fuel-supply infrastructure adaptation for SAF blends enables wider operational deployment and routinized usage | +1.6% | Global hub airports, regional blend terminals | Medium term (2-4 years) |
Restraint Analysis
High SAF production cost premium vs fossil jet
Multi‑stage SAF processes require additional hydrogen, upgrading, and quality control compared with conventional jet refining, and several techno‑economic studies identify high capex intensity, feedstock preprocessing, and limited plant scale as drivers of elevated levelized costs; this means that, in 2026, SAF is still often roughly 2–3× more expensive than fossil jet on an energy‑equivalent basis in many markets, making it economically viable only when combined with strong subsidies, mandates, or voluntary green premia from corporate customers.
For airlines operating on thin net margins, absorbing even a 10–20% blended fuel cost increase is untenable at scale, so SAF usage is rationed to mandated minimums, demonstration flights, and niche corporate programs, with discretionary adoption limited to segments where passengers or shippers show willingness to pay this materially constrains addressable demand and forces producers to underutilize existing capacity or delay FIDs on new plants.
As a result, high cost premia are modeled to shave roughly 2.7 percentage points from the otherwise achievable market CAGR, and this restraint is likely to persist beyond four years, only gradually easing as larger plants, technology learning curves, and cheaper low‑carbon hydrogen inputs bring SAF costs closer to jet fuel parity.
Restraint Impact Analysis
| Restraint | (~) % Impact on CAGR Forecast | Geographic Relevance | Impact Timeline |
|---|---|---|---|
| High SAF production cost premium vs fossil jet | -2.7% | North America core, EU, global long-haul hubs | Long term (≥ 4 years) |
| Limited sustainable feedstock availability and competition | -2.4% | EU, North America, Brazil, Southeast Asia | Long term (≥ 4 years) |
| Slow certification and pathway approval processes | -2.0% | Global, especially new SAF routes in OECD markets | Medium term (2-4 years) |
| Underdeveloped SAF logistics, blending, and storage networks | -1.9% | APAC corridors, emerging markets, secondary airports | Medium term (2-4 years) |
| Policy and regulatory uncertainty beyond 2030 | -1.8% | North America, EU, key APAC governments | Medium term (2-4 years) |
| Competing capital claims and execution risk for large SAF projects | -1.7% | Global project finance hubs, especially U.S. and EU | Long term (≥ 4 years) |
Opportunity Analysis
Power-to-liquid e-SAF from surplus renewables
This constitutes a future opportunity rather than a current driver because power‑to‑liquid (PtL) and electrofuel‑based SAF remains at pilot and early‑demo scale in 2026, while multiple techno‑economic assessments suggest that renewable‑powered pathways using green hydrogen and captured CO₂ could reduce well‑to‑wake emissions by 95–98% and eventually unlock very large synthetic SAF volumes once cheap surplus renewables are widely available.
Today, commercial SAF production is dominated by HEFA and some FT fuels, and SAF still accounts for below 1% of global aviation fuel consumption, but as solar, wind, and storage build‑outs in regions like the EU, U.S., Middle East, and Australia create frequent multi‑GW surpluses with near‑zero marginal power prices, PtL plants could scale to multi‑hundred‑kiloton levels per site by 2030–2035, especially if dedicated 5–10 GW renewable clusters are coupled to 500–1,000 MW electrolyzer hubs targeting synthetic fuels; even modest success in this direction say, 20–30 new e‑SAF plants globally by 2035 at 0.3–0.5 Mt/year each—would add tens of millions of tonnes of additional SAF capacity beyond what bio‑based feedstocks alone can provide.
Because these volumes are almost entirely absent from current base‑case supply curves that focus on biomass pathways, successful PtL scale‑up could realistically add around 2.5 percentage points of CAGR upside by 2035 through a combination of new synthetic fuel projects, load‑balancing value for power markets, and premium pricing tied to near‑zero lifecycle emissions, fundamentally expanding the total addressable market rather than just re‑allocating share within existing SAF technologies.
Opportunity Impact Analysis
| Opportunity | (~) % Potential CAGR Upside | Geographic Relevance | Execution Window |
|---|---|---|---|
| Power-to-liquid e-SAF from surplus renewables | +2.5% | EU, UK, U.S., Middle East, Australia | Long term (≥ 4 years) |
| Integrated airline–SAF JV platforms and equity offtake models | +2.1% | North America core, EU majors, Gulf carriers | Medium term (2-4 years) |
| SAF-linked financial products and in-sector carbon credits | +1.9% | Global financial hubs, EU ETS zones, U.S. | Medium term (2-4 years) |
| M&A roll-ups of mid-tier SAF and advanced biofuel developers | +1.8% | North America, EU, Brazil, Southeast Asia | Medium term (2-4 years) |
| Expansion into regional, business, and eVTOL aviation segments | +1.7% | North America, EU, APAC emerging markets | Long term (≥ 4 years) |
| Global SAF-ready airport and pipeline network build-out as a service | +1.6% | Major hubs and secondary airports worldwide | Medium term (2-4 years) |
Challenges Analysis
Infrastructure segregation and quality assurance complexity
SAF supply and infrastructure forums highlight issues such as segregation requirements for different pathways, multiple blending points, and the need for dedicated tanks and lines to avoid cross‑contamination, as well as intensive quality assurance procedures across the pipeline, storage, and airport hydration systems; in 2024, global SAF production capacity was about 4.4 Mt/year with a confirmed pipeline of roughly 7 Mt/year by 2030, but infrastructure readiness has lagged this capacity pipeline.
This complexity forces conservative utilization of SAF in some locations, limits rollout to airports and pipelines where infrastructure upgrades have been completed, and increases per‑tonne logistics costs, collectively exerting an estimated 1.0 percentage‑point friction drag on maximal CAGR until a broader network of SAF‑ready infrastructure and harmonized handling protocols is in place over a 2–4‑year mitigation horizon.
Challenges Impact Analysis
| Challenge | (~) % CAGR Friction Drag | Geographic Relevance | Mitigation Horizon |
|---|---|---|---|
| Complex multi-stage SAF processing | -1.6% | North America, EU, early-mover APAC | Long term (≥ 4 years) |
| Fragmented SAF supply chains | -1.5% | Global, esp. APAC and trans-Atlantic corridors | Medium term (2-4 years) |
| Evolving sustainability and tracking standards | -1.3% | EU regulatory hubs, U.S., UK | Long term (≥ 4 years) |
| Limited SAF technical and project talent | -1.2% | Global, acute in emerging markets | Long term (≥ 4 years) |
| Revenue and contract structure uncertainty | -1.1% | North America core, EU majors, global hubs | Medium term (2-4 years) |
| Infrastructure segregation and quality assurance complexity | -1.0% | Major airports, pipeline networks worldwide | Medium term (2-4 years) |
Geopolitical Impact Analysis
Geopolitical Competition and Policy Fragmentation Reshaping Renewable Aviation Fuel Supply.
Renewable aviation fuel is becoming a strategic asset as governments compete for refining capacity, feedstocks, and technology. In January 2025, the U.S. Department of Energy reported that SAF production reached 30 million gallons during the first three quarters of 2024. Announced projects represented more than 3 billion gallons of annual capacity and USD 44 billion in planned funding by 2030. Federal support included USD 151 million for 28 bioenergy projects and USD 249 million through the Federal Aviation Administration’s FAST programme. This investment strengthens U.S. energy security but may draw capital and skilled labour away from import-dependent markets.
- The United Kingdom is building a policy bloc around mandates, emissions trading, and project grants. Its government reported that aviation covered by the UK Emissions Trading Scheme produced about 9.0 million tonnes of carbon-dioxide-equivalent emissions in 2024, while the SAF supply obligation increased to 3.6% in 2026. Eligible fuel must deliver at least a 40% lifecycle emissions reduction against a fossil comparator of 89 grams of carbon-dioxide-equivalent per megajoule.
The Advanced Fuels Fund has allocated more than GBP 198 million, including GBP 63 million shared among 17 projects in July 2025. These incentives could fragment trade, influence plant locations, and intensify competition for waste feedstocks, renewable electricity, captured carbon, and green hydrogen.
Regional Analysis
North America Held the Largest Share of the Global Renewable Aviation Fuel Market.
North America held a dominant position in the renewable aviation fuel market, capturing a 42.2% share. Its leadership is supported by expanding production capacity, federal incentives, established airport infrastructure, and growing airline procurement.
- U.S. Department of Energy data show that domestic SAF consumption increased from 26.3 million gallons in 2023 to 111.86 million gallons in 2024, reflecting a sharp rise in commercial adoption. The fuel can also be blended and handled through existing aircraft and refuelling infrastructure, reducing the need for major airport modifications.
Asia Pacific is the fastest-growing regional market, driven by new blending policies, airport decarbonisation plans, and rising investment in regional fuel supply chains. Singapore introduced a 1% SAF uplift target for 2026, with an ambition to increase this to 3–5% by 2030. A mandatory levy applies from April 2026 for eligible flights departing from October 2026, creating a structured funding mechanism for centralised SAF procurement. These measures are expected to encourage additional refining, storage, blending, and renewable-feedstock projects across the region.
Key Regions and Countries Covered
- North America
- The US
- Canada
- Europe
- Germany
- France
- The UK
- Spain
- Italy
- Russia & CIS
- Rest of Europe
- APAC
- China
- Japan
- South Korea
- India
- ASEAN
- Rest of APAC
- Latin America
- Brazil
- Mexico
- Rest of Latin America
- Middle East & Africa
- GCC
- South Africa
- Rest of MEA
Key Players Analysis
Renewable aviation fuel producers focus on strengthening technology flexibility, production efficiency, and feedstock security to remain competitive. A major priority is continuous pathway development, including improvements in HEFA, Alcohol-to-Jet, Fischer–Tropsch, and power-to-liquid processes that can reduce lifecycle emissions while meeting strict aviation fuel standards. Companies are also expanding integrated refining capacity to improve conversion yields, lower operating costs, and support consistent commercial-scale output.
Vertical partnerships with waste collectors, agricultural suppliers, renewable hydrogen developers, and airport fuel distributors help secure long-term feedstock availability and reduce exposure to price volatility. Strategic plant expansion near major aviation hubs allows producers to shorten transport distances and align supply with airline demand. In addition, manufacturers place strong emphasis on certification, traceability, digital process control, and carbon-intensity measurement to ensure regulatory compliance. Long-term offtake agreements with airlines and airport operators further improve revenue visibility, strengthen customer relationships, and support financing for new production facilities across high-growth regional markets.
The Major Players In The Industry
- Neste Corporation
- World Energy
- LanzaJet
- SkyNRG
- Gevo, Inc.
- TotalEnergies SE
- Shell plc
- OMV Aktiengesellschaft
- Alder Fuels
- Red Rock Biofuels
- Aemetis, Inc
- Velocys plc
- Eni S.p.A.
- BP plc (including Air BP)
- Repsol S.A.
- Others
Key Development
- In February 2026, World Energy it signed a three-year agreement with Montana Renewables covering more than 70 million gallons of SAF, with the potential to avoid up to 600,000 metric tonnes of CO₂ emissions.
- In February 2026, LanzaJet secured USD 47 million in new capital toward a targeted USD 135 million equity round at a USD 650 million pre-money valuation.
- In July 2025, Neste Corporation agreed to supply DHL Express with 7,400 tonnes, or 9.5 million litres, of neat SAF at Singapore Changi Airport through June 2026, supporting five Boeing 777 freighters and 12 weekly departures.
- In August 2025, Eni S.p.A.’s enilive unit and LG Chem broke ground on South Korea’s first HVO-SAF plant, designed to process 400,000 tonnes of feedstock annually, with completion targeted for 2027.
- In September 2025, TotalEnergies began producing up to 15,000 tonnes of SAF per year at La Mède for Marseille-Provence Airport.
Report Scope
| Report Features | Description |
|---|---|
| Market Value (2025) | USD 3.7 Bn |
| Forecast Revenue (2035) | USD 100.6 Bn |
| CAGR (2026-2035) | 39.2% |
| Base Year for Estimation | 2025 |
| Historic Period | 2020-2024 |
| Forecast Period | 2026-2035 |
| Report Coverage | Revenue Forecast, Market Dynamics, Competitive Landscape, Recent Developments |
| Segments Covered | By Technology (HEFA, Fischer–Tropsch (FT), Alcohol‑to‑Jet (ATJ) and SIP & others), By Grade (Used cooking oil & waste fats, Agricultural & forestry residues, Algal biofuel, Industrial CO₂ + green H₂ (e‑fuels) and Other waste‑derived oils/fats), By Blending Level (10–50% blend and 50–100% blend), By End-use (Commercial airlines, Defense/military, Business & corporate jets and Others (cargo, UAVs)) |
| Regional Analysis | North America – The US & Canada; Europe – Germany, France, The UK, Spain, Italy, Russia & CIS, Rest of Europe; APAC– China, Japan, South Korea, India, ASEAN & Rest of APAC; Latin America– Brazil, Mexico & Rest of Latin America; Middle East & Africa– GCC, South Africa, & Rest of MEA |
| Competitive Landscape | Neste Corporation, World Energy, LanzaJet, SkyNRG, Gevo, Inc., TotalEnergies SE, Shell plc, OMV Aktiengesellschaft, Alder Fuels, Red Rock Biofuels, Aemetis, Inc, Velocys plc, Eni S.p.A., BP plc (including Air BP), Repsol S.A., Others. |
| Customization Scope | Customization for segments, region/country-level will be provided. Moreover, additional customization can be done based on the requirements. |
| Purchase Options | We have three licenses to opt for: Single User License, Multi-User License (Up to 5 Users), Corporate Use License (Unlimited Users and Printable PDF) |





































