


Report Overview
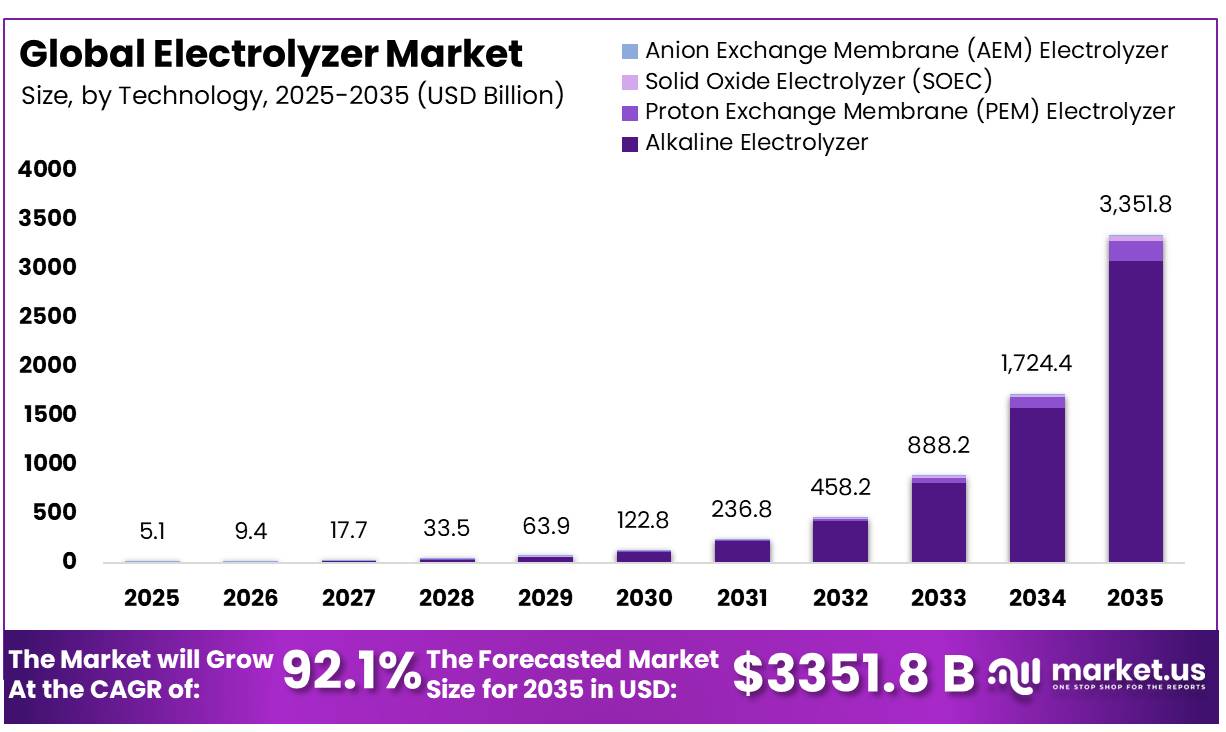
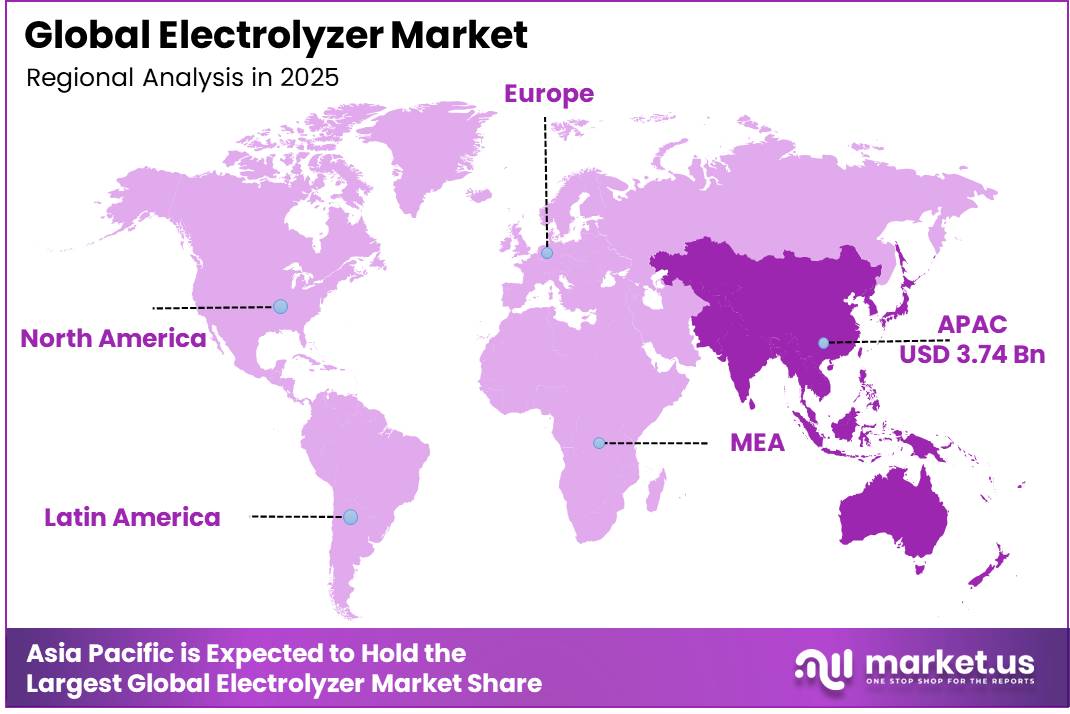
In 2025, the Global Electrolyzer Market was valued at USD 5.1 billion, and between 2026 and 2035, this market is estimated to register a CAGR of 92.1%, reaching about USD 3351.8 billion by 2035. In 2025, Asia Pacific led the market, achieving over 73.40% share with a revenue of USD 3.74 Billion.
Electrolyzers are critical energy-sector technologies that produce hydrogen through the electrolysis of water, using electricity to separate water into hydrogen and oxygen. As governments and industries intensify efforts to decarbonize energy systems, electrolyzers have become a key enabler of low-carbon and renewable hydrogen production. The technology is increasingly viewed as an essential component of the global energy transition because it supports the integration of renewable power, long-duration energy storage, and the decarbonization of hard-to-abate sectors.
- According to the International Energy Agency (IEA), global electrolyzer manufacturing capacity exceeded 40 GW per year in 2024 based on committed and under-construction projects. The rapid scale-up reflects growing industrial investment and accelerating development across the hydrogen value chain.
Key Takeaways
- The Global Electrolyzer Market was valued at USD 5.1 billion in 2025.
- The market is projected to grow at a CAGR of 92.1% and is estimated to reach USD 3351.8 billion by 2035.
- Alkaline Electrolyzer is the dominant technology, accounting for 91.93% of the market in 2025, driven by its proven large-scale industrial deployment track record and lower capital cost relative to PEM technology.
- 500 kW – 2 MW is the dominant capacity class at 45.00%, anchored by mid-scale industrial hydrogen production and renewable energy integration applications.
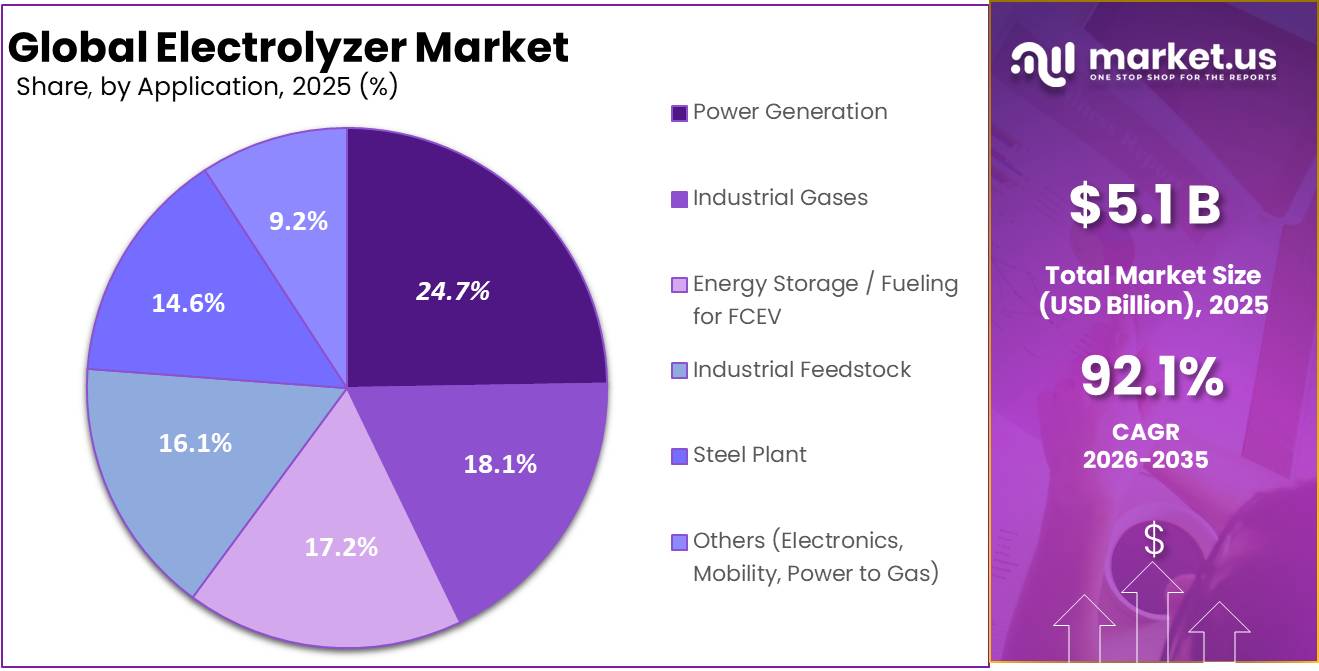
- Power Generation is dominant application, accounting for 24.73% of the electrolyzer market share in 2025.
- Asia Pacific holds the largest regional share at 73.40%, driven by China’s dominant position in both electrolyzer manufacturing and green hydrogen project deployment.
The rapid expansion of renewable energy generation is increasing the availability of low-carbon electricity required for green hydrogen production. Growing renewable penetration is improving the economics of electrolysis and enabling large-scale hydrogen production projects.
- According to the International Renewable Energy Agency (IRENA), global renewable power capacity increased by 585 gigawatts (GW) in 2024, representing the largest annual addition ever recorded. This growth brought total installed renewable energy capacity worldwide to approximately 4,448 GW by the end of 2024.
Hydrogen demand is expected to expand across energy-intensive industries including steel, refining, ammonia, methanol, aviation fuels, shipping fuels, and grid-scale energy storage. The European Commission’s Hydrogen Bank has introduced funding mechanisms to accelerate renewable hydrogen deployment and improve project economics across the region. As technology efficiency improves, capital costs decline, and renewable electricity deployment continues to expand, electrolyzers are expected to become a cornerstone of the global clean energy ecosystem, supporting energy security, emissions reduction, and long-term industrial sustainability.
Electrolyzer Market Segmentation
Technology Analysis
Alkaline Electrolyzer dominates market due to its commercial maturity and large-scale deployment advantages.
In 2025, Alkaline Electrolyzer held a dominant market position, capturing a 91.93% share of the Electrolyzer Market by technology. The segment’s strong position was supported by its long-established presence in industrial hydrogen production and its proven reliability across large-scale applications. Alkaline electrolyzer systems have been widely adopted by energy producers, chemical manufacturers, and industrial users because of their established operating history and ability to support high-volume hydrogen generation.
Proton Exchange Membrane (PEM) Electrolyzer is the fastest-growing segment in 2025 within the Electrolyzer Market by technology, due to its ability to operate efficiently under variable power conditions, making it well suited for integration with renewable energy sources such as wind and solar. Its fast response time and compact system design supported growing adoption across green hydrogen projects where operational flexibility is a key requirement.
Capacity Analysis
500 kW – 2 MW capacity range leads market as industries favor mid-scale hydrogen production systems.
In 2025, 500 kW – 2 MW held a dominant market position, capturing more than a 45.00% share of the Electrolyzer Market by capacity. The segment maintained its leading position due to its suitability for a wide range of commercial and industrial hydrogen production applications. These systems offered a practical balance between production capacity, installation requirements, and operational flexibility, making them attractive for businesses entering the hydrogen value chain.
The ≤ 500 Kw is the fastest-growing segment in the Electrolyzer Market by capacity. The segment witnessed increased adoption as organizations sought compact and flexible hydrogen production solutions for pilot projects, research facilities, distributed energy systems, and small commercial applications. These electrolyzers offered advantages in terms of easier installation, lower upfront investment, and suitability for locations with limited space or hydrogen demand.
Application Analysis
Power Generation leads as hydrogen gains importance in energy storage and grid support.
In 2025, Power Generation held a dominant market position capturing 24.73% share of the Electrolyzer Market by application. The segment’s leadership was supported by the growing use of electrolyzers in producing green hydrogen for energy storage and electricity generation purposes. Power utilities and energy developers increasingly integrated hydrogen into their strategies to manage renewable energy variability and improve grid flexibility.
Industrial Gases is the fastest-growing segment in the Electrolyzer Market by application. The segment experienced strong growth as industries increasingly adopted electrolyzer-based hydrogen production to support decarbonization goals and reduce reliance on conventional hydrogen manufacturing methods. Industrial gas producers expanded investments in green hydrogen facilities to meet growing demand from sectors such as chemicals, refining, electronics, and metal processing.
Key Market Segments
By Technology
- Alkaline Electrolyzer
- Proton Exchange Membrane (PEM) Electrolyzer
- Solid Oxide Electrolyzer (SOEC)
- Anion Exchange Membrane (AEM) Electrolyzer
By Capacity
- 500 kW – 2 MW
- ≤ 500 kW
- Above 2 MW
By Application
- Power Generation
- Industrial Gases
- Energy Storage / Fueling for FCEV
- Industrial Feedstock
- Steel Plant
- Others (Electronics, Mobility, Power to Gas)
Driver Analysis
Subsidy-backed hydrogen offtake formation via auctions and production credits
The single strongest 2026 demand catalyst is not pure technology progress but revenue visibility created by public support frameworks that convert speculative hydrogen projects into financeable electrolyzer orders. In Europe, Innovation Fund hydrogen auctions pay a fixed premium per kilogram for up to 10 years, and the Commission had already launched the IF24 auction in December 2024 while planning another hydrogen auction with up to €1 billion before end-2025; the first EU auction previously allocated €720 million to seven projects, with average winning bids around €0.40/kg against a €4.50/kg ceiling, showing that even relatively modest production support can unlock project competition and price discovery.
In the U.S., the 45V framework gives up to $0.60/kg base credit and up to $3.00/kg with prevailing wage and apprenticeship compliance for 10 years, materially narrowing the green hydrogen premium and improving debt-service coverage for electrolyzer-backed plants. India is adding a manufacturing-side layer through ₹44.4 billion of electrolyzer incentives under SIGHT Component I Tranche II, creating domestic equipment pull that complements project development. Strategically, these mechanisms shift the business model from merchant hydrogen speculation toward contracted, compliance-qualified production, which shortens customer payback assumptions, reduces equity return thresholds, and makes OEM pipelines more convertible into signed EPC and supply agreements.
Drivers Impact Analysis
| Driver | (~) % Impact on CAGR Forecast | Geographic Relevance | Impact Timeline |
|---|---|---|---|
| Subsidy-backed hydrogen offtake formation via auctions and production credits | +2.8% | EU core, North America core, India emerging, Middle East spill-over | Short term (≤ 2 years) |
| Manufacturing scale-up and localization incentives lowering delivered system cost | +2.3% | China core, EU, India, North America | Medium term (2-4 years) |
| Final investment decision conversion in ammonia, refining, steel and e-fuels projects | +2.1% | EU, Middle East, Australia, North America, India | Short term (≤ 2 years) |
| Renewable power price compression improving green hydrogen unit economics | +1.9% | MENA, Australia, India, Iberia, Latin America, U.S. renewables belts | Medium term (2-4 years) |
| Efficiency gains and stack performance upgrades increasing bankability | +1.6% | Global, with strongest pull in EU, Japan, South Korea, North America | Medium term (2-4 years) |
| Certification, emissions accounting and compliance rules forcing technology-qualified deployment | +1.4% | EU, U.S., selected APAC export corridors | Short term (≤ 2 years) |
Restraint Analysis
Green H2 price gap
The primary restraint remains the uneconomic spread between renewable hydrogen and incumbent grey hydrogen, because electrolyzer demand only converts from announcements to firm orders when project IRRs clear financing thresholds; in Europe, renewable hydrogen production was still cited at around EUR 6.7/kg in 2024 on one recent market estimate, while conventional SMR was about EUR 3.3/kg, implying a roughly EUR 3.4/kg deficit before compression, storage, transport, and merchant margins are layered in, and that spread can push payback from roughly 7–9 years toward 11–14 years for merchant-scale projects, forcing developers to defer final investment decisions, resize electrolyzer trains, or sequence CapEx into smaller modules rather than commit to full 100–500 MW platforms.
Restraint Impact Analysis
| Restraint | (~) % Impact on CAGR Forecast | Geographic Relevance | Impact Timeline |
|---|---|---|---|
| Green H2 price gap | -3.0% | EU core, North America, Japan, Korea | Short term (≤ 2 years) |
| Power & grid bottlenecks | -2.4% | EU, North America, India, MENA buildouts | Medium term (2-4 years) |
| H2 infra lag | -2.1% | EU corridors, North America hubs, APAC import chains | Medium term (2-4 years) |
| Critical material scarcity | -1.8% | North America, EU, Japan | Medium term (2-4 years) |
| Policy delay & weak offtake | -2.3% | EU, North America, APAC | Short term (≤ 2 years) |
| China overcapacity price war | -1.6% | EU manufacturing base, U.S. OEMs, Japan/Korea | Long term (≥ 4 years) |
Opportunity Analysis
Oxygen and heat co-product monetization
This qualifies as future upside rather than a current driver because most market forecasts still value electrolyzer projects primarily on hydrogen output, while IEA assumptions explicitly exclude oxygen revenues from cost analysis, leaving a monetization gap for operators located near wastewater, glass, steel, chemicals, aquaculture, and medical-gas demand nodes. In practice, capturing oxygen and low-grade heat can improve project EBITDA margins by an estimated 4% to 9%, lower effective hydrogen production cost by $0.15 to $0.45 per kg in favorable cluster settings, and shorten payback by 1 to 3 years for mid-scale systems, especially in Europe and coastal industrial zones where by-product utilization can be contracted under multi-utility service agreements instead of treated as non-core process output.
Opportunity Impact Analysis
| Opportunity | (~) % Potential CAGR Upside | Geographic Relevance | Execution Window |
|---|---|---|---|
| Hydrogen-as-a-Service platforms | +2.8% | North America core, EU, GCC, India | Short term (≤ 2 years) |
| Emerging-market project localization | +2.4% | MENA, Latin America, India, Sub-Saharan Africa | Medium term (2-4 years) |
| Oxygen and heat co-product monetization | +1.6% | EU, China, North America industrial clusters | Short term (≤ 2 years) |
| Brownfield industrial retrofits | +2.1% | EU, North America, Japan, Korea | Medium term (2-4 years) |
| Modular distributed off-grid systems | +1.9% | Australia, Chile, Namibia, Saudi Arabia, remote APAC | Medium term (2-4 years) |
| Roll-up of distressed developers and EPC stacks | +3.0% | Europe, North America, APAC selective | Short term (≤ 2 years) |
Challenges Analysis
Critical metals intensity
Electrolyzer OEMs are structurally exposed to constrained supplies of iridium, platinum, nickel and high‑grade graphite, with PEM stacks typically requiring 0.3–0.7 grams of iridium per kilowatt and alkaline designs reliant on nickel loadings that push total stack material costs 15–25% above 2020 baselines even after process learning, creating an enduring raw‑material drag that trims achievable sector CAGR by an estimated 1.4 percentage points versus unconstrained growth. With China holding more than 40% of global electrolyzer manufacturing capacity and a dominant position in PGM and nickel refining, European and North American OEMs face 3–7 month lead times for some catalysts and coatings, 8–12% quarterly price volatility on key inputs, and single‑supplier concentration risks on critical membrane and coated plate lines.
This metals intensity forces developers to over‑specify contingencies in EPC contracts (often 5–10% material cost buffers), complicates bankability assumptions for multi‑gigawatt pipelines projected to push global electrolyzer capacity from roughly 1–2 GW installed in 2023 to several hundred gigawatts by 2030, and limits how far levelized hydrogen costs can fall below 3–4 USD/kg in high‑risk jurisdictions despite rapid system price declines. Strategically, market leaders must accelerate substitution pathways (iridium thrifting of 60–80%, non‑PGM catalysts, nickel‑lean electrodes), expand dual‑sourcing of membranes and plates across at least two regions, and tie up 5–10 year offtake‑linked supply contracts so that stack cost learning curves are not repeatedly reset by metals price spikes, a process likely to require more than four years of R&D, qualification and supply chain restructuring to fully normalize.
Challenges Impact Analysis
| Challenge | (~) % CAGR Friction Drag | Geographic Relevance | Mitigation Horizon |
|---|---|---|---|
| Critical metals intensity | -1.4% | EU, North America, China, Japan | Long term (≥ 4 years) |
| Capex–opex cost overhang | -1.7% | EU industrial hubs, North America, MENA | Medium term (2-4 years) |
| Manufacturing scale-up volatility | -1.2% | China, EU, North America, India | Medium term (2-4 years) |
| Grid and renewables mismatch | -1.5% | EU, North America, India, Latin America | Long term (≥ 4 years) |
| Project development bottlenecks | -1.0% | EU regulatory hubs, North America, Australia | Short term (≤ 2 years) |
| Specialized talent shortfall | -0.8% | EU, North America, GCC, India | Long term (≥ 4 years) |
Geopolitical Impact Analysis
Geopolitical Conflicts Accelerating Demand for Energy Security Solution.
Recent geopolitical conflicts, particularly the ongoing Russia–Ukraine war and escalating tensions across parts of the Middle East, have had a significant influence on the global electrolyzer market. These events have reinforced concerns about energy security and dependence on imported fossil fuels, prompting many countries to accelerate investments in renewable energy and hydrogen infrastructure. As a result, electrolyzers have gained greater strategic importance as governments seek to strengthen domestic clean energy production and reduce exposure to fuel supply disruptions.
The Russia–Ukraine conflict has encouraged European nations to diversify energy sources and expand renewable hydrogen initiatives. Programs such as the European Union’s REPowerEU strategy have increased focus on green hydrogen production, creating additional demand for electrolyzer installations. At the same time, geopolitical uncertainties have affected global supply chains for critical materials, components, and manufacturing equipment used in electrolyzer systems. Delays in logistics, higher transportation costs, and fluctuations in raw material prices have increased project development expenses in several regions.
Middle East tensions have also contributed to energy market volatility, leading governments and industries to prioritize long-term energy resilience. This environment has strengthened interest in domestically produced hydrogen as a reliable energy carrier. While short-term challenges such as inflationary pressures and supply chain constraints remain, geopolitical instability is generally accelerating the shift toward clean energy technologies.
Regional Analysis
Asia-Pacific dominates market supported by strong hydrogen and renewable energy development.
In 2025, Asia-Pacific held the dominant position in the global Electrolyzer Market, accounting for 73.40% of the market and generating approximately USD 3.74 billion in revenue. The region’s leadership is driven by extensive investments in hydrogen production, large-scale renewable energy deployment, and a strong manufacturing ecosystem for electrolyzer technologies. The presence of major electrolyzer manufacturers and expanding hydrogen infrastructure projects has enabled Asia-Pacific to establish itself as the leading regional market.
According to the International Renewable Energy Agency (IRENA), Asia remained the largest contributor to global renewable energy additions, supporting the development of low-carbon hydrogen projects across the region.
Europe represents the second-largest regional market backed by the European Hydrogen Bank, national hydrogen strategies across Germany, France, Spain, and the Netherlands, and active large-scale project deployment including Moeve’s 300 MW Onuba project, Shell’s 200 MW Rotterdam facility, and H2 Green Steel’s 740 MW Boden plant.
North America is the fastest-growing developed-country market, supported by U.S. DOE hydrogen hub funding and the Inflation Reduction Act’s clean hydrogen production tax credits. The Middle East anchored by the NEOM project’s 2.2 GW facility in Saudi Arabia represents the most advanced single-project electrolyzer deployment globally. Latin America remains an early-stage market with significant future potential across renewable energy-rich geographies.
Key Regions and Countries Covered
- North America
- The US
- Canada
- Europe
- Germany
- France
- The UK
- Spain
- Italy
- Russia & CIS
- Rest of Europe
- APAC
- China
- Japan
- South Korea
- India
- ASEAN
- Rest of APAC
- Latin America
- Brazil
- Mexico
- Rest of Latin America
- Middle East & Africa
- GCC
- South Africa
- Rest of MEA
Key Players Analysis
The global electrolyzer market demonstrates a moderately consolidated and oligopolistic competitive structure, where a relatively small group of established companies holds a significant share of commercial projects and large-scale hydrogen infrastructure developments. Market leadership is largely determined by technological expertise, manufacturing scale, product reliability, and the ability to secure long-term supply agreements with industrial and energy sector customers. As hydrogen becomes an increasingly important component of global decarbonization strategies, leading manufacturers are expanding production capacity and strengthening their international presence.
The competitive landscape is characterized by strategic partnerships, manufacturing expansions, technology advancements, and participation in large-scale hydrogen projects. Established players benefit from proven technologies, strong engineering capabilities, and extensive industry relationships. While new entrants and regional suppliers continue to emerge, the market remains largely influenced by a handful of major companies capable of supporting gigawatt-scale projects. This competitive environment is expected to persist as demand for green hydrogen and electrolyzer installations continues to expand globally.
The Major Players In The Industry
- thyssenkrupp nucera AG
- Siemens Energy AG
- John Cockerill Group
- Nel ASA
- Cummins Inc.
- ITM Power PLC
- McPhy Energy S.A.
- HydrogenPro ASA
- Plug Power Inc.
- LONGi Green Energy Technology Co., Ltd.
- Asahi Kasei Corporation
- Linde plc
- Bloom Energy Corporation
- Sunfire GmbH
- PERIC Hydrogen Technologies Co., Ltd.
- Others
Key Development
- In May 2026, John Cockerill Group officially entered the execution phase of the 20-megawatt Djewels green hydrogen project in Delfzijl, Netherlands, confirming its advanced high-pressure alkaline electrolyzer technology stack will be supplied via Rely as the engineering, procurement, and construction (EPC) partner.
- In April 2026, Bloom Energy Corporation finalized a massive expansion of its strategic partnership with Oracle to power next-generation AI and cloud computing infrastructure data centers, signing a master services agreement to deploy up to 2.8 gigawatts (GW) of solid oxide fuel cell and energy technology systems.
Report Scope
| Report Features | Description |
|---|---|
| Market Value (2025) | USD 5.1 Bn |
| Forecast Revenue (2035) | USD 3351.8 Bn |
| CAGR (2026-2035) | 92.1% |
| Base Year for Estimation | 2025 |
| Historic Period | 2020-2024 |
| Forecast Period | 2026-2035 |
| Report Coverage | Revenue Forecast, Market Dynamics, Competitive Landscape, Recent Developments |
| Segments Covered | By Technology (Alkaline Electrolyzer, Proton Exchange Membrane (PEM) Electrolyzer, Solid Oxide Electrolyzer (SOEC), and Anion Exchange Membrane (AEM) Electrolyzer), By Capacity (500 kW – 2 MW, ≤ 500 kW, and Above 2 MW), By Application (Power Generation, Industrial Gases, Energy Storage / Fueling for FCEV, Industrial Feedstock, Steel Plant, and Others (Electronics, Mobility, Power to Gas)) |
| Regional Analysis | North America – The US & Canada; Europe – Germany, France, The UK, Spain, Italy, Russia & CIS, Rest of Europe; APAC– China, Japan, South Korea, India, ASEAN & Rest of APAC; Latin America– Brazil, Mexico & Rest of Latin America; Middle East & Africa– GCC, South Africa, & Rest of MEA |
| Competitive Landscape | thyssenkrupp nucera AG, Siemens Energy AG, John Cockerill Group, Nel ASA, Cummins Inc., ITM Power PLC, McPhy Energy S.A., HydrogenPro ASA, Plug Power Inc., LONGi Green Energy Technology Co., Ltd., Asahi Kasei Corporation, Linde plc, Bloom Energy Corporation, Sunfire GmbH, PERIC Hydrogen Technologies Co., Ltd., Others |
| Customization Scope | Customization for segments, region/country-level will be provided. Moreover, additional customization can be done based on the requirements. |
| Purchase Options | We have three licenses to opt for: Single User License, Multi-User License (Up to 5 Users), Corporate Use License (Unlimited Users and Printable PDF) |





































