
Quick Navigation
Report Overview
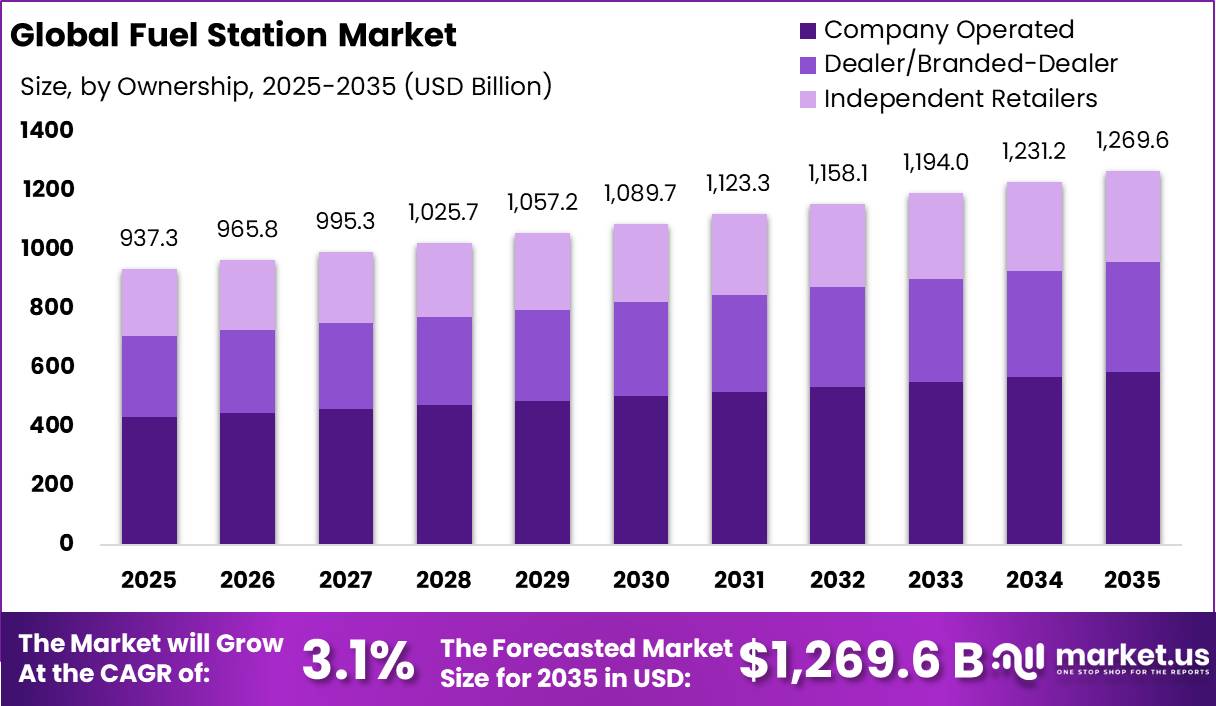
The Global Fuel Station Market size is expected to be worth around USD 1,269.6 Billion by 2035, from USD 937.3 Billion in 2025, growing at a CAGR of 3.1% during the forecast period from 2026 to 2035. In 2025, North America held a dominant market position, capturing more than a 38.6% share, holding USD 361.6 Billion revenue.
The global fuel station industry remains a critical mobility and energy-retail infrastructure sector, serving private vehicles, commercial fleets, logistics, aviation-linked road transport, and agricultural machinery users. In 2025, the industry is being reshaped by stable petroleum demand, convenience retail expansion, EV charging integration, and biofuel blending.
- The IEA notes that Oil 2025 assesses oil supply, demand, refining and trade dynamics through 2030, while the EIA projects global liquid-fuels demand growth toward 105.6 million barrels/day in 2027 after 2026 disruptions. Global oil demand still supports station traffic, as the IEA reported oil consumption rose by 0.8% in 2024 to 193 EJ, while road transport represents about 45% of global oil demand.
Key Takeaways
- Fuel Station Market size is expected to be worth around USD 1,269.6 Billion by 2035, from USD 937.3 Billion in 2025, growing at a CAGR of 3.1%.
- Gasoline/Petrol held a dominant market position, capturing more than a 35.2% share in the Fuel Station Market.
- Company Operated held a dominant market position, capturing more than a 46.2% share in the Fuel Station Market.
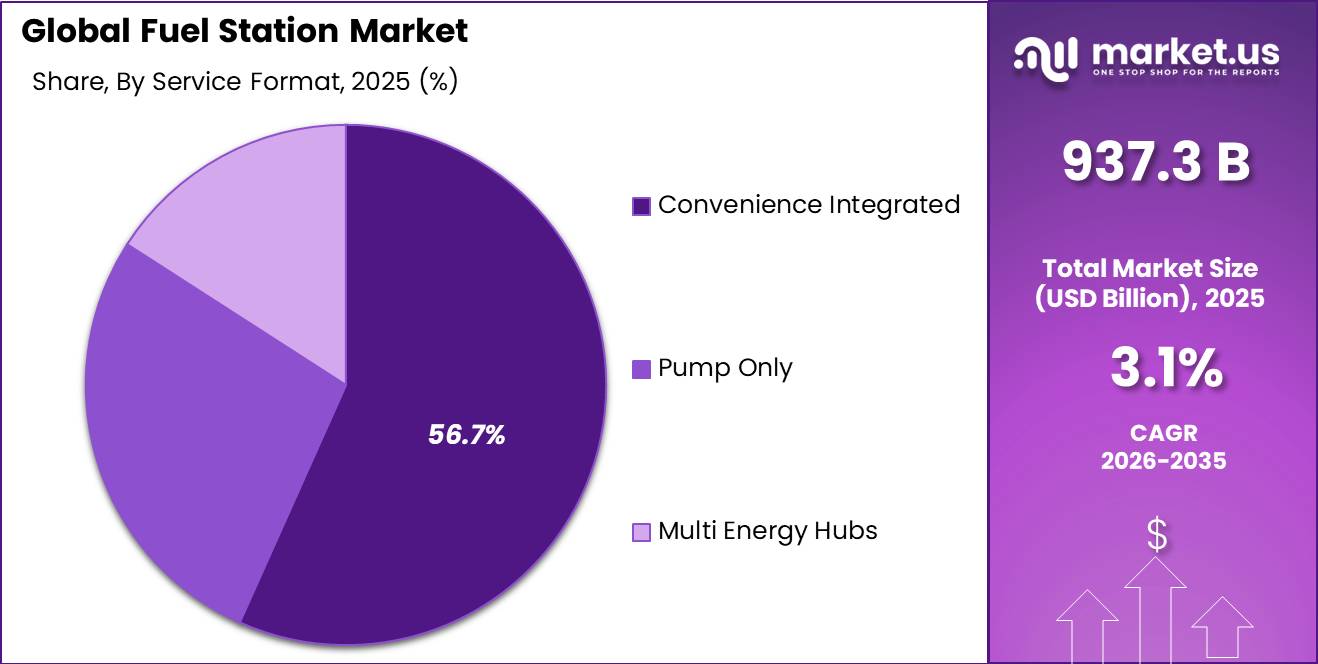
- Convenience Integrated held a dominant market position, capturing more than a 56.7% share in the Fuel Station Market.
- Road Transport held a dominant market position, capturing more than a 62.1% share in the Fuel Station Market.
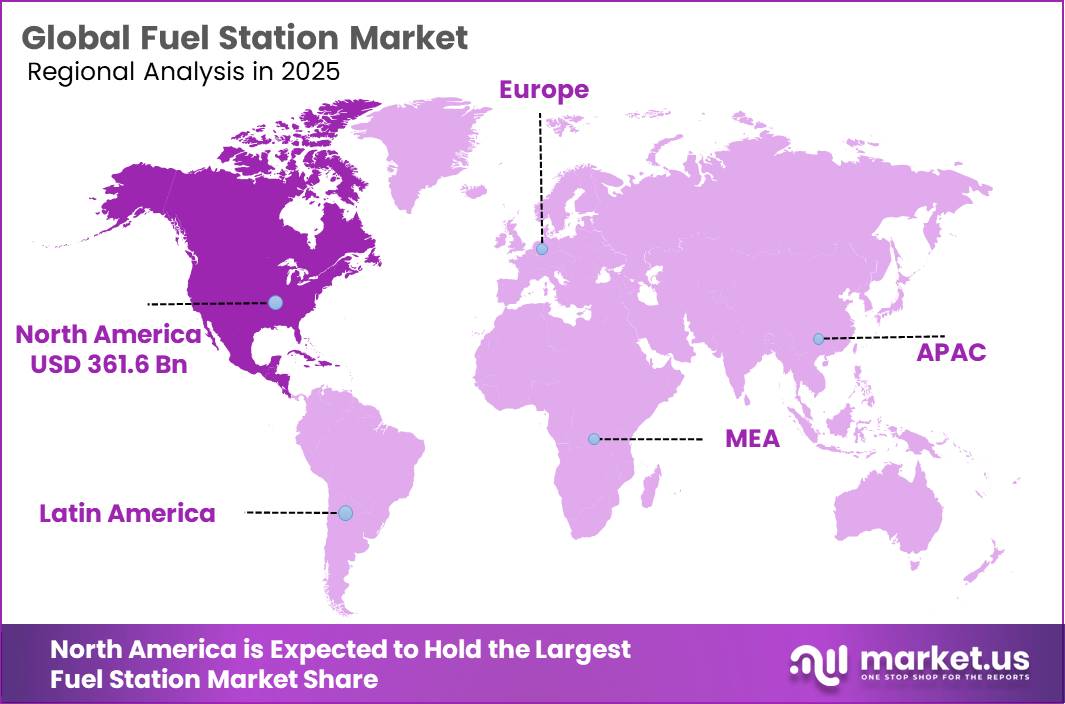
- North America held a dominant position in the global Fuel Station Market, accounting for 38.6% of the total market and reaching a value of USD 361.6 Billion.
The industry scenario is shifting from fuel-only outlets to mobility and convenience hubs. Shell reported around 29 million daily customers at Shell-branded mobility sites and 88,000 public EV charge points in 2025, showing how large operators are combining fuels, EV charging, lubricants, food, and fleet services. BP’s 2025 strategy reset also emphasized portfolio discipline, targeting $20 billion of divestments by end-2027 while reshaping its mobility and convenience footprint.
Driving factors include vehicle parc growth outside mature economies, freight activity, rural fuel needs, and diversification into charging, foodservice and loyalty-led retail. Agriculture also supports fuel-station demand because farm mechanization and logistics require diesel and biofuels; OECD-FAO’s 2025–2034 Agricultural Outlook projects global agricultural and fish production to rise 14% by 2034, while its biofuels chapter covers market projections for 2025–2034.
In the U.S., USDA reported 2024 farm fuel expense of $15.4 billion, including $9.9 billion for diesel, equal to 64.3% of farm fuel spending, showing that diesel-dependent agricultural operations continue to anchor fuel-station demand outside urban passenger markets.
Government policy is accelerating station modernization. In the EU, the Alternative Fuels Infrastructure Regulation requires fast charging of at least 150 kW every 60 km along core road networks from 2025, while U.S. NEVI provides nearly US$5 billion for EV charging infrastructure, while the wider Charging and Fueling Infrastructure program adds $2.5 billion and can fund up to 80% of eligible EV-charging project costs.
The European Union’s Alternative Fuels Infrastructure Regulation requires publicly accessible hydrogen refuelling stations at a maximum 200 km interval along TEN-T networks and at least one in every urban node, opening opportunities for multi-energy fuel stations.
Shell plc remains a major global operator, with its mobility platform active in more than 80 markets and a 2025 strategy update targeting annual capital spending of US$20–22 billion during 2025–2028 and structural cost reductions of US$5–7 billion by 2028. In 2025, Shell also completed the Shell Recharge Solutions and 50five transaction on 1 May 2025, supporting European home and workplace charging services.
By Fuel Type Analysis
Gasoline/Petrol dominates with 35.2% share driven by strong consumer preference and established fueling infrastructure
In 2025, Gasoline/Petrol held a dominant market position, capturing more than a 35.2% share in the Fuel Station Market. This leadership was mainly supported by the large number of gasoline-powered passenger vehicles operating across both developed and developing regions. Consumers continued to rely on gasoline due to easy fuel availability, faster refueling time, and the wide presence of fuel stations across urban and rural areas.
By Ownership Analysis
Company Operated dominates with 46.2% share supported by stronger operational control and consistent customer experience
In 2025, Company Operated held a dominant market position, capturing more than a 46.2% share in the Fuel Station Market. This strong position was supported by the ability of company-operated stations to maintain direct control over operations, pricing strategies, fuel quality, and customer service standards. Many fuel companies continued to prefer this ownership model as it helped create a uniform brand experience and allowed quicker implementation of business decisions across locations.
By Service Format Analysis
Convenience Integrated dominates with 56.7% share driven by rising demand for faster and more complete customer service
In 2025, Convenience Integrated held a dominant market position, capturing more than a 56.7% share in the Fuel Station Market. The segment’s strong performance was supported by changing consumer preferences toward locations that offer more than fuel. Customers increasingly preferred stations that combined fuel services with convenience stores, food options, beverages, daily essentials, and quick-stop facilities, making each visit more efficient and time-saving.
By End-User Analysis
Road Transport dominates with 62.1% share supported by high vehicle movement and everyday fuel demand
In 2025, Road Transport held a dominant market position, capturing more than a 62.1% share in the Fuel Station Market. This leading position was supported by the continuous demand for fuel across passenger vehicles, commercial fleets, logistics operations, and public transportation networks. Daily commuting, freight movement, and expanding vehicle ownership continued to drive strong fuel consumption through road-based transportation activities.
Key Market Segments
By Fuel Type
- Gasoline/Petrol
- Diesel
- Gas (CNG/LNG)
- Alternative Fuels
- EV Charging
By Ownership
- Company Operated
- Dealer/Branded-Dealer
- Independent Retailers
By Service Format
- Convenience Integrated
- Pump Only
- Multi Energy Hubs
By End-User
- Road Transport
- Water Transport
- Air Transport
- Industrial & Agricultural
Emerging Trends
Fuel Stations Are Becoming Food-and-Convenience Stops
A major latest trend in the fuel station industry is the shift from only selling petrol or diesel to becoming quick food and convenience destinations. This trend is growing because fuel margins are often tight, while food, coffee, snacks, and ready-to-eat meals give operators better daily income.
In the U.S., NACS reported that convenience stores sell about 80% of all fuel purchased in the country, but fuel is not the only growth area anymore. In 2024, total convenience store sales reached USD 837.4 billion, while fuel revenue fell 5.7% to USD 501.9 billion. This shows why operators are paying more attention to in-store foodservice.
Food Spending Is Supporting the New Fuel Station Model
Food demand is also helping fuel stations become more useful for everyday customers. People now expect a clean store, fresh coffee, simple meals, and fast checkout when they stop for fuel. USDA data shows that total food spending reached USD 2.51 trillion in 2025, while food-away-from-home spending increased to USD 1.41 trillion. This supports the idea that customers are spending more on meals and snacks outside the home, which benefits fuel stations with strong foodservice sections.
At the same time, government clean-transport rules are pushing stations to modernize. The IEA notes that the EU’s AFIR rule requires fast-charging stations of at least 150 kW every 60 km on core TEN-T roads by 2025.
Drivers
Growing Road Transportation Activity Continues to Drive Fuel Station Demand
One of the strongest factors supporting growth in the Fuel Station Market is the continued dependence on road transportation for both passenger movement and commercial activity. Fuel stations remain an essential part of daily mobility because road vehicles still account for a major share of energy use across transport systems. As populations expand, cities grow, and delivery networks become more active, demand for accessible and reliable fuel infrastructure continues to increase.
According to the International Energy Agency (IEA), transport represents around 30% of global energy demand, and road transport accounts for nearly 90% of total domestic transport energy demand. This shows how heavily economies continue to rely on road-based movement for people and goods. In addition, road transport contributes around 45% of global oil demand, making fuel stations a critical support network for maintaining mobility and logistics operations across regions.
Government Transport Infrastructure and Mobility Programs Support Fuel Station Expansion
Government investment in transport infrastructure has also become an important growth driver for the Fuel Station Market. Many countries continue expanding highways, freight corridors, industrial zones, and regional connectivity programs to improve economic activity and movement efficiency. As new roads and transport networks develop, fuel stations naturally expand to support rising vehicle traffic and long-distance travel demand.
Energy and transport data from trusted international sources continue to show the importance of road mobility. According to the International Energy Agency (IEA), global final energy consumption exceeded 450 EJ in 2024, and transport contributed nearly 10% of total growth in energy demand since 2019. This increase reflects continued movement of goods, urban development, and stronger transportation activity across multiple economies. Public investment in roads and logistics networks encourages the development of supporting infrastructure, including fuel stations, convenience services, and integrated mobility facilities.
Restraints
Transition Toward Alternative Mobility and Lower Fuel Consumption
One of the major restraining factors for the fuel station industry is the gradual shift in transport energy use and changing fuel consumption patterns. Fuel stations have traditionally depended on regular gasoline and diesel sales, but growth in these categories has started to slow in many markets because of vehicle efficiency improvements, electric mobility adoption, and changes in travel behavior. This does not mean fuel stations are disappearing, but it creates pressure on operators to rethink long-term revenue models.
According to the International Energy Agency (IEA), global oil demand growth slowed to 0.8% in 2024, reaching 193 exajoules (EJ) after growing by 1.9% in 2023. The IEA also reported that oil’s share of total global energy demand fell below 30% for the first time in 50 years, showing that transport and energy systems are becoming more diversified. In addition, road transport contributed only around 5% of total oil demand growth since 2022, compared with previous years when it was a major growth engine.
Changing Consumer Spending and Competition for Forecourt Revenue
Another important restraint is changing consumer spending behavior and stronger competition for non-fuel revenue. Modern fuel stations increasingly depend on food service, convenience retail, and quick-purchase categories to support profitability because fuel margins alone are becoming more competitive. However, rising operating costs and changing household spending habits can affect customer traffic and average spending per visit.
Data from the Food and Agriculture Organization shows that global food commodity prices remained elevated compared with historical averages, with the FAO Food Price Index averaging 122.0 points in 2024. Higher food costs influence consumer purchasing decisions and can reduce discretionary spending in convenience and impulse categories commonly sold at fuel stations. Governments and public institutions are also encouraging energy efficiency and diversified mobility infrastructure, pushing operators to invest in new services rather than relying only on fuel volumes.
Opportunity
Expansion of Multi-Energy and EV Charging Stations Creates New Revenue Opportunities
One of the strongest growth opportunities for the Fuel Station Market is the transition from traditional fuel outlets into multi-energy service hubs. Fuel stations are increasingly expanding beyond gasoline and diesel by adding EV charging, convenience retail, digital services, and customer-focused amenities. This shift allows operators to keep existing customers while attracting a growing group of electric vehicle users.
According to the International Energy Agency (IEA), public EV charging infrastructure has expanded rapidly, with the global number of publicly accessible charging points surpassing 5 million and doubling since 2022. This growth reflects rising investment in mobility infrastructure and changing transportation habits. At the same time, governments across several countries continue supporting charging deployment through funding programs, incentives, and infrastructure development initiatives.
Government Charging Programs and Infrastructure Investment Support Future Fuel Station Development
Government-led mobility and charging initiatives are creating another major opportunity for fuel station operators. Rather than replacing fuel stations immediately, many policies are encouraging existing stations to evolve into integrated mobility centers that support both conventional and electric transportation demand. This allows operators to continue using established locations while expanding service capabilities.
Recent IEA analysis highlighted that India’s public charging point network increased by 15% in 2025, reaching approximately 88,000 charging points. The latest PM E-DRIVE funding program allocated INR 20 billion to support public EV charging infrastructure and targeted deployment of 22,100 fast chargers, strengthening long-term infrastructure development. These investments create favorable conditions for fuel station owners to participate in charging expansion and improve customer engagement.
Regional Insights
North America dominated the Fuel Station Market with a 38.6% share, reaching USD 361.6 Billion due to strong vehicle ownership and established fuel infrastructure
In 2025, North America held a dominant position in the global Fuel Station Market, accounting for 38.6% of the total market and reaching a value of USD 361.6 Billion. The region’s leadership was supported by its highly developed transportation network, strong vehicle ownership base, and widespread availability of fuel station infrastructure across urban, suburban, and highway corridors. Demand remained stable due to continued dependence on road transport for both personal and commercial mobility.
The United States remained the primary contributor to regional growth, supported by a large fleet of passenger and commercial vehicles and extensive fuel distribution systems. Fuel stations across the region continued evolving beyond traditional refueling by integrating convenience retail, digital payment systems, quick-service offerings, and upgraded customer facilities. These value-added services strengthened customer retention and improved station-level revenue opportunities.
Key Regions and Countries Insights
- North America
- US
- Canada
- Europe
- Germany
- France
- The UK
- Spain
- Italy
- Rest of Europe
- Asia Pacific
- China
- Japan
- South Korea
- India
- Australia
- Rest of APAC
- Latin America
- Brazil
- Mexico
- Rest of Latin America
- Middle East & Africa
- GCC
- South Africa
- Rest of MEA
Key Players Analysis
Shell plc remains one of the leading participants in the Fuel Station Market through its broad retail fuel presence and integrated energy operations. The company operates more than 47,000 retail stations globally and serves approximately 33 million customers daily through its mobility network. Shell continues investing in station modernization, digital payment systems, convenience retail, and alternative mobility solutions.
BP plc holds a strong position in the Fuel Station Market through its large fuel retail footprint and customer service network. The company operates over 21,000 fuel retail sites worldwide and serves millions of customers each week through fuel, convenience, and mobility services. BP continues expanding retail partnerships and upgrading stations with integrated customer offerings. Its operations focus on improving station efficiency, increasing customer engagement, and supporting long-term growth through infrastructure improvements and expanded energy service capabilities.
TotalEnergies SE maintains a significant presence in the Fuel Station Market through its extensive retail fuel operations across multiple regions. The company manages more than 16,000 service stations worldwide and supports millions of consumer transactions annually. TotalEnergies continues investing in multi-energy station formats, convenience services, and digital customer experiences.
Top Key Players Outlook
- Shell plc
- BP plc
- TotalEnergies SE
- ExxonMobil Corporation
- Chevron Corporation
- Sinopec Group
- PetroChina Company Limited
- Saudi Aramco
- Indian Oil Corporation Limited
- Bharat Petroleum Corporation Limited
- ENEOS Holdings, Inc.
- PTT Public Company Limited
- Repsol S.A.
- Eni S.p.A.
- Phillips 66
- Marathon Petroleum Corporation
- Valero Energy Corporation
- Petronas
- Couche-Tard Inc.
Recent Industry Developments
In 2025, PetroChina Company Limited strengthened its fuel station business by expanding from traditional fuel retail into a wider “oil, gas, hydrogen, power and non-oil products” model. The company built 1,525 comprehensive energy stations, opened 450 LNG refueling stations, and added 37.6 thousand charging guns, showing clear investment in charging, gas refueling, and integrated mobility services. Its marketing segment sold 160.811 million tons of gasoline, kerosene, and diesel in 2025, up 1.1% from 159.000 million tons in 2024.
In 2025, Sinopec Group remained one of the strongest companies in the fuel station sector, supported by its large retail network and fast move toward integrated energy stations. The company had 31,195 Sinopec-branded service stations and 28,689 Easy Joy convenience stores, giving it a wide customer reach across fuel, retail, and mobility services. For investment and expansion, Sinopec’s marketing and distribution segment recorded RMB 13.8 billion in capital expenditure in 2025, mainly for petrol, gas, hydrogen, power, and service-integrated energy station networks.
Report Scope
| Report Features | Description |
|---|---|
| Market Value (2025) | USD 937.3 Bn |
| Forecast Revenue (2035) | USD 1,269.6 Bn |
| CAGR (2026-2035) | 3.1% |
| Base Year for Estimation | 2025 |
| Historic Period | 2020-2024 |
| Forecast Period | 2026-2035 |
| Report Coverage | Revenue Forecast, Market Dynamics, Competitive Landscape, Recent Developments |
| Segments Covered | By Fuel Type (Gasoline/Petrol, Diesel, Gas (CNG/LNG), Alternative Fuels, EV Charging), By Ownership (Company Operated, Dealer/Branded-Dealer, Independent Retailers), By Service Format (Convenience Integrated, Pump Only, Multi Energy Hubs), By End-User (Road Transport, Water Transport, Air Transport, Industrial And Agricultural) |
| Regional Analysis | North America – US, Canada; Europe – Germany, France, The UK, Spain, Italy, Rest of Europe; Asia Pacific – China, Japan, South Korea, India, Australia, Singapore, Rest of APAC; Latin America – Brazil, Mexico, Rest of Latin America; Middle East & Africa – GCC, South Africa, Rest of MEA |
| Competitive Landscape | Shell plc, BP plc, TotalEnergies SE, ExxonMobil Corporation, Chevron Corporation, Sinopec Group, PetroChina Company Limited, Saudi Aramco, Indian Oil Corporation Limited, Bharat Petroleum Corporation Limited, ENEOS Holdings, Inc., PTT Public Company Limited, Repsol S.A., Eni S.p.A., Phillips 66, Marathon Petroleum Corporation, Valero Energy Corporation, Petronas, Couche-Tard Inc. |
| Customization Scope | Customization for segments, region/country-level will be provided. Moreover, additional customization can be done based on the requirements. |
| Purchase Options | We have three licenses to opt for: Single User License, Multi-User License (Up to 5 Users), Corporate Use License (Unlimited User and Printable PDF) |


