


Report Overview
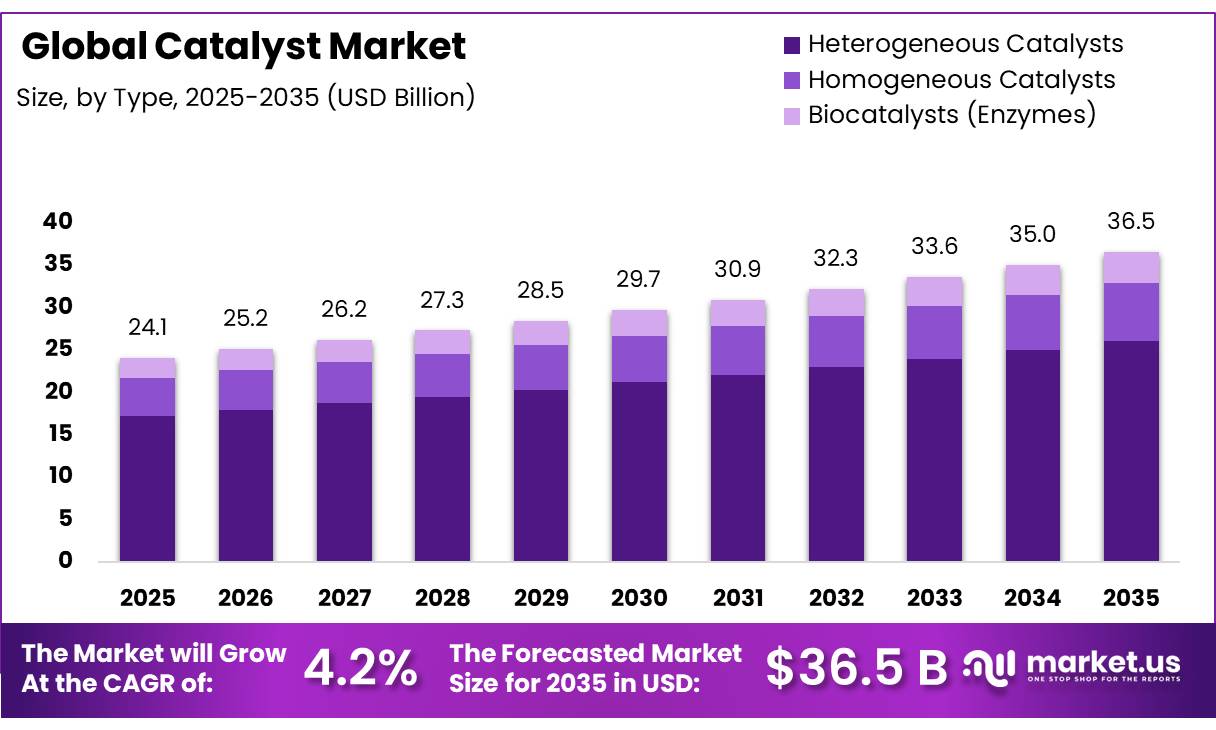
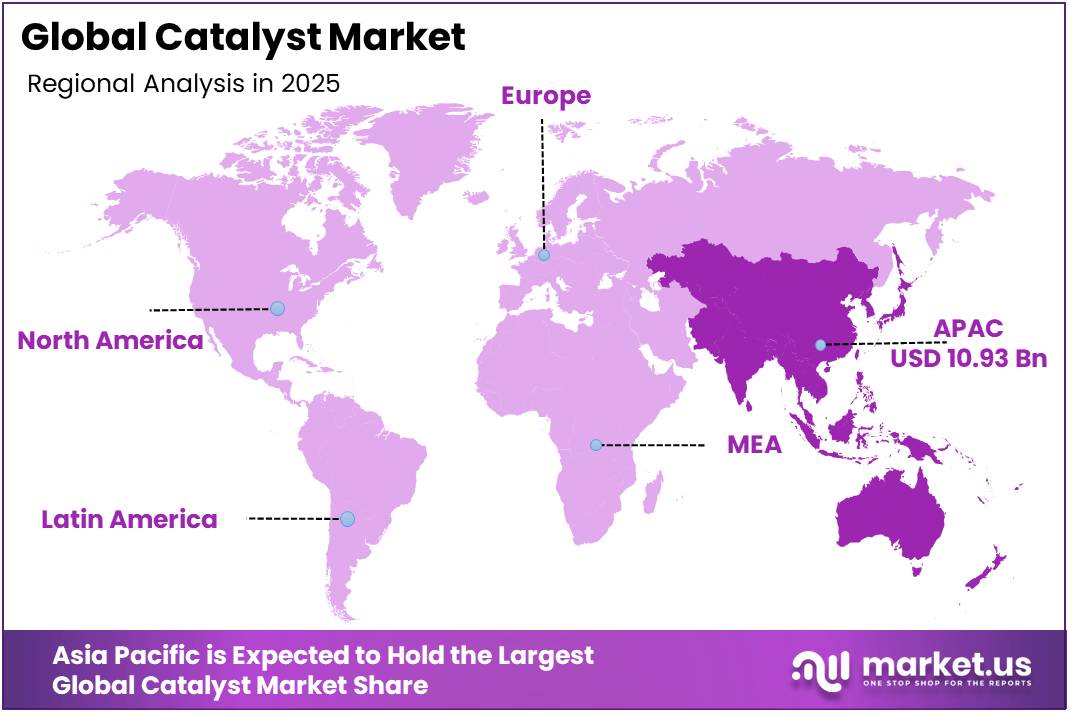
In 2025, the Global Catalyst Market was valued at USD 24.1 billion, and between 2026 and 2035, this market is estimated to register a CAGR of 4.2%, reaching about USD 36.5 billion by 2035. Asia Pacific held a dominant market position, capturing more than a 45.30% share, holding USD 10.93 billion in revenue.
The catalyst market is a specialty chemical industry built around substances that accelerate reactions, lower activation energy, improve selectivity, and reduce energy requirements without being consumed. Topsoe states that approximately 90% of all commercially produced chemical products rely on catalysis, while its portfolio covers over 150 in-house catalyst types for chemical, refining, and energy industries. This shows that catalysts are a core enabler of modern industrial chemistry.
- The American Chemistry Council (ACC) stated in June 2026 that United States (U.S.) chemical output volumes are expected to rise only 0.5% in 2026, while plastic resins output is expected to increase 0.7%. ACC also noted that specialty chemical output is expected to decline 0.3%, but agricultural chemicals are expected to rise 1.9%, indicating mixed but active catalyst-consuming demand.
Key Takeaways
- The global catalyst market was valued at USD 24.1 billion in 2025.
- The global market is projected to grow at a CAGR of 4.2% and is estimated to reach USD 36.5 billion by 2035.
- On the basis of type, heterogeneous catalysts dominated the market, constituting 71.4% of the total market share.
- Based on material type, zeolites led the catalyst market, comprising 34.2% of the total market.
- Based on application, petroleum refining dominated the catalyst market, accounting for 39.8% of the total market share.
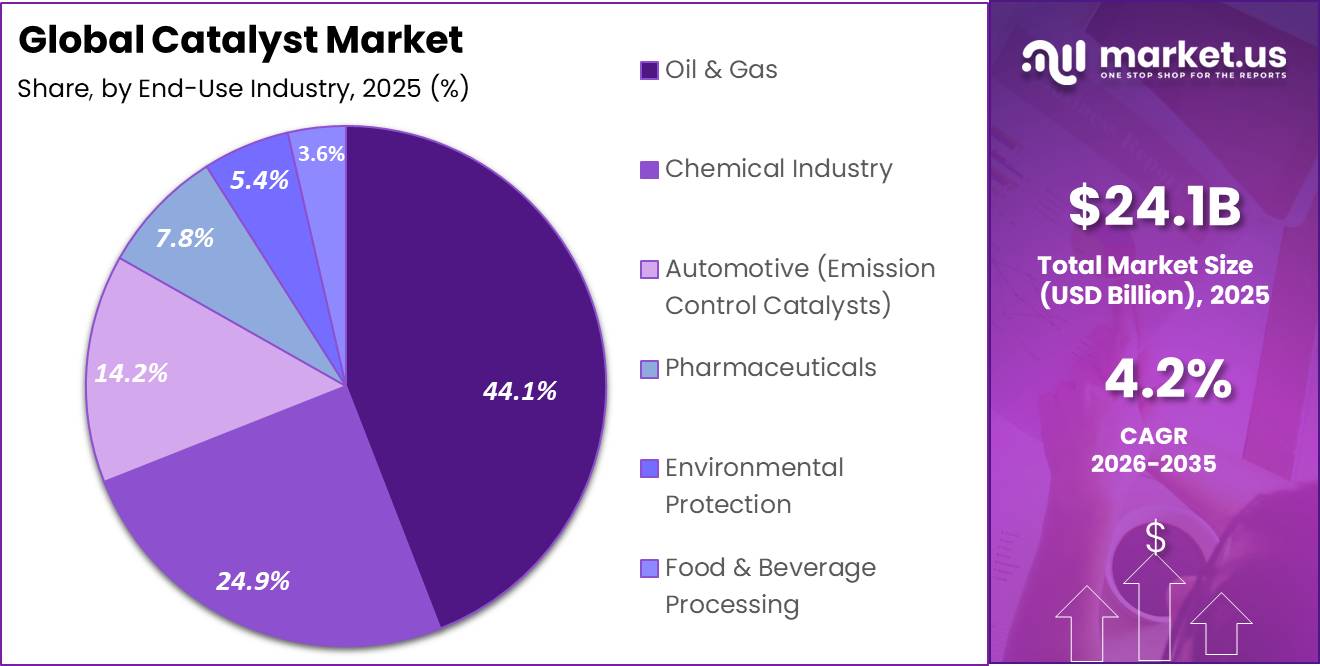
- Among the end-use industries, oil & gas held a major share in the catalyst market, accounting for 44.1% of the market share.
- Based on form type, solid catalysts were the most considerable within the market, accounting for around 78.6% of the revenue.
- Based on catalyst function, hydrotreating catalysts led the market, holding 28.9% of the total market share.
- Based on distribution channel, direct sales dominated the catalyst market, accounting for 73.2% of the market share.
- Based on regeneration type, virgin catalysts dominated the market, comprising 66.4% of the total market share.
- In 2025, Asia-Pacific was the most dominant region in the catalyst market, accounting for 45.3% of the total market share.
Demand drivers are shaped by efficiency, regulation, and cleaner processing. The European Chemical Industry Council (Cefic) reported that Europe’s share of global chemical sales dropped to 13%, while China reached 46%, showing global competition. Cefic also noted that European gas prices remain three times higher than in the U.S., while the sector has improved energy efficiency by 40% since 1990. These pressures support catalysts that lower energy intensity, raise yield, and improve economics.
Growth opportunities are expected from emission control, fuel upgrading, circular chemicals, and low-carbon manufacturing. The United States Environmental Protection Agency (EPA) adopted stronger heavy-duty vehicle and engine standards from model year 2027. The International Maritime Organization (IMO) reduced marine fuel sulphur content to 0.50% from 3.50%, with 0.10% limits in emission control areas. The European Commission’s Clean Industrial Deal will mobilise over €100 billion for EU-made clean manufacturing, supporting catalyst innovation in cleaner fuels, chemicals, and industrial decarbonisation.
Type Analysis
Heterogeneous Catalysts dominate with 71.40% due to their broad industrial use.
In 2025, Heterogeneous Catalysts held a dominant market position, capturing more than a 71.40% share of the catalyst market by type. In the June 2025 market view, this segment led because these catalysts are widely used in petroleum refining, petrochemical processing, emission control, and large-scale chemical production. Their strong preference is linked to easier separation from reaction mixtures, better reuse potential, and suitability for continuous industrial operations.
Homogeneous Catalysts emerged as the fastest growing segment. Their growth was supported by rising use in fine chemicals, specialty synthesis, and controlled reaction processes where higher selectivity, cleaner conversion, and precise reaction performance are important for manufacturers.
Material Type Analysis
Zeolites dominate with 34.20% due to their strong role in refining and chemical processing.
In 2025, Zeolites held a dominant market position, capturing more than a 34.20% share of the catalyst market by material type. In the June 2025 market view, this segment led because zeolites are widely used in petroleum refining, petrochemical production, and chemical conversion processes. Their strong demand was supported by high thermal stability, porous structure, and ability to improve reaction selectivity. Manufacturers preferred zeolite-based catalysts because they help increase output quality, support cleaner processing, and perform reliably in large-scale industrial operations.
Metals, including platinum, palladium, nickel, and related materials, emerged as the fastest growing segment. Their growth was supported by rising use in hydrogenation, emission control, fuel processing, and specialty chemical reactions where high activity and strong catalytic performance are important.
Application Analysis
Petroleum Refining dominates with 39.80% due to its strong catalyst demand in fuel upgrading.
In 2025, Petroleum Refining held a dominant market position, capturing more than a 39.80% share of the catalyst market by application. In the June 2025 market view, this segment led because refineries depend heavily on catalysts for fuel upgrading, desulfurization, cracking, reforming, and product quality improvement. Petroleum refining continued to require stable catalyst performance to support cleaner fuel output, improve process efficiency, and handle different crude feedstocks. Its strong position was also supported by the regular replacement and regeneration needs of catalysts used in high-volume refining units.
Petrochemicals Production emerged as the fastest growing segment. Its growth was supported by rising use of catalysts in producing key chemical building blocks, polymers, and specialty intermediates, where better yield, selectivity, and process control are important for manufacturers.
End-Use Analysis
Oil & Gas dominates with 44.10% due to its heavy use of catalysts in refining and processing.
In 2025, Oil & Gas held a dominant market position, capturing more than a 44.10% share of the catalyst market by end-use industry. In the June 2025 market view, this segment led because catalysts are widely used across refining, hydroprocessing, cracking, reforming, and fuel-quality improvement. Oil and gas companies continued to depend on catalysts to improve process efficiency, reduce impurities, support cleaner fuel production, and manage complex feedstocks. Regular catalyst replacement, regeneration, and performance monitoring also supported steady demand from this industry.
Chemical Industry emerged as the fastest growing segment. Its growth was supported by rising catalyst use in specialty chemicals, polymers, intermediates, and fine chemical production, where better yield, cleaner conversion, and higher reaction control are important for manufacturers.
Form Type Analysis
Solid Catalysts dominate with 78.60% due to their strong use in large-scale industrial processes.
In 2025, Solid Catalysts held a dominant market position, capturing more than a 78.60% share of the catalyst market by form type. In the June 2025 market view, this segment led because solid catalysts are widely used in petroleum refining, petrochemical production, chemical synthesis, and emission control systems. Industries preferred them because they are easier to separate, recover, and reuse compared with other forms. Their strong stability under high-temperature and high-pressure operations also made them suitable for continuous industrial processing, where long operating life and consistent performance are important.
Liquid Catalysts emerged as the fastest growing segment. Their growth was supported by rising use in specialty chemical reactions, fine chemical production, and controlled synthesis processes where better mixing, faster reaction contact, and flexible processing are required.
Catalyst Function Analysis
Hydrotreating Catalysts dominate with 28.90% due to their strong use in fuel purification.
In 2025, Hydrotreating Catalysts held a dominant market position, capturing more than a 28.90% share of the catalyst market by catalyst function. In the June 2025 market view, this segment led because hydrotreating catalysts are widely used in refining operations to remove sulfur, nitrogen, and other impurities from fuel streams. Refineries preferred these catalysts because they help improve fuel quality, support cleaner processing, and meet stricter product standards.
Fluid Catalytic Cracking (FCC) Catalysts emerged as the fastest growing segment. Their growth was supported by rising refinery focus on converting heavier feedstocks into higher-value fuels and petrochemical feedstocks with better yield and process efficiency.
Distribution Channel Analysis
Direct Sales (Industrial Contracts) dominate with 73.20% due to strong long-term industrial supply agreements.
In 2025, Direct Sales (Industrial Contracts) held a dominant market position, capturing more than a 73.20% share of the catalyst market by distribution channel. In the June 2025 market view, this segment led because large industrial buyers preferred direct procurement from catalyst producers for better product customization, technical support, pricing control, and supply reliability. Refining, oil and gas, petrochemical, and chemical companies often required catalysts designed for specific process conditions, making direct contracts more practical than open distribution channels.
Specialty Chemical Distributors emerged as the fastest growing segment. Their growth was supported by rising demand from small and mid-sized chemical users that required faster access, smaller volumes, and wider product availability.
Regeneration Type Analysis
Virgin Catalysts dominate with 66.40% due to their strong performance in critical industrial processes
In 2025, Virgin Catalysts held a dominant market position, capturing more than a 66.40% share of the catalyst market by regeneration type. In the June 2025 market view, this segment led because many industries preferred fresh catalysts for high-performance refining, petrochemical, chemical synthesis, and emission-control operations. Virgin catalysts offered better activity, stronger reliability, and more consistent reaction performance, especially in processes where product quality and operating stability were important.
Regenerated Catalysts emerged as the fastest growing segment. Their growth was supported by rising interest in cost savings, resource efficiency, and circular chemical practices, as industries looked to extend catalyst life while reducing material waste.
Key Market Segments
By Type
- Heterogeneous Catalysts
- Homogeneous Catalysts
- Biocatalysts (Enzymes)
By Material Type
- Zeolites
- Metals (Platinum, Palladium, Nickel, etc.)
- Chemical Compounds (Acids, Bases, Organometallics)
- Enzyme-Based Catalysts
By Application Type
- Petroleum Refining
- Petrochemicals Production
- Chemical Synthesis
- Environmental Catalysis (Emission Control)
- Polymerization Reactions
By End-Use Industry
- Oil & Gas
- Chemical Industry
- Automotive (Emission Control Catalysts)
- Pharmaceuticals
- Environmental Protection
- Food & Beverage Processing
By Form Type
- Solid Catalysts
- Liquid Catalysts
- Gaseous Catalysts
By Catalyst Function
- Hydrotreating Catalysts
- Fluid Catalytic Cracking (FCC) Catalysts
- Hydrogenation Catalysts
- Polymerization Catalysts
- Oxidation Catalysts
By Distribution Channel
- Direct Sales (Industrial Contracts)
- Specialty Chemical Distributors
- Licensing & Technology Partnerships
By Regeneration Type
- Virgin Catalysts
- Regenerated Catalysts
Driver Analysis
Hydrogen and low-carbon fuels build-out expanding catalyst demand into new process chains
Public-sector hydrogen policy is moving catalyst demand beyond traditional refining into electrolysis, hydrogen purification, ammonia, methanol, synthetic fuels, and refinery decarbonization linkages. DOE’s 2024 Hydrogen Shot water electrolysis assessment put current hydrogen production cost from electrolyzers at about $6–$8 per kilogram, while DOE’s PEM cost work placed many systems around $5–$7 per kilogram against the $1 per kilogram 2031 target. Although that gap shows green hydrogen is not yet cost-competitive at scale, it also confirms a long investment runway in which catalyst performance becomes central to improving conversion efficiency, lowering power intensity, and extending stack or reactor life across electrolyzers and downstream synthesis units.
The IEA also notes that hydrogen demand remains concentrated in refining and chemicals and that more than 96% of production in north-western Europe is still fossil-based, which means decarbonization will require new low-carbon production assets rather than minor optimization alone. Because new hydrogen, e-fuels, and low-carbon derivative plants are catalyst-heavy from start-up, the business model shifts from replacement-only demand toward project-led installed-base growth, supporting an estimated +1.3 percentage-point CAGR uplift over the medium term.
Drivers Impact Analysis
| Driver | (~) % Impact on CAGR Forecast | Geographic Relevance | Impact Timeline |
|---|---|---|---|
| Tightening refinery utilization and margin recovery lifting replacement catalyst intensity | +1.1% | North America core, Middle East export hubs, APAC refining corridors | Short term (≤ 2 years) |
| U.S. and EU emissions compliance forcing higher-performance process and abatement catalysts | +1.4% | North America core, EU, selective APAC spill-over | Short term (≤ 2 years) |
| Hydrogen and low-carbon fuels build-out expanding catalyst demand into new process chains | +1.3% | EU, North America, Japan-Korea corridor, Gulf projects | Medium term (2-4 years) |
| Carbon pricing and CBAM-linked decarbonization improving economics of catalyst efficiency upgrades | +0.9% | EU core, export-oriented Asia, North Africa feeders | Medium term (2-4 years) |
| Feedstock complexity and heavier residue optimization increasing catalyst turnover per barrel processed | +0.8% | APAC complex refineries, Middle East, U.S. Gulf Coast | Medium term (2-4 years) |
| Regeneration, circularity, and metals recovery reducing lifecycle cost and widening reuse models | +0.7% | EU, North America, China, India | Medium term (2-4 years) |
Restraint Analysis
PGM supply tightness
USGS data indicate a sharp deterioration in near-term platinum-group metal availability, with 2025 U.S. mine production falling to 6,200 kg of palladium from 10,200 kg in 2024 and to 1,800 kg of platinum from 3,010 kg, while U.S. net import reliance rose to 57% for palladium and 89% for platinum, creating a structurally fragile feedstock base for autocatalyst, refinery, and chemical-catalyst producers.
The same source shows 2025 world mine output declining to 190,000 kg for palladium from 217,000 kg and to 170,000 kg for platinum from 179,000 kg, which materially reduces buffer inventory and raises the probability of allocation behavior by refiners and fabricators. In practical forecasting terms, that combination lifts working-capital lockup, extends contract renegotiation cycles by one to two quarters, and depresses volume conversion in price-sensitive end uses, justifying an estimated 2.2 percentage-point deduction from baseline catalyst CAGR in 2026 as OEMs delay formulation changes and industrial buyers ration spot purchases.
Restraint Impact Analysis
| Restraint | (~) % Impact on CAGR | Geographic Relevance | Impact Timeline |
|---|---|---|---|
| PGM supply tightness | -2.2% | North America core, EU, Japan, Korea | Short term (≤ 2 years) |
| PGM price inflation | -1.8% | Global, especially import-dependent OECD | Short term (≤ 2 years) |
| TSCA/PFAS compliance drag | -1.3% | U.S. specialty chemicals, North America core | Medium term (2-4 years) |
| EU carbon-cost pass-through | -1.1% | EU, Turkey-North Africa corridors, export hubs | Medium term (2-4 years) |
| Power and mining disruption risk | -1.5% | South Africa-linked global supply chain | Short term (≤ 2 years) |
| Recycling feedstock mismatch | -0.9% | U.S., EU, mature autocatalyst markets | Long term (≥ 4 years) |
Opportunity Analysis
Digital catalyst performance & “as-a-service” models
Digital performance optimization and “catalyst‑as‑a‑service” constructs represent a business‑model innovation rather than a product‑level driver, and therefore remain largely untapped even though underlying catalyst deployments are already in place; baseline market forecasts typically assume one‑off catalyst sales rather than recurring performance contracts or data‑driven upsells.
If catalyst suppliers convert even 15–20% of their large installed base into digital service agreements with annual fees equivalent to 5–8% of catalyst spend, the services TAM could reach several hundred million dollars by 2030, while bundling catalysts with performance dashboards and remote optimization tools could lift realized catalyst pricing by 3–5% and extend average contract durations from 3 years to 5–7 years.
In turn, better process control may unlock 2–3 percentage points of margin expansion for end users via reduced unplanned downtime and 1–2% energy savings per ton processed, creating strong willingness to pay for analytics subscriptions. These monetization levers recurring revenue, outcome‑based pricing, and data‑powered differentiation sit largely outside current government‑tracked volume and value forecasts, enabling a realistic ~0.8 percentage point incremental CAGR upside in global industrial hubs that adopt digital operations fastest
Opportunity Impact Analysis
| Opportunity | (~) % Potential CAGR Upside | Geographic Relevance | Execution Window |
|---|---|---|---|
| Green hydrogen & ammonia catalysts | +2.0% | India, APAC, EU | Medium term (2-4 years) |
| CO₂-to-chemicals & low-carbon fuels catalysts | +1.5% | EU, North America, APAC | Medium term (2-4 years) |
| Circular petrochemicals & plastic upcycling catalysts | +1.2% | EU, North America core, APAC | Medium term (2-4 years) |
| Digital catalyst performance & “as-a-service” models | +0.8% | Global tier-1 industrial hubs | Short term (≤ 2 years) |
| Specialty catalysts for emerging Asian chemical output | +1.0% | ASEAN, India, broader APAC | Long term (≥ 4 years) |
| Low-carbon steel and refinery transition catalysts | +0.8% | India, EU, North America | Medium term (2-4 years) |
Challenges Analysis
Refinery turnaround bottlenecks
A large share of catalyst consumption is synchronized to refinery operating intensity and planned turnaround windows, and EIA data show U.S. refinery operable utilization running above 90% in multiple 2026 observations, including readings such as 93.4%, 95.7%, and 91.4%, while January 1, 2026 operable capacity stood around 18.1 million barrels per day, leaving limited slack when units simultaneously defer maintenance or compress replacement schedules.
In practice, when utilization stays in the low-to-mid-90% band, catalyst change-outs and performance testing often face narrower maintenance windows, rushed logistics, and higher penalties for underperformance; even a 3-to-5-day delay in catalyst delivery or activation can cascade into seven-figure unit economics at major refining assets, so suppliers are pushed to hold more field inventory, pre-position technical crews, and invest in digital performance monitoring to reduce outage risk rather than simply chase volume growth.
Challenges Impact Analysis
| Challenge | (~) % CAGR Friction Drag | Geographic Relevance | Mitigation Horizon |
|---|---|---|---|
| PGM price volatility | -1.2% pubs.usgs | North America refining core; EU specialty chemicals; APAC manufacturing hubs pubs.usgs | Medium term (2-4 years) pubs.usgs |
| Refinery turnaround bottlenecks | -0.9% eia+1 | North America core; Middle East export complexes; APAC refinery corridors eia+1 | Short term (≤ 2 years) eia |
| Chemical skills scarcity | -0.8% oecd+1 | OECD manufacturing clusters; EU regulatory hubs; North America process industries oecd+1 | Long term (≥ 4 years) oecd+1 |
| Slower trade logistics flow | -0.7% imf+1 | APAC logistics corridors; EU import gateways; export-oriented Gulf and North America nodes imf+1 | Medium term (2-4 years) imf |
| Energy and utility inflation | -0.8% eia+2 | EU energy-sensitive plants; North America inorganic catalyst production; Asian conversion sites eia+2 | Medium term (2-4 years) eia |
| Emissions compliance complexity | -0.6% oecd+1 | EU regulatory hubs; North America clean-fuels assets; advanced APAC production bases oecd+1 | Long term (≥ 4 years) oecd |
Geopolitical Impact Analysis
Critical Mineral Supply Risks and Trade Policies Are Reshaping the Global Catalyst Industry
The global catalyst market is increasingly influenced by geopolitical developments that affect the availability of critical raw materials, international trade, and industrial investment. Catalyst production depends heavily on platinum group metals, nickel, rare earth elements, and other strategic minerals that are sourced from a limited number of countries. The International Energy Agency reported that the average market share of the top three refining nations for key energy minerals increased from 82% in 2020 to 86% in 2024, reflecting greater supply concentration rather than diversification.
Export controls, geopolitical conflicts, and sanctions have increased uncertainty across catalyst supply networks. The United States Geological Survey reported that South Africa, the world’s leading producer of platinum group metal containing mined material, recorded an estimated 9% decline in production during 2025, while Russia’s mined palladium production declined by 6% because of lower ore grades, operational changes, and geopolitical uncertainty related to the Russia Ukraine conflict.
At the same time, governments are strengthening domestic industrial capabilities to reduce import dependence. The European Commission’s Clean Industrial Deal proposes mobilising more than €100 billion for clean manufacturing and industrial decarbonisation, while the United States Department of Energy continues supporting chemicals and refining projects through its US$6.3 billion Industrial Demonstrations Program. These initiatives are encouraging regional catalyst production, recycling, and alternative material development across North America and Europe.
Regional Analysis
Asia Pacific Held the Largest Share of the Global catalyst Market.
In 2025, Asia-Pacific held a dominant market position in the catalyst market, capturing more than a 45.30% share and reaching a value of USD 10.93 billion. In the June 2025 market view, the region led due to its strong base in petroleum refining, petrochemical production, polymer manufacturing, and industrial chemical processing. Countries across the region continued to use catalysts in fuel upgrading, emission control, chemical synthesis, and large-scale manufacturing operations.
The presence of high-volume refining units and expanding downstream chemical industries supported steady catalyst consumption. Asia-Pacific also benefited from rising demand for cleaner fuels, better process efficiency, and higher output quality. As industries focused on cost control and production reliability, catalyst use remained important across both mature and growing industrial sectors.
Key Regions and Countries Covered
- North America
- The US
- Canada
- Europe
- Germany
- France
- The UK
- Spain
- Italy
- Russia & CIS
- Rest of Europe
- APAC
- China
- Japan
- South Korea
- India
- ASEAN
- Rest of APAC
- Latin America
- Brazil
- Mexico
- Rest of Latin America
- Middle East & Africa
- GCC
- South Africa
- Rest of MEA
Key Players Analysis
Catalyst manufacturers focus on strengthening process efficiency, material performance, and application-specific product development to maintain competitiveness. A key priority is continuous innovation in heterogeneous catalysts, zeolite-based materials, metals, hydrotreating catalysts, and fluid catalytic cracking catalysts that improve reaction selectivity, yield, fuel quality, and operating stability. Companies further invest in refinery, petrochemical, chemical synthesis, and emission-control applications, as these areas require reliable catalyst performance under high-temperature and high-pressure industrial conditions.
Strategic positioning in the catalyst market is shaped by technical support, long-term industrial contracts, regeneration capabilities, and regional supply reliability. Direct sales remain important because large oil and gas, refining, and chemical customers often require customized catalyst solutions for specific process units. Key players also focus on capacity optimization, recycling and regeneration services, intellectual property protection, and customer qualification programs to secure repeat demand. Asia-Pacific remains an important competitive region due to strong refining, petrochemical, and chemical manufacturing activity.
Market Key Players
- BASF SE
- Johnson Matthey plc
- Albemarle Corporation
- Honeywell UOP (Honeywell International Inc.)
- Clariant AG
- R. Grace & Co.
- Haldor Topsoe A/S
- Evonik Industries AG
- LyondellBasell Industries N.V.
- Sinopec Catalyst Co., Ltd.
- Arkema S.A.
- Sumitomo Chemical Co., Ltd.
- Umicore N.V.
- ExxonMobil Chemical Company
- SABIC
Key Development
- BASF’s broader investment plan included approximately €3.3 billion capital expenditure in 2026, with €13.0 billion planned investments from 2026–2029, supporting technology upgrades and sustainable chemical production.
- In 2025, Johnson Matthey plc significantly reshaped its catalyst business strategy by agreeing to sell its Catalyst Technologies (CT) business to Honeywell International Inc. for an enterprise value of £1.8 billion. The transaction included an expected net cash return of approximately £1.6 billion, with around £1.4 billion planned to be returned to shareholders after completion.
- In 2025, Evonik maintained strong investment in innovation, with total R&D spending of approximately €418 million, representing around 3% of company revenue, while about 82% of R&D expenditure was directed toward business-driven development activities to accelerate commercial technologies.
Report Scope
| Report Features | Description |
|---|---|
| Market Value (2025) | USD 24.1 Bn |
| Forecast Revenue (2035) | USD 36.5 Bn |
| CAGR (2026-2035) | 4.2% |
| Base Year for Estimation | 2025 |
| Historic Period | 2020-2024 |
| Forecast Period | 2026-2035 |
| Report Coverage | Revenue Forecast, Market Dynamics, Competitive Landscape, Recent Developments |
| Segments Covered | By Type (Heterogeneous Catalysts, Homogeneous Catalysts, and Biocatalysts), By Material Type (Zeolites, Metals, Chemical Compounds, and Enzyme-Based Catalysts), By Application (Petroleum Refining, Petrochemicals Production, Chemical Synthesis, Environmental Catalysis, and Polymerization Reactions), By End-Use Industry (Oil & Gas, Chemical Industry, Automotive, Pharmaceuticals, Environmental Protection, and Food & Beverage Processing), By Form Type (Solid Catalysts, Liquid Catalysts, and Gaseous Catalysts), By Catalyst Function (Hydrotreating Catalysts, Fluid Catalytic Cracking Catalysts, Hydrogenation Catalysts, Polymerization Catalysts, and Oxidation Catalysts), By Distribution Channel (Direct Sales, Specialty Chemical Distributors, and Licensing & Technology Partnerships), By Regeneration Type (Virgin Catalysts and Regenerated Catalysts) |
| Regional Analysis | North America – The US & Canada; Europe – Germany, France, The UK, Spain, Italy, Russia & CIS, Rest of Europe; APAC– China, Japan, South Korea, India, ASEAN & Rest of APAC; Latin America– Brazil, Mexico & Rest of Latin America; Middle East & Africa– GCC, South Africa, & Rest of MEA |
| Competitive Landscape | BASF SE, Johnson Matthey plc, Albemarle Corporation, Honeywell UOP (Honeywell International Inc.), Clariant AG, W. R. Grace & Co., Haldor Topsoe A/S, Evonik Industries AG, LyondellBasell Industries N.V., Sinopec Catalyst Co., Ltd., Arkema S.A., Sumitomo Chemical Co., Ltd., Umicore N.V., ExxonMobil Chemical Company, and SABIC. |
| Customization Scope | Customization for segments, region/country-level will be provided. Moreover, additional customization can be done based on the requirements. |
| Purchase Options | We have three licenses to opt for: Single User License, Multi-User License (Up to 5 Users), Corporate Use License (Unlimited Users and Printable PDF) |





































