


Report Overview
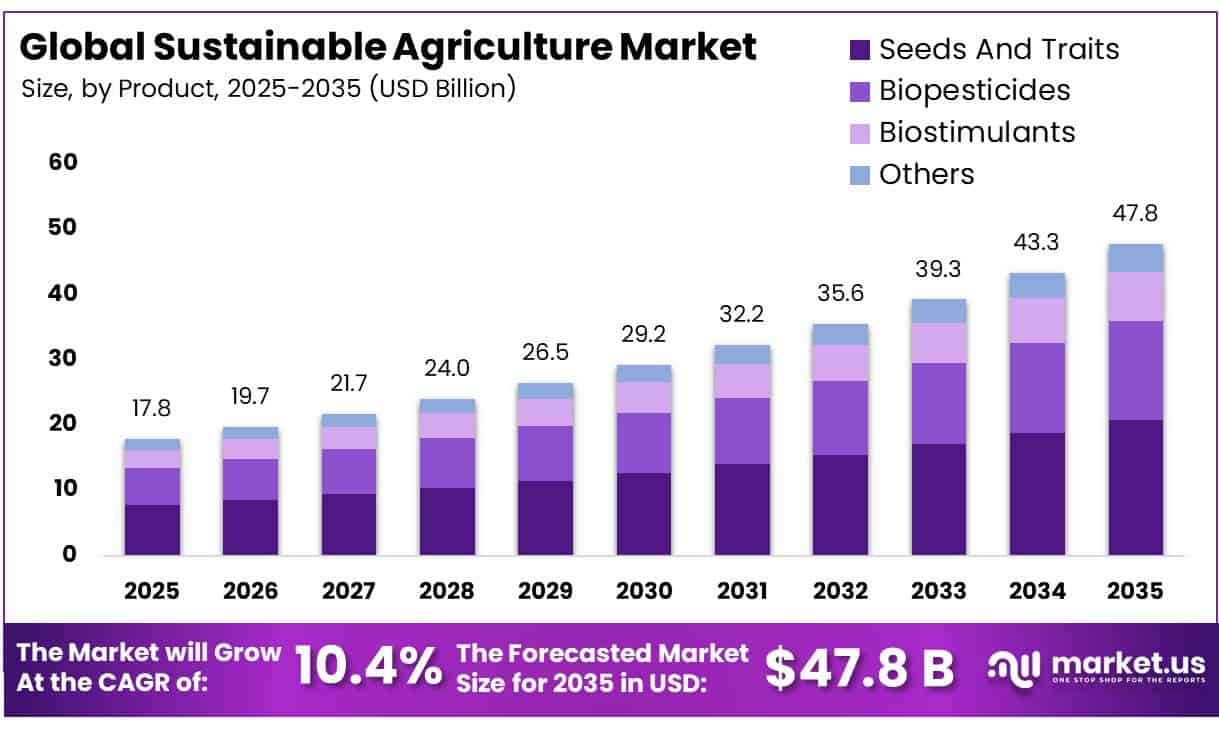
In 2025, the Global Sustainable Agriculture Market was valued at USD 17.8 billion, and between 2026 and 2035, this market is estimated to register a CAGR of 10.4%, reaching about USD 47.8 billion by 2035. In 2025, North America led the market, achieving over 36.8% share with a revenue of USD 6.6 billion.
Sustainable agriculture refers to farming systems that protect soil, water, biodiversity and climate while maintaining food production and farm income. The sector is becoming important because food security remains under pressure.
- FAO estimated that 8.2% of the world’s population faced hunger in 2024, equal to between 638 million and 720 million people, while 28% experienced moderate or severe food insecurity.
Key Takeaways
- The Global Sustainable Agriculture Market was valued at USD 17.8 billion in 2025.
- The market is projected to grow at a CAGR of 10.4% and is estimated to reach USD 47.8 billion by 2035.
- On the basis of product, seeds and traits dominated the market, constituting 43.5% of the total market share.
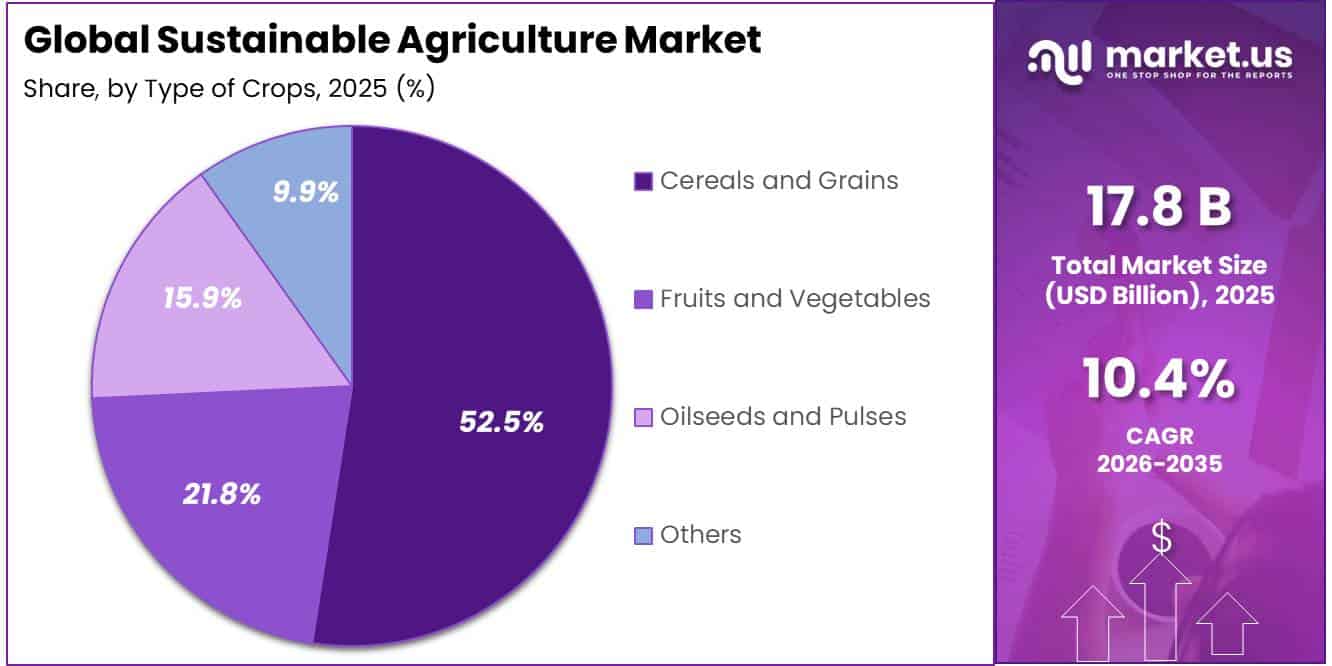
- Based on the type of crops, cereals and grains dominated the market, with a substantial market share of around 52.5%.
- Based on the farming system, organic farming led the market, comprising 34.2% of the total market.
- On the basis of application, food production dominated the market, constituting 32.1% of the total market share.
- In 2025, North America was the most dominant region in the market, accounting for 36.8% of the total global consumption.
The industrial scenario is shaped by the environmental footprint of the agrifood system. FAO reported that global agrifood emissions reached 16.5 billion tonnes of carbon dioxide equivalent in 2023 and represented 32% of total human-caused emissions. Farm-gate crop and livestock activities generated 8.1 billion tonnes, or 49% of agrifood emissions, showing why low-emission production methods are becoming central to agricultural strategy.
- According to FAO’s 2025 AQUASTAT data, agriculture accounts for approximately 72% of global freshwater withdrawals, while renewable freshwater availability per person declined by 7% over the previous decade. FAO also reports that nearly 1.2 billion people live in agricultural areas facing severe water constraints.
Land restoration is moving higher on policy and investment agendas. FAO found that 1.7 billion people live in areas where crop yields are at least 10% lower because of human-induced land degradation. The organization estimates that reversing 10% of degradation on existing cropland could restore enough output to feed an additional 154 million people annually, creating opportunities in regenerative farming, cover crops, crop rotation, agroforestry and soil-carbon improvement.
- The World Bank states that agrifood systems receive only 4.3% of global climate finance, although its annual climate-smart agriculture investment increased nearly eightfold to about USD 3 billion by fiscal year 2023. In fiscal year 2024, climate finance represented 62% of its agriculture and food lending, and active projects helped 4.7 million farmers adopt improved technologies.
Government initiatives are creating commercial pathways. The European Union has around 17 million hectares under organic farming, equal to 11% of agricultural land, while organic retail sales exceed EUR 45 billion. EU policy targets at least 25% organic farmland by 2030, alongside a 50% reduction in pesticide use and risk and a 20% reduction in fertiliser use, supporting investment in biological inputs, certification, traceability and low-chemical farming systems.
Future growth opportunities will expand across precision agriculture, biological crop protection, renewable-powered irrigation, climate-resilient seeds, carbon measurement, farm analytics and circular food systems. UNEP estimated that 1.05 billion tonnes of food were wasted in 2022, equal to 132 kilograms per person and 19% of food available to consumers. Reducing this loss, which contributes 8–10% of global emissions, can create value in storage, cold chains, composting, by-product recovery and digital supply-chain management.
Product Analysis
Seeds and Traits Dominates the Sustainable Agriculture Market with a 43.5% Share
In 2025, Seeds and Traits held a dominant market position, capturing more than a 43.5% share. The segment remained strong because improved seeds form the starting point for sustainable crop production, helping farmers manage weeds, insects, diseases, drought, and changing growing conditions.
- USDA data showed that more than 90% of U.S. corn, upland cotton, and soybean acreage used genetically engineered varieties in 2025. Herbicide-tolerant soybean seeds covered 96% of planted acreage, while stacked-trait seeds represented 84% of corn acreage and 87% of cotton acreage. These adoption levels demonstrate the important role of advanced seed traits in modern farming systems.
Biopesticides is the fastest-growing segment in the Sustainable Agriculture Market. Growth is supported by greater use of microbial pesticides, biochemical substances, plant-incorporated protectants, and naturally derived pest-control products. In 2025, the U.S. Environmental Protection Agency reported that it had registered 15 new biopesticide active ingredients since January. During 2026, the agency also reviewed new biological products intended for vegetables, cereal grains, corn, cotton, oilseeds, peanuts, soybeans, fruits, and other crops, widening their potential agricultural applications.
Type of Crops Analysis
Cereals and Grains Dominate with a 52.5% Share, Supported by Large Wheat Output.
In 2025, Cereals and Grains held a dominant market position, capturing more than a 52.5% share. The segment’s strong position is supported by the large-scale production of staple crops used for food, animal feed, and industrial processing.
- In September 2025, the USDA reported that U.S. wheat production reached 1.98 billion bushels, including 1.40 billion bushels of winter wheat. The average wheat yield was estimated at 53.3 bushels per acre. This high production base encourages farmers to use crop rotation, precision nutrient application, reduced tillage, and soil-conservation practices to maintain yields while lowering resource use.
Fruits and Vegetables is the fastest-growing segment in the Sustainable Agriculture Market. These crops usually provide higher returns per cultivated area, encouraging growers to invest in biological pest control, drip irrigation, protected cultivation, organic fertilizers, and soil-health monitoring. Sustainable methods are also becoming important because fruits and vegetables are sensitive to weather changes, pest damage, water shortages, and chemical residue requirements.
- In the 2025/26 season, USDA forecast global fresh table grape production to reach 30.0 million tonnes, increasing by 545,000 tonnes, while global exports were projected at 4.2 million tonnes. This expanding production and trade base is supporting greater adoption of efficient and environmentally responsible cultivation systems.
Farming System Analysis
Organic Farming Dominates with a 34.2% Share as Certified Agricultural Land Expands
In 2025, Organic Farming held a dominant market position, capturing more than a 34.2% share of the Sustainable Agriculture Market by farming system. Its strong position is supported by strict production standards, lower dependence on synthetic inputs and wider availability of certified organic products.
- According to the UK Department for Environment, Food & Rural Affairs, land farmed organically in the UK reached 540,000 hectares in 2025, representing an annual increase of 7.3%. The expansion of certified and conversion-stage farmland continues to strengthen the use of organic seeds, biological crop protection and natural soil-management practices.
Conservation Agriculture is the fastest-growing segment in the Sustainable Agriculture Market by farming system. Farmers are increasingly using minimum tillage, permanent soil cover and crop rotation to control erosion, retain moisture and reduce cultivation costs. In June 2026, the Food and Agriculture Organization reported that a conservation agriculture programme in southern Iraq supported 1,600 farmers. Farms applying these methods recorded a 25% increase in crop yields, while irrigation cycles declined by nearly 30%
Application Analysis
Food Production dominates with a 32.1% market share
Food Production held a dominant market position, capturing more than a 32.1% share. The segment remained ahead because sustainable farming practices support a stable supply of grains, fruits, vegetables and other essential food products. Farmers are increasingly using crop rotation, efficient irrigation, soil conservation and responsible input management to maintain productivity while reducing environmental pressure.
Bioenergy is the fastest-growing segment in the Sustainable Agriculture Market. Its growth is supported by the increasing use of crop residues, animal waste and other agricultural materials to produce renewable energy. Farmers are adopting bioenergy solutions to improve waste management, reduce dependence on conventional fuels and create additional income opportunities. The growing focus on circular farming and cleaner energy use is expected to strengthen the position of Bioenergy within sustainable agriculture.
Key Market Segments
By Product
- Seeds And Traits
- Biopesticides
- Biostimulants
- Others
By Type of Crops
- Cereals and Grains
- Fruits and Vegetables
- Oilseeds and Pulses
- Others
By Farming System
- Organic Farming
- Conservation Agriculture
- Precision Agriculture
- Agroecology / Regenerative Agriculture
- Others
By Application
- Bioenergy
- Food Production
- Foliar Spray
- Environmental Services
- Seed Treatment
- Soil Treatment
- Water Management
- Others
Driver Analysis
Climate-resilient missions (NMSA, NMNF, PDMC)
Climate-resilient policy missions such as the National Mission for Sustainable Agriculture (NMSA), Per Drop More Crop (PDMC), and the National Mission on Natural Farming (NMNF) are structurally shifting the economics of sustainable agriculture by hard-wiring integrated farming, micro-irrigation, and natural-input systems into India’s mainstream policy architecture. Under PDMC, micro-irrigation coverage has expanded to roughly 10.9 million hectares backed by central assistance of about ₹26,325 crore since 2015–16, directly lifting water-use efficiency, crop intensity, and unit yields in rainfed and semi-arid zones where yield volatility has historically depressed investment in sustainable technologies.
NMSA’s rainfed area development component has cumulatively deployed over ₹2,119.84 crore to cover 0.85 million hectares and support more than 1.4 million farmers, while complementary soil health initiatives have generated around 257.9 million Soil Health Cards by early 2026 and processed 9.753 million soil samples in FY 2025–26 alone, embedding nutrient-balancing practices into farm-level decision-making.
NMNF, approved in 2024 as a standalone scheme with an outlay of ₹2,481 crore incentivizes natural farming systems and reduced chemical dependency at scale. These programmes change business models by creating predictable, policy-backed demand for drip and sprinkler systems, soil-testing services, bio-inputs, integrated livestock-crop systems, and advisory platforms, allowing vendors and service providers to move from sporadic capex-driven sales to recurring service and input revenues and by lowering production risk, they also unlock cheaper credit and insurance, which feeds back into higher adoption of sustainable practices and technologies, justifying an incremental ~2.2 percentage point uplift to the sustainable agriculture CAGR over 2026–2030.
Driver Impact Analysis
| Driver | (~) % Impact on CAGR Forecast | Geographic Relevance | Impact Timeline |
|---|---|---|---|
| Climate-resilient missions (NMSA, NMNF, PDMC) | +2.2% | India core, South Asia, emerging APAC | Medium term (2–4 years) |
| Digital agriculture stack and data-driven governance | +1.6% | India core, APAC corridors, selective EU | Medium term (2–4 years) |
| Voluntary carbon markets for sustainable practices | +1.4% | India pilot, EU, Latin America spill-over | Long term (≥ 4 years) |
| Unified e-markets and FPO-led value chains | +1.3% | India core, broader developing Asia | Short–medium term (≤ 4 years) |
| High-value agriculture & agri-startup incubation | +1.0% | India core, APAC innovation hubs | Medium term (2–4 years) |
| Soil health & precision input management programmes | +0.8% | India core, global replication | Short–medium term (≤ 4 years) |
Restraint Analysis
High transition CAPEX and yield risk
The shift from conventional to sustainable agriculture is constrained by an unfavourable transition economics profile, where upfront CAPEX per hectare for precision irrigation, soil testing, and regenerative practices often rises by 30–60 percent versus conventional systems, while yields can temporarily fall by 5–15 percent in the first 3–5 cropping cycles, compressing margins and creating a negative cash‑flow window that many producers cannot absorb.
Government data on India’s agricultural policy reforms between 2014–2026 show cumulative MSP support of roughly INR 26.32 lakh crore, targeted at stabilising farm incomes but not fully offsetting the incremental cost of sustainable inputs, while production‑linked incentive schemes for food processing (outlay around INR 10,900 crore through 2026–27) primarily subsidise downstream value addition rather than on‑farm regenerative capex.
In advanced markets, CAPEX for controlled‑environment systems and digital precision tools typically adds USD 600–1,200 per hectare to baseline investment, with payback periods stretching to 6–9 years under current commodity price volatility, versus 3–5 years for conventional mechanisation. Operationally, this translates into a 200–300 basis point squeeze on operating margins during the transition, higher working capital burn as input intensity shifts from synthetic to biologicals, and delayed adoption decisions, with many mid‑sized farms deferring regenerative upgrades by 2–3 seasons; at a market level, this non‑linear adoption curve plausibly trims around 2.2 percentage points from the otherwise achievable CAGR as enterprises sequence CAPEX over longer horizons and ration scarce investment towards quicker‑payback interventions.
Restraint Impact Analysis
| Restraint | (~) % Impact on CAGR Forecast | Geographic Relevance | Impact Timeline |
|---|---|---|---|
| High transition CAPEX and yield risk | -2.2% | North America, EU, India, LATAM | Medium term (2–4 years) |
| Input cost and fertilizer price volatility | -1.6% | EU, North America, MENA, APAC corridors | Short–Medium term (≤ 4 years) |
| Fragmented regulation and certification bottlenecks | -1.4% | EU, UK, India, ASEAN, LATAM | Medium–Long term (≥ 2 years) |
| Limited access to concessional finance for smallholders | -1.8% | Sub-Saharan Africa, South Asia, LATAM | Long term (≥ 4 years) |
| Climate-driven supply chain disruption and infrastructure gaps | -1.2% | APAC coastal, Sub-Saharan Africa, EU periphery | Medium–Long term (≥ 2 years) |
Opportunity Analysis
Carbon & Ecosystem Services Monetization
By 2035, global voluntary and compliance carbon markets are widely expected to expand multi-fold, and if even 5–8% of arable land in North America, the EU, and emerging APAC is brought under verifiable regenerative practices, the addressable carbon credit volume could exceed 0.8–1.0 billion tons of CO₂-equivalent annually, translating to a realistic monetizable TAM of USD 15–25 billion per year at blended prices of USD 15–25 per ton.
Assuming sustainable agriculture currently captures less than 10% of this potential due to MRV complexity and fragmented project development, scaling standardized MRV platforms and farmer aggregation models could lift project-level margins by 400–600 basis points and add roughly 2.0 percentage points to sector CAGR as carbon-linked payouts of USD 80–150 per hectare per year are layered onto existing farm incomes.
The upside is untapped because most government programs today subsidize inputs or promote practices but do not directly remunerate ecosystem services; firms that build integrated carbon origination, registry partnerships, and farmer onboarding at scale over 2026–2030 can capture a structurally new asset class, with unit economics driven by portfolio-scale verification costs falling by 30–40% and project development timelines shrinking from 18–24 months to 9–12 months. This is a strategic pivot from “compliance-driven sustainability” to “asset-backed sustainability,” making carbon and biodiversity credits a core monetization engine rather than an incidental driver.
Opportunity Impact Analysis
| Opportunity | (~) % Potential CAGR Upside | Geographic Relevance | Execution Window |
|---|---|---|---|
| Carbon & Ecosystem Services Monetization | +2.0% | North America, EU, APAC emerging | Medium term (2-4 years) |
| Regenerative Input & Advisory Platforms | +1.8% | North America core, India, LATAM | Short term (≤ 2 years) |
| Climate-Smart Smallholder Mechanization Leasing | +1.5% | India, Sub-Saharan Africa, SE Asia | Medium term (2-4 years) |
| Organic & Sustainable Export Value Chains | +2.2% | India, APAC, LATAM to EU & NA | Medium term (2-4 years) |
| Data-Driven Risk & Yield Assurance Products | +1.7% | Global, with India & Africa focus | Long term (≥ 4 years) |
| Circular Bioeconomy from Agri Residues | +1.5% | EU, India, China, LATAM | Long term (≥ 4 years) |
Challenges Analysis
Fragmented smallholder structures
Persistent fragmentation of farm holdings structurally slows sustainable agriculture scale-up by increasing per-unit transaction, coordination, and compliance costs relative to larger industrial operations: in India and much of Asia and sub-Saharan Africa, over 80% of holdings are small or marginal, typically below 2 hectares, with NITI Aayog analysis confirming that weak aggregation systems and multi-intermediary chains result in 10–15% margin erosion and capacity underutilization for roughly one-third of agro-processing units.
From a growth perspective, the need to design interventions that work at the 1–2 hectare level, coupled with limited cooperative density and uneven access to shared machinery, effectively drags the market’s attainable CAGR by about 1.4 percentage points, as technology vendors and sustainable input suppliers face higher customer acquisition cost per farmer (often 1.5–2x), slower adoption curves (average 3–5 years to reach 25% penetration in target clusters), and greater variance in yield outcomes.
Strategically, leading corporates must invest in scalable aggregation architectures digital FPO networks, cluster-based contracting, and standardized quality protocols capable of integrating tens of thousands of smallholders per value chain, while governments expand evidence-based planning using agriculture census and cost-of-cultivation data despite 3–5 year publication lags and fragmented district-level boundaries that complicate longitudinal analytics. This requires sustained outlay on last-mile extension capacity (e.g., 1 agronomist per 200–300 farmers instead of the current 1:500–800 ratios in many districts), interoperable farmer data platforms, and risk-sharing contract models that gradually compress the fragmentation penalty and reclaim part of the lost growth.
Challenges Impact Analysis
| Challenge | (~) % CAGR Friction Drag | Geographic Relevance | Mitigation Horizon |
|---|---|---|---|
| Fragmented smallholder structures | -1.4% | Asia & Africa smallholder belt | Long term (≥ 4 years) |
| Post-harvest loss & cold chain gaps | -1.2% | Emerging-market food corridors | Medium term (2-4 years) |
| Agro-food labour & skills deficit | -1.0% | OECD agro-food hubs | Long term (≥ 4 years) |
| High-complexity data & monitoring | -0.9% | Global sustainability programs | Medium term (2-4 years) |
| SPS standards & compliance burden | -0.8% | Export-oriented agri economies | Medium term (2-4 years) |
| Climate variability & yield volatility | -1.5% | Climate-exposed production zones | Long term (≥ 4 years) |
Geopolitical Impact Analysis
War Disruptions Reshape the Sustainable Agriculture Market
Ongoing conflicts in Ukraine and the Middle East are pressuring the sustainable agriculture market by disrupting grain, fertilizer, fuel, and shipping networks. FAO estimated Ukraine’s 2025 cereal production at 60.8 million tonnes, around 6% below its five-year average, while 2025/26 cereal exports were forecast at 40 million tonnes, about 20% lower than the previous season. Disruption reduces farm income and raises costs for certified seeds, biological inputs, irrigation equipment, and low-emission machinery.
Conflict around the Strait of Hormuz adds another risk. UN Trade and Development reported in March 2026 that vessel traffic had fallen by over 95%, while roughly one-third of global seaborne fertilizer volumes normally pass through the route. Higher gas, freight, insurance, and fertilizer costs may force farmers to reduce input use, weakening yields and delaying sustainability projects.
War is also strengthening demand for local biofertilizers, renewable-powered irrigation, precision farming, drought-resistant crops, and regenerative practices. Ukraine’s Ministry of Economy reported that more than 12,000 hectares of agricultural land were returned to use through its demining compensation programme in 2025. This recovery effort shows how public investment in safer land, local inputs, and resilient supply chains can support sustainable agriculture despite conflict.
Regional Analysis
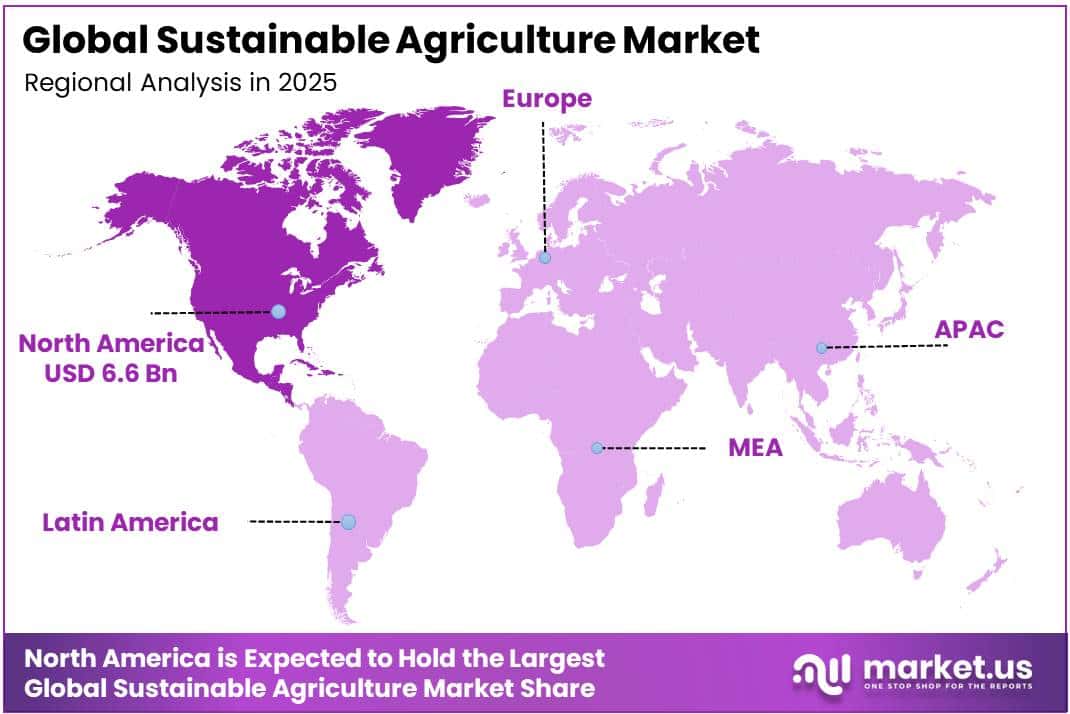
North America Leads Sustainable Agriculture with a 36.8% Share and USD 6.6 Billion
In 2025, North America held a dominant sustainable agriculture market position, capturing more than a 36.8% share and generating USD 6.6 billion. The region benefits from large farm operations, advanced machinery, strong organic demand and extensive public conservation programs.
- The USDA made up to USD 7.7 billion available for conservation practices during fiscal 2025, including USD 5.7 billion for climate-smart activities. It also accepted 1.78 million acres into the Conservation Reserve Program. Canada strengthened regional adoption by adding CAD 300 million to its On-Farm Climate Action Fund for thirteen delivery organizations over three years, supporting emission reduction and farm resilience.
Asia-Pacific is considered the fastest-growing segment, supported by its large agricultural workforce, rising food demand and urgent need for climate adaptation. Growth is being encouraged through low-carbon rice production, precision farming, water-efficient irrigation and digital services for smallholders. In June 2026, FAO reported USD 2.6 billion in proposed climate-smart agriculture investments across six Southeast Asian countries. The Asian Development Bank also committed up to USD 20 million in April 2025 to a regional impact fund covering sustainable food, agriculture, climate and water solutions.
Key Regions and Countries Covered
- North America
- The US
- Canada
- Europe
- Germany
- France
- The UK
- Spain
- Italy
- Russia & CIS
- Rest of Europe
- APAC
- China
- Japan
- South Korea
- India
- ASEAN
- Rest of APAC
- Latin America
- Brazil
- Mexico
- Rest of Latin America
- Middle East & Africa
- GCC
- South Africa
- Rest of MEA
Key Players Analysis
Kraft Heinz advances sustainable agriculture through its Grower Excellence Program and HeinzSeed network. Its 2025 ESG report states that HeinzSeed supports growers in more than 40 countries, while Brazilian tomato partners achieved productivity 25% above the national average. The company reported that 83% of Heinz ketchup tomatoes were sustainably sourced in 2024, against a 100% goal for 2025.
Mars integrates climate-smart farming across cocoa, rice, mint, wheat and other agricultural supply chains. In 2025, the company supported about 77 climate-smart agriculture projects covering 26 countries and 12 crops. Its livelihood programs reached more than 184,000 farmers, while value-chain greenhouse gas emissions declined 16.9% from the 2015 baseline.
Nestlé is expanding regenerative agriculture across coffee, cocoa, dairy, grains and other ingredient supply chains. In 2025, 27.6% of key ingredient volumes came from farmers adopting regenerative practices, while 96.7% of seven major primary supply chains were assessed as deforestation-free. Nescafé separately sourced 53% of its green coffee from regenerative farms and trained more than 100,000 farmers across 15 countries.
The Major Players in The Industry
- Archer Daniels Midland
- BASF SE
- Bayer
- Bunge Limited
- Cargill
- Corteva Agriscience
- Danone
- General Mills
- Kellogg Company
- Kraft Heinz
- Mars
- Monsanto
- Nestle
- Other Key Players
Key Development
- In May 2026, Bunge Limited opened its new Morristown, Indiana soy protein facility, supported by an investment of approximately USD 550 million. The plant is designed to process an additional 4.5 million bushels of soybeans and create around 70 permanent jobs
- In January 2025, ADM completed the USD 123 million acquisition of Vandamme Hungaria Kft., adding a 700-metric-ton-per-day non-GM oilseed and corn-germ processing facility in Hungary. The deal expanded its capacity to supply traceable non-GM food and feed products while supporting crop rotation opportunities for European farmers.
Report Scope
| Report Features | Description |
|---|---|
| Market Value (2025) | USD 17.8 Bn |
| Forecast Revenue (2035) | USD 47.8 Bn |
| CAGR (2026-2035) | 10.4% |
| Base Year for Estimation | 2025 |
| Historic Period | 2020-2024 |
| Forecast Period | 2026-2035 |
| Report Coverage | Revenue Forecast, Market Dynamics, Competitive Landscape, Recent Developments |
| Segments Covered | by product (Seeds And Traits, Biopesticides, Biostimulants, Others), type of crops (Cereals and Grains, Fruits and Vegetables, Oilseeds and Pulses, Others), farming system (Organic Farming, Conservation Agriculture, Precision Agriculture, Agroecology / Regenerative Agriculture, Others), and application (Bioenergy, Food Production, Foliar Spray, Environmental Services, Seed Treatment, Soil Treatment, Water Management, Others) |
| Regional Analysis | North America – The US & Canada; Europe – Germany, France, The UK, Spain, Italy, Russia & CIS, Rest of Europe; APAC– China, Japan, South Korea, India, ASEAN & Rest of APAC; Latin America– Brazil, Mexico & Rest of Latin America; Middle East & Africa– GCC, South Africa, & Rest of MEA |
| Competitive Landscape | Archer Daniels Midland, BASF SE, Bayer, Bunge Limited, Cargill, Corteva Agriscience, Danone, General Mills, Kellogg Company, Kraft Heinz, Mars, Monsanto, Nestle, Other Key Players |
| Customization Scope | Customization for segments, region/country-level will be provided. Moreover, additional customization can be done based on the requirements. |
| Purchase Options | We have three licenses to opt for: Single User License, Multi-User License (Up to 5 Users), Corporate Use License (Unlimited Users and Printable PDF) |





































