


Report Overview
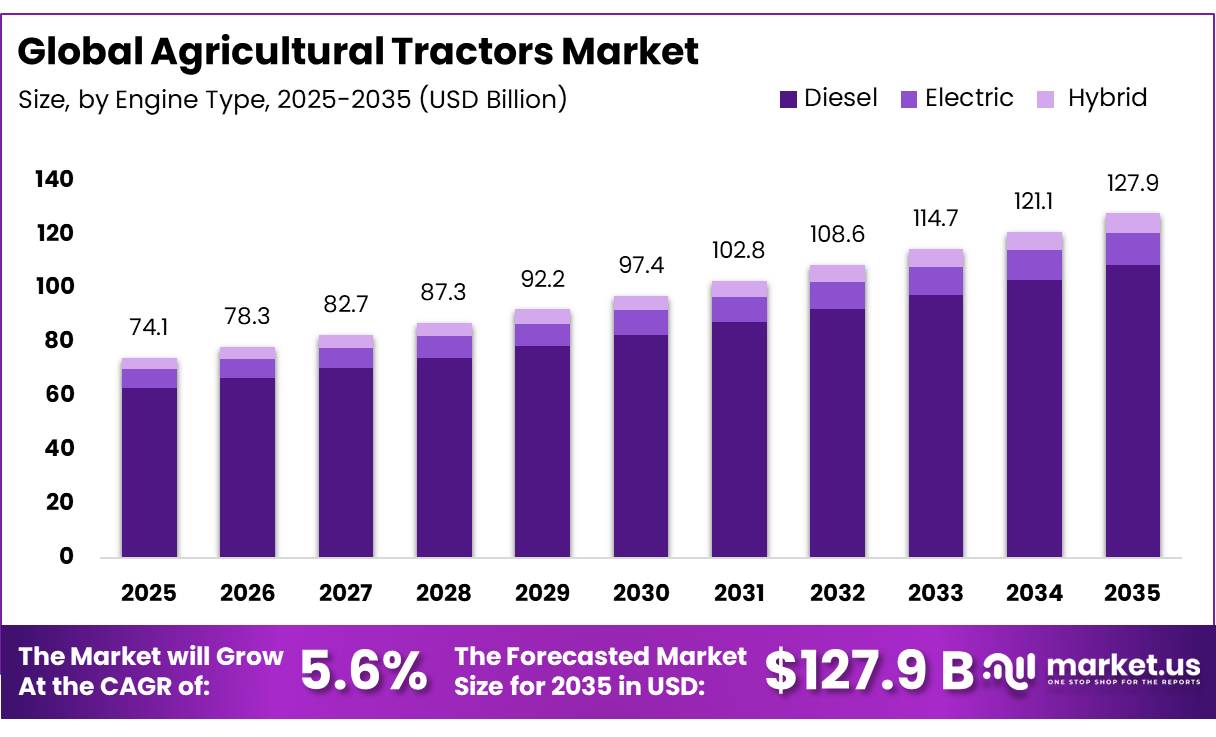
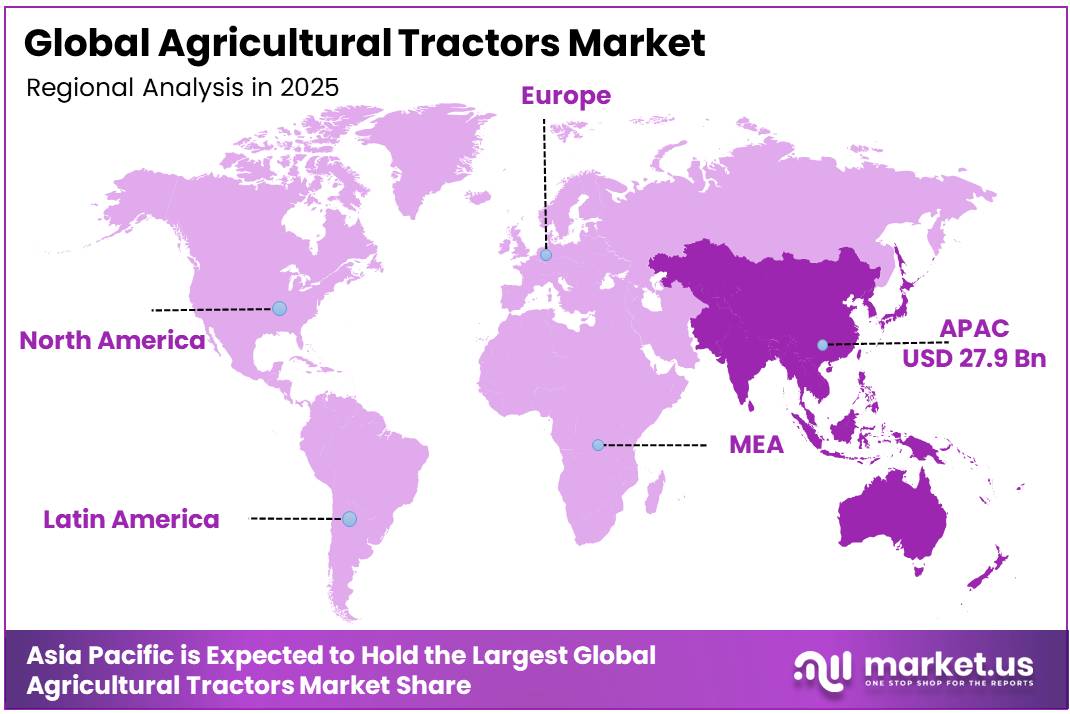
In 2025, the Global Agricultural Tractors Market was valued at USD 74.1 billion, and between 2026 and 2035, this market is estimated to register a CAGR of 5.6%, reaching about USD 127.9 billion by 2035. Asia Pacific held a dominant market position, capturing more than a 37.67% share, holding USD 27.93 billion in revenue.
The agricultural tractors market covers utility, row-crop, orchard, vineyard, electric, hybrid, and conventional machines used for soil preparation, planting, cultivation, spraying, transport, and harvesting support. Tractors remain central to farm mechanization because they reduce labour intensity and improve operational timing.
- The Food and Agriculture Organization states that cultivating one hectare requires 60 days with a hand hoe, approximately 3 days with animal power, and less than 1 day with a tractor-powered precision seeder. This productivity gap supports continuing investment in mechanized farming across diverse systems.
Key Takeaways
- The global agricultural tractors market was valued at USD 74.1 billion in 2025.
- The global market is projected to grow at a CAGR of 5.6% and is estimated to reach USD 127.9 billion by 2035.
- On the basis of purpose type, utility tractors dominated the market, constituting 43.45% of the total market share.
- Based on the engine type, diesel tractors dominated the agricultural tractors market, with a substantial market share of around 85.12%.
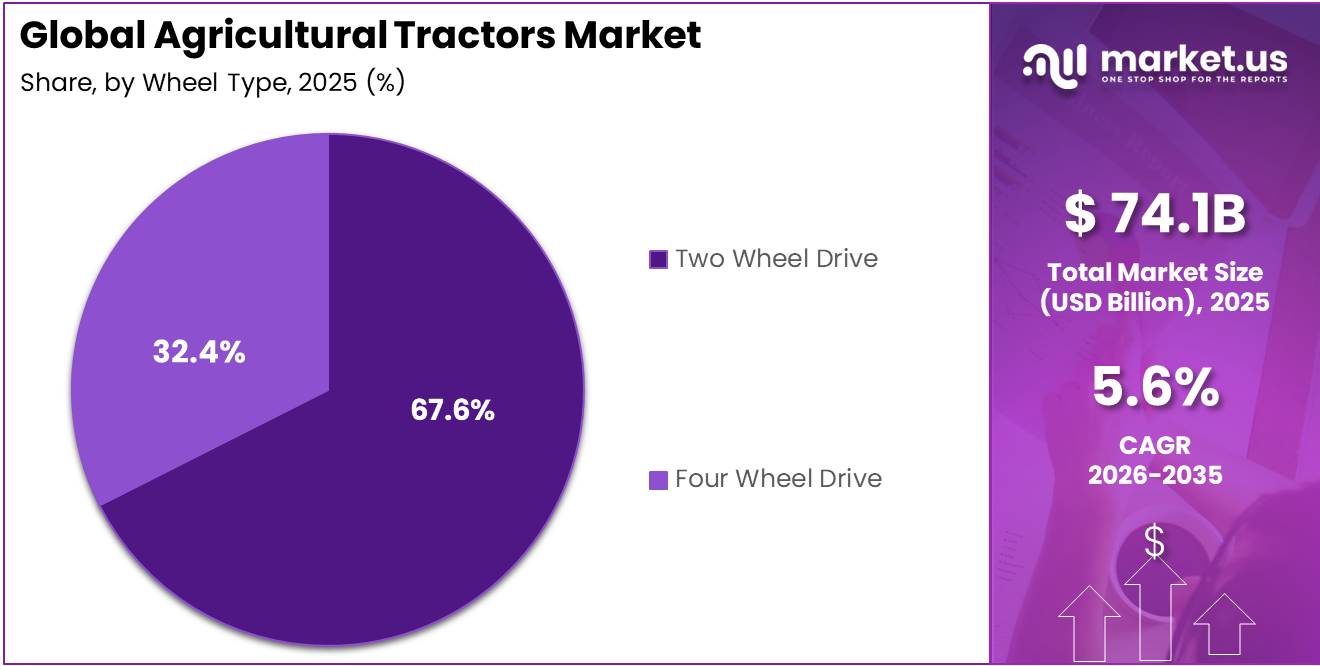
- Based on the wheel type, two-wheel-drive tractors led the market, comprising 67.56% of the total market.
- Among power output categories, the 40-100 HP segment held a major share in the agricultural tractors market, accounting for 56.34% of the market share.
- In 2025, Asia-Pacific was the most dominant region in the agricultural tractors market, accounting for 37.67% of the total market share.
The industrial scenario reflects long-term equipment needs but softer near-term purchasing. In March 2026, the Association of Equipment Manufacturers reported that United States farm tractor sales declined 12.2% in February 2026, reaching 9,804 units. Tractors below 40 horsepower accounted for 6,014 units, while four-wheel-drive tractor sales increased 11.3% to 148 units. These results indicate purchasing pressure alongside continuing demand for machines suited to demanding field conditions.
- In April 2025, the United States Department of Agriculture reported 1.88 million farms covering 876 million acres, with an average farm size of 466 acres in 2024. This operating base creates opportunities for connected tractors, automated guidance, telematics, low-emission engines, electric models, and specialized equipment for orchards, vineyards, livestock farms, and broad-acre production.
Government support is encouraging machinery modernization and technology adoption. In May 2025, the United Kingdom Department for Environment, Food and Rural Affairs announced 46.7 million British pounds through the Farming Equipment and Technology Fund. Its productivity category covered 66 equipment items, including tractor-powered electric weed-control systems, robotic drills, guided hoes, and precision farming tools. Such initiatives improve access to machinery, stimulate manufacturing activity, and support efficient tractors paired with digital implements and environmental attachments.
Purpose Type Analysis
Utility tractors dominate with a 43.45% share due to their versatility across farm operations.
In 2025, Utility Tractors held a dominant market position, capturing more than a 43.45% share. Their leadership reflects broad use across small and medium farms for tillage, hauling, mowing, planting support, loader work, and livestock operations. Farmers value these machines because they can handle multiple implements, operate in confined areas, and complete tasks without requiring highly specialized equipment. Wide model availability, straightforward servicing, and compatibility with established attachments continue to support purchasing across mixed farming systems.
- For instance, in January 2025, according to Case IH, the company introduced upgraded Quantum specialist tractors, including a row-crop version with improved operating features, cab comfort, lighting, and automated four-wheel-drive disengagement.
Row Crop Tractors are the fastest-growing segment as commercial farms increasingly require machines designed for accurate planting, cultivation, spraying, and post-emergence fieldwork. Their adjustable configurations, higher clearance, precise steering, and compatibility with digital guidance systems help protect crops while improving field efficiency. Growth is also supported by larger planting equipment, tighter application windows, and rising adoption of precision farming practices that require consistent movement between crop rows and dependable implement control during operations.
Engine Type Analysis
Diesel tractors dominate with an 85.12% share due to their power, endurance, and established infrastructure.
In 2025, Diesel held a dominant market position, capturing more than a 85.12% share. Diesel tractors remained preferred because they deliver strong torque, dependable pulling power, long operating hours, and convenient refuelling for demanding field work. Their established servicing network and compatibility with heavy implements support use across tillage, planting, hauling, and harvesting operations. Farmers also rely on diesel machines where charging infrastructure remains limited or seasonal workloads require uninterrupted performance.
- For instance, in February 2025, according to Monarch Tractor, the company began the commercial rollout of its Autodrive technology for the fully electric MK-V tractor, enabling autonomous feed-pushing operations for dairy farms.
Electric is the fastest-growing segment as farms seek quieter machinery, lower operating emissions, reduced routine maintenance, and better use of renewable electricity. Electric tractors are increasingly suited to orchards, vineyards, livestock facilities, municipalities, and other operations with predictable working cycles. Battery improvements, charging investment, digital controls, and autonomous functions are strengthening their practical value. Their quieter operation also supports work near animals and populated areas, while instant torque improves responsiveness during loader, transport, and specialty farming tasks.
Wheel Type Analysis
Two Wheel Drive tractors dominate with a 67.56% share due to their affordability and practical performance.
In 2025, Two Wheel Drive held a dominant market position, capturing more than a 67.56% share. Its leadership was supported by lower purchase costs, simpler drivetrains, easier maintenance, and dependable performance on level farmland. These tractors remain practical for cultivation, transport, spraying, mowing, and light tillage, where farmers prioritize fuel economy and straightforward servicing. Their lighter construction supports manoeuvrability around smaller fields and narrow access routes.
- For instance, in August 2025, according to Case IH, the company announced that the Steiger Quadtrac would make its global debut at AgQuip, highlighting improved traction, field productivity, and control during demanding agricultural operations.
Four Wheel Drive is the fastest-growing segment as farmers increasingly require stronger grip, improved pulling capability, and stable operation on wet, loose, sloping, or uneven ground. Power delivered across both axles helps reduce wheel slip and supports heavier implements during planting, tillage, and hauling. Adoption is rising across farms where shorter working windows demand reliable field access. Improved steering, automatic engagement, precision guidance, and operator-assistance technologies are making these tractors easier to control while supporting performance in difficult conditions overall.
Power Output Analysis
40-100 HP tractors dominate with a 56.34% share due to their balanced power and versatility.
In 2025, 40-100 HP held a dominant market position, capturing more than a 56.34% share. The segment remained preferred because it offers a practical balance of pulling power, fuel use, manoeuvrability, and implement compatibility. These tractors support tillage, planting, spraying, loader work, transport, and livestock duties across medium-sized farms. Their availability and suitability for year-round operations continued to strengthen demand among farmers seeking one machine for several tasks.
- For instance, in September 2025, according to Kubota Tractor Corporation, the company introduced its next-generation Grand L70 Series compact tractors with upgraded transmission controls, operator technology, and improved cab comfort for users.
Less Than 40 HP is the fastest-growing segment as small farms, orchards, vineyards, landscaping businesses, and property owners increasingly seek compact, affordable, and easy-to-operate machinery. These tractors suit mowing, light cultivation, material handling, and work in confined spaces where larger machines are less practical. Lower fuel needs, easier storage, simple maintenance, and compatibility with loaders, backhoes, and mowing attachments support adoption. Growing interest in compact mechanization and multipurpose equipment is improving the segment’s outlook across developed and emerging farming communities.
Key Market Segments
Purpose Type
- Utility Tractors
- Row Crop Tractors
- Orchard & Vineyard Tractors
- Othes Type
Engine Type
- Diesel
- Electric
- Hybrid
Wheel Type
- Two Wheel Drive
- Four Wheel Drive
Power Output
- Less Than 40 HP
- 40-100 HP
- 101-200 HP
Driver Analysis
Precision retrofit and smart guidance monetization
Precision agriculture is becoming a tractor demand accelerator because buyers no longer need to wait for a fully autonomous machine purchase cycle; they can justify a new tractor or upgrade through steering kits, telemetry, implement guidance, and variable-rate compatibility that improve payback within the existing farm budget structure. The public evidence base supports this direction: EU agriculture policy explicitly ties competitiveness and sustainability to digital modernization, while the CAP framework for 2023–2027 includes performance-led support architecture and a total budget of €387 billion, with rural-development resources and digital infrastructure already reaching 18 million rural citizens in the prior period.
In parallel, satellite-enabled agriculture guidance is supported by positioning accuracy in the 10–30 cm band with SBAS or DGNSS, which is sufficient for many spraying, seeding, and controlled-traffic tasks and lowers the barrier to adoption for mid-tier tractor fleets. Strategically, this shifts tractor OEM economics from a one-time iron sale toward higher-margin software, activation keys, annual connectivity bundles, and dealer-installed retrofit packages, which raises lifetime value per tractor and supports an estimated +1.9 percentage-point uplift to forward CAGR in regions where labor costs and input optimization matter most.
Drivers Impact Analysis
| Driver | (~) % Impact on CAGR Forecast | Geographic Relevance | Impact Timeline |
|---|---|---|---|
| Precision retrofit and smart guidance monetization | +1.9% | North America core, EU, India, Australia, Brazil | Short term (≤ 2 years) |
| Farm income support and mechanization-linked subsidies | +1.6% | EU core, India, China, Brazil spill-over | Short term (≤ 2 years) |
| Replacement demand after 2024–2025 volume softness | +1.4% | North America, Europe, selective LATAM | Medium term (2-4 years) |
| Higher-power and specialty tractor mix-upgrading | +1.3% | North America, Europe, Brazil, premium India pockets | Medium term (2-4 years) |
| Digital fleet management and uptime economics | +1.1% | North America, EU, Australia, large-farm LATAM | Short term (≤ 2 years) |
| Emissions compliance and decarbonization-led product renewal | +0.9% | EU, North America, advanced APAC | Long term (≥ 4 years) |
Restraint Analysis
High upfront cost and credit access gaps
High upfront cost combined with patchy access to affordable credit remains the single largest drag on tractor adoption in smallholder-dominated regions, because even a mid-range tractor represents several years of net farm income and collateral quality is often weak, forcing many farmers into short-tenor loans with effective interest rates in the mid-teens or higher, versus 3–6% typical equipment finance in mature markets.
This translates into delayed purchase decisions, preference for shared or rental tractors, and a bias toward low-horsepower, lower-feature units, compressing unit margins and slowing the upgrade cycle. The value destruction mechanism is clear: OEMs and dealers face higher customer acquisition costs per sale, lower average selling prices, and greater credit risk, while farmers remain locked into low-productivity cultivation practices, collectively shaving an estimated 2.1 percentage points off the otherwise achievable CAGR in regions where smallholders dominate and formal rural credit penetration is low.
Restraint Impact Analysis
| Restraint | (~) % Impact on CAGR Forecast | Geographic Relevance | Impact Timeline |
|---|---|---|---|
| High upfront cost and credit access gaps | -2.1% | APAC smallholder belts, Africa, LATAM | Long term (≥ 4 years) |
| Volatile farm income and commodity cycles | -1.8% | North America core, EU, Brazil, Australia | Medium term (2-4 years) |
| Supply chain and component lead-time disruptions | -1.6% | North America, EU, APAC corridors | Short term (≤ 2 years) |
| Labor shortages and operator skill gaps | -1.4% | North America, EU, advanced APAC | Medium term (2-4 years) |
| Regulatory and homologation barriers | -1.3% | Emerging APAC, Africa, LATAM | Long term (≥ 4 years) |
| Limited digital and power infrastructure in rural areas | -1.2% | APAC interiors, Africa, parts of LATAM | Long term (≥ 4 years) |
Opportunity Analysis
Tractor-as-a-Service and pay-per-acre monetization
If an OEM or fintech-equipment partnership systematically digitizes custom-hiring centers across even 15–20% of the roughly 600 million smallholder farm plots across Asia and Africa, the implied service-hours TAM could scale into the low tens of billions of dollars annually, a pool almost entirely outside today’s unit-sales-based CAGR.
The unit economics shift is structural: instead of a single ~5–8% dealer margin on a tractor sale, a service operator captures recurring take-rates of an estimated 8–15% per rental transaction plus data and insurance cross-sell, compressing customer acquisition cost over time as usage frequency rises. Because this requires new fintech rails, GPS-based utilization tracking, and trust-building in cash-based rural economies, meaningful scale is achievable only in a 2–4 year execution window, justifying an estimated +2.4 percentage point CAGR upside if captured.
Opportunity Impact Analysis
| Opportunity | (~) % Potential CAGR Upside | Geographic Relevance | Execution Window |
|---|---|---|---|
| Tractor-as-a-Service and pay-per-acre monetization | +2.4% | APAC smallholder belts, Africa, LATAM | Medium term (2-4 years) |
| Compact and mid-power electric tractor white space | +2.0% | EU, APAC (India, China), North America niches | Medium term (2-4 years) |
| Autonomy-as-a-retrofit subscription revenue | +1.9% | North America core, EU, Australia | Short term (≤ 2 years) |
| Certified used-tractor digital marketplaces | +1.5% | APAC, LATAM, Africa, EU secondary markets | Short term (≤ 2 years) |
| Data-monetization and agronomic advisory bundling | +1.3% | North America, EU, large-farm APAC/LATAM | Long term (≥ 4 years) |
| Roll-up M&A of regional dealer and rental networks | +1.1% | LATAM, APAC emerging, Africa | Long term (≥ 4 years) |
Challenges Analysis
Cyclical demand volatility
Cyclical demand volatility is a persistent challenge because tractor OEMs and dealers must continuously navigate swings in unit orders tied to commodity prices, farm income, and interest-rate regimes, which do not eliminate sales but increase variance around the trend line and complicate forecasting; in a typical mature market, annual tractor demand can fluctuate by ±10–20% around the mean over a 3–5-year cycle, with correlation to corn, soybean, wheat, and dairy price movements and to benchmark rates rising or falling by 100–200 basis points.
This volatility elevates working-capital requirements—inventory days can stretch from 60–90 days in stable years to 120–150 days in downcycles—forcing dealers to discount aggressively and compress gross margins by 200–400 basis points in soft seasons, while OEM production plans must be constantly re-optimized, adding planning and changeover costs per unit.
Strategically, companies counter this by diversifying geographies, expanding aftermarket and service revenue share from perhaps 20–25% of segment revenue to 30–35%, and building better demand-sensing and order-forecasting models; however, the residual noise still trims roughly 1.3 percentage points from the market’s maximum achievable CAGR as capacity, capex, and R&D decisions are made cautiously under uncertainty rather than purely on long-term demand potential.
Challenges Impact Analysis
| Challenge | (~) % CAGR Friction Drag | Geographic Relevance | Mitigation Horizon |
|---|---|---|---|
| Cyclical demand volatility | -1.3% | North America core, EU, Brazil | Medium term (2-4 years) |
| Parts and logistics complexity | -1.1% | North America, EU, APAC corridors | Short term (≤ 2 years) |
| Skilled technician scarcity | -1.0% | North America, EU, advanced APAC | Long term (≥ 4 years) |
| Digital adoption heterogeneity | -0.9% | APAC interiors, Africa, LATAM | Long term (≥ 4 years) |
| Regulatory and standards fragmentation | -0.8% | EU regulatory hubs, emerging APAC, Africa | Medium term (2-4 years) |
| Climate and weather variability risk | -0.7% | Global cropping belts | Long term (≥ 4 years) |
Geopolitical Impact Analysis
Geopolitical Realignment and Supply Chain Fragmentation Reshaping Agricultural Tractor Manufacturing
Geopolitical tensions are reshaping the agricultural tractors market through tariffs, export restrictions, and disrupted trade routes. Tractor production depends on traded steel, aluminium, electronics, engines, hydraulic parts, and precision-control systems. Trade policy therefore influences component costs, supplier selection, production schedules, and equipment affordability.
- In April 2025, the World Trade Organization projected that global merchandise trade volume could decline by 0.2% during 2025, while North American exports could fall by 12.6%. Weaker trade flows and policy uncertainty can reduce machinery exports, delay dealer inventories, and encourage manufacturers to establish regional assembly and sourcing networks.
Metal tariffs are changing manufacturing economics. In June 2026, the United States included agricultural equipment among derivative products subject to a temporarily reduced 15% duty. The measure acknowledged that agricultural machines are treated as aluminium or steel derivatives. It may raise costs while encouraging metal sourcing, assembly, and supplier qualification.
Supply concentration creates risks for electric and digital tractors. Eurostat reported that European Union rare-earth imports fell 29.3% to 12,900 tonnes in 2024, with China supplying 46.3%. The Organisation for Economic Co-operation and Development reported that export restrictions covered 45% of rare-earth exports in 2022-2024. These pressures encourage dual sourcing, inventory buffers, manufacturing, and simplified component designs.
Regional Analysis
Asia-Pacific dominates with a 37.67% share, supported by expanding farm mechanization.
In 2025, Asia-Pacific held the dominant position in the agricultural tractors market, capturing 37.67% of global revenue and generating approximately USD 27.93 billion. Regional leadership reflects crop production, large farming populations, rising equipment replacement, and policy support for mechanization. China’s National Bureau of Statistics reported that the comprehensive mechanization rate for crop cultivation and harvesting reached 76.7% in 2025, strengthening demand for utility, row-crop, compact, and higher-power tractors across varied terrain and farm sizes.
Middle East & Africa is the fastest-growing region as governments and development agencies expand mechanization access, local servicing, and equipment-financing models. In March 2026, the Food and Agriculture Organization reported that more than 60% of African farmland was still cultivated manually, only 10% used motorized power, and average farm power stood at 0.27 horsepower per hectare. This gap creates substantial scope for affordable tractors, rental fleets, two-wheel machines, operator training, spare-parts networks, and locally adapted equipment.
Key Regions and Countries Covered
- North America
- The US
- Canada
- Europe
- Germany
- France
- The UK
- Spain
- Italy
- Russia & CIS
- Rest of Europe
- APAC
- China
- Japan
- South Korea
- India
- ASEAN
- Rest of APAC
- Latin America
- Brazil
- Mexico
- Rest of Latin America
- Middle East & Africa
- GCC
- South Africa
- Rest of MEA
Key Players Analysis
Agricultural tractor manufacturers focus on product reliability, engine efficiency, operational comfort, and digital integration to strengthen their competitive position. A major priority is the development of versatile tractors with precision guidance, telematics, automated steering, and improved transmission systems that support higher field productivity. Companies such as Deere & Company, CNH Industrial N.V., AGCO Corporation, and Kubota Corporation maintain strong market positions through broad product portfolios, established dealer networks, and equipment designed for utility, row-crop, orchard, and high-power farming applications.
Manufacturers also invest in electric and hybrid models, connected farm platforms, localized production, and after-sales support to improve customer retention. CLAAS KGaA mbH, SDF S.p.A., Yanmar Holdings Co., Ltd., and Daedong Corporation strengthen their presence through specialized tractors and region-specific product development. Strategic partnerships with implement producers, technology providers, and agricultural dealers help expand market access, while financing support, spare-parts availability, and maintenance services improve long-term customer relationships across developed and emerging farming regions.
Market Key Players
- Deere & Company
- CNH Industrial N.V.
- AGCO Corporation
- Kubota Corporation
- Mahindra & Mahindra Limited
- CLAAS KGaA mbH
- SDF S.p.A.
- Yanmar Holdings Co., Ltd.
- Argo Tractors S.p.A. (ARGO S.p.A.)
- Weichai Lovol Intelligent Agricultural Technology Co., Ltd.
- LS Mtron Ltd. (LS Corp.)
- Daedong Corporation
- Other Key Players
Key Development
- In January 2026, Kubota Corporation showcased its Autonomous M5 Narrow Tractor at CES 2026. Developed with Agtonomy, the tractor was designed for specialty crops and supports automated activities such as crop-growth sensing and chemical spraying.
- In February 2026, CNH Industrial N.V., through its Case IH brand, launched the Farmall 35A and 40A compact tractors with upgrades focused on operator comfort, versatility, and performance across farming and property-maintenance applications.
- In June 2026, AGCO Corporation’s Valtra brand produced its 1,000th continuously variable transmission at the Suolahti factory in Finland. The expanded facility was established through a EUR 38 million investment and supplies transmissions for selected Valtra, Fendt, and Massey Ferguson tractors.
Report Scope
| Report Features | Description |
|---|---|
| Market Value (2025) | USD 74.1 Bn |
| Forecast Revenue (2035) | USD 127.9 Bn |
| CAGR (2026-2035) | 5.6% |
| Base Year for Estimation | 2025 |
| Historic Period | 2020-2024 |
| Forecast Period | 2026-2035 |
| Report Coverage | Revenue Forecast, Market Dynamics, Competitive Landscape, Recent Developments |
| Segments Covered | By Purpose Type (Utility Tractors, Row Crop Tractors, Orchard & Vineyard Tractors, and Others), By Engine Type (Diesel, Electric, and Hybrid), By Wheel Type (Two Wheel Drive and Four Wheel Drive), By Power Output (Less Than 40 HP, 40-100 HP, and 101-200 HP) |
| Regional Analysis | North America – The US & Canada; Europe – Germany, France, The UK, Spain, Italy, Russia & CIS, Rest of Europe; APAC– China, Japan, South Korea, India, ASEAN & Rest of APAC; Latin America– Brazil, Mexico & Rest of Latin America; Middle East & Africa– GCC, South Africa, & Rest of MEA |
| Competitive Landscape | Deere & Company, CNH Industrial N.V., AGCO Corporation, Kubota Corporation, Mahindra & Mahindra Limited, CLAAS KGaA mbH, SDF S.p.A., Yanmar Holdings Co., Ltd., Argo Tractors S.p.A. (ARGO S.p.A.), Weichai Lovol Intelligent Agricultural Technology Co., Ltd., LS Mtron Ltd. (LS Corp.), Daedong Corporation, and Other Key Players. |
| Customization Scope | Customization for segments, region/country-level will be provided. Moreover, additional customization can be done based on the requirements. |
| Purchase Options | We have three licenses to opt for: Single User License, Multi-User License (Up to 5 Users), Corporate Use License (Unlimited Users and Printable PDF) |





































