


Report Overview
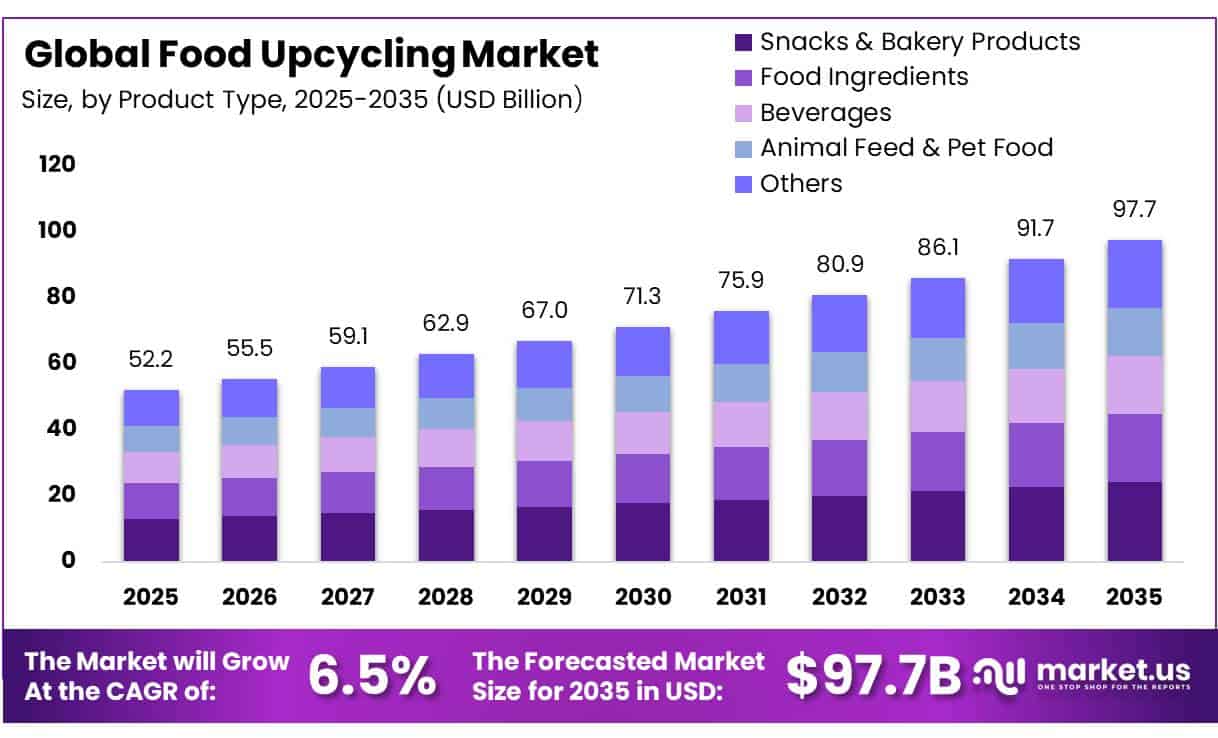
In 2025, the Global Food Upcycling Market was valued at USD 52.2 billion, and between 2026 and 2035, this market is estimated to register a CAGR of 6.5%, reaching about USD 97.7 billion by 2035. North America held a dominant market position, capturing more than a 55.7% share, holding USD 29.08 billion in revenue.
The food upcycling industry converts edible side streams, surplus ingredients, and processing by-products into foods, beverages, powders, fibres, proteins, oils, and flavouring inputs. It connects food manufacturing with circular production by recovering value from fruit pomace, vegetable peels, spent grain, coffee pulp, and dairy streams.
- In March 2024, the United Nations Environment Programme reported that 1.05 billion tonnes of food were wasted in 2022, equal to 132 kilograms per person and 19% of food available to consumers.
Key Takeaways
- The global Food Upcycling market was valued at USD 52.2 billion in 2025.
- The global market is projected to grow at a CAGR of 6.5% and is estimated to reach USD 97.7 billion by 2035.
- On the basis of source, Fruit & Vegetable Waste dominated the market, constituting 36.0% of the total market share.
- Based on type, Snacks & Bakery Products dominated the Food Upcycling market, with a substantial market share of around 24.8%.
- Based on the distribution channel, Supermarkets & Hypermarkets led the market, comprising 48.0% of the total market.
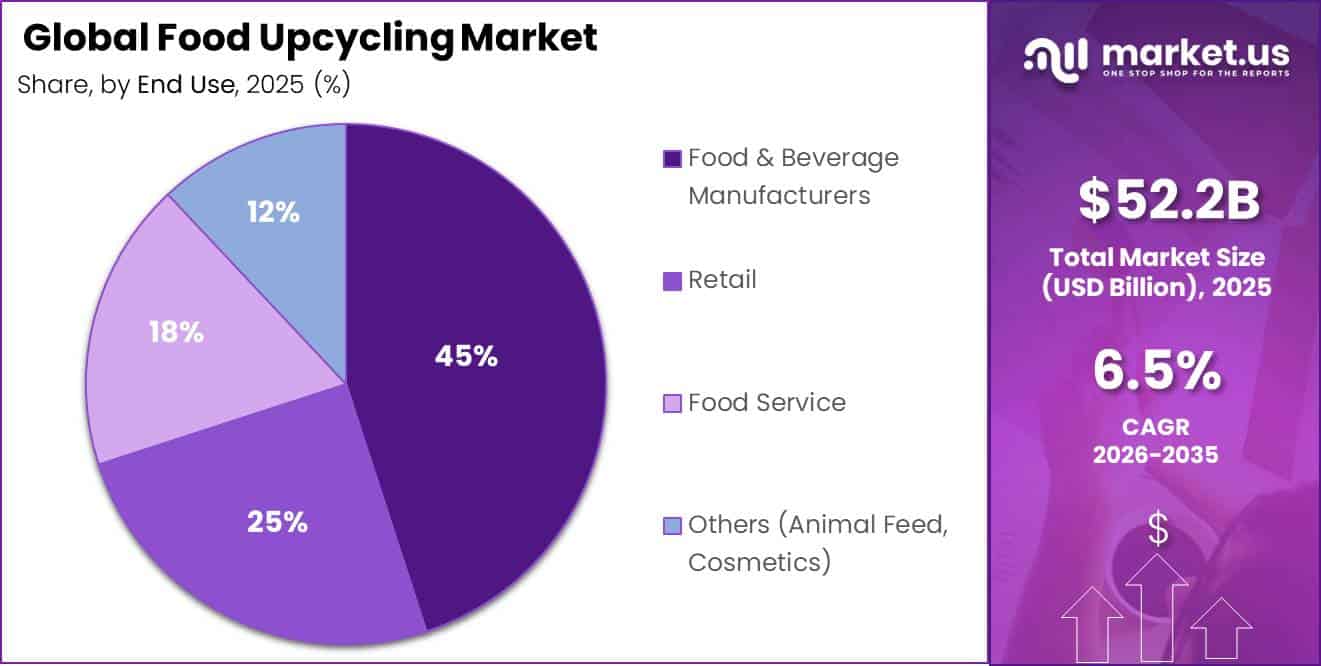
- Among the end-uses, Food & Beverage Manufacturers held a major share in the Food Upcycling market, accounting for 45.0% of the market share.
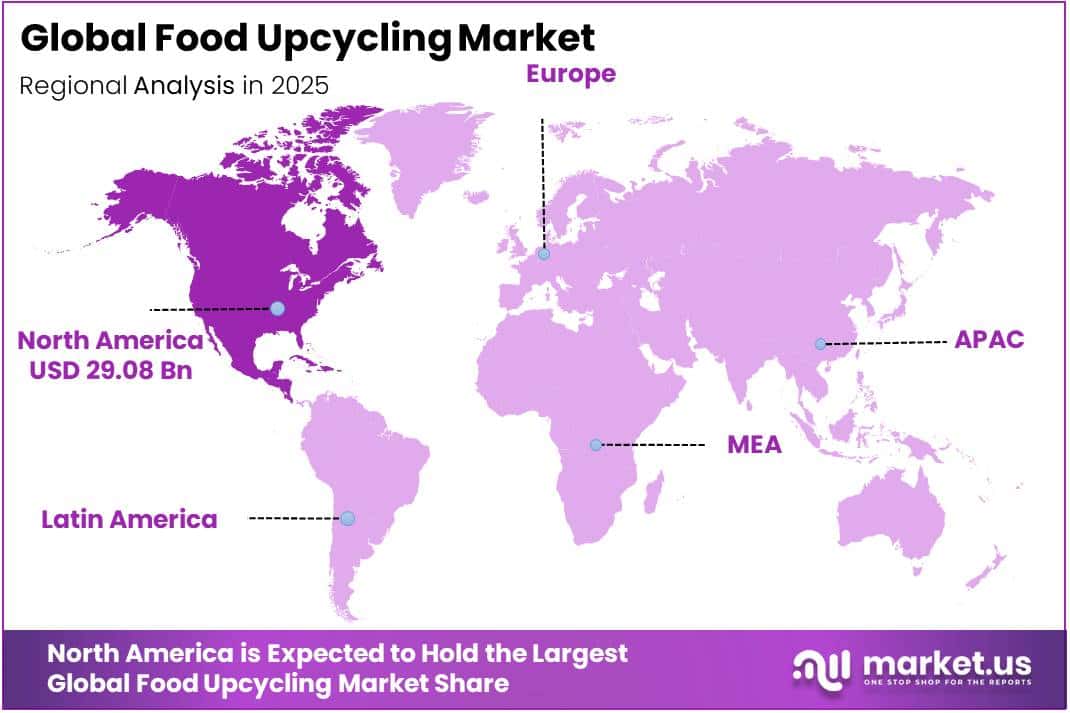
- In 2025, North America was the most dominant region in the Food Upcycling market, accounting for 55.7% of the total global market
The industrial scenario is supported by material lost before retail. In September 2025, the Food and Agriculture Organization stated that 13.2% of food, equivalent to 1.25 billion tonnes, is lost after harvest and before reaching retail. This creates a feedstock base for processors managing collection, traceability, safety testing, stabilization, drying, extraction, and standardized ingredient production. Commercial success depends on reliable sourcing agreements and consistent nutritional, sensory, and functional performance.
- The United Nations Environment Programme estimates that food loss and waste generate 8% to 10% of global greenhouse gas emissions. Upcycling can help manufacturers reduce disposal volumes while creating higher-value products for bakery, snacks, beverages, animal nutrition, and foodservice. Growth opportunities are strongest where companies prove safety, shelf stability, transparent sourcing, and measurable environmental benefits.
Government initiatives are strengthening the market framework. In June 2024, the United States Department of Agriculture released a national strategy supporting a 50% reduction in food loss and waste by 2030. In February 2025, the Council of the European Union and Parliament agreed on 2030 reduction targets of 10% for processing and manufacturing waste and 30% per capita for retail, restaurants, food services, and households. These policies encourage prevention, redistribution, recycling, innovation, investment, and partnerships across increasingly circular global food supply chains.
Source Analysis
Fruit & Vegetable Waste dominates with 36.0% because broad availability supports efficient ingredient recovery.
In 2025, Fruit & Vegetable Waste held a dominant market position, capturing more than a 36.0% share. Its leadership was supported by steady volumes generated during sorting, cutting, juicing, and food preparation. Processors can convert these materials into fibres, powders, concentrates, colourants, and functional ingredients for bakery products, snacks, beverages, and nutrition applications. Their familiar origin, natural composition, and compatibility with drying or extraction technologies make them attractive for manufacturers seeking traceable inputs and improved material utilization.
- For instance, in June 2026, according to Coles Group, Zest Element received support to build a mobile solar-powered dehydration hub that converts surplus and out-of-spec fruit into shelf-stable powders.
Agricultural By-products are expected to be the growing segment. Growth is supported by rising interest in recovering useful compounds from crop-processing streams that were previously treated as low-value material. Better separation, stabilization, fermentation, and milling methods are helping producers create consistent ingredients while opening additional revenue opportunities for farms and processors across circular food supply chains in international food markets.
Type Analysis
Snacks & Bakery Products dominate with 24.8% because familiar formats make upcycled ingredients easier to introduce.
In 2025, Snacks & Bakery Products held a dominant market position, capturing more than a 24.8% share. Their leadership was supported by the flexibility of biscuits, bars, bread, crackers, cakes, and similar products in accepting fruit fibres, spent grains, vegetable powders, and other recovered ingredients. Manufacturers can adjust recipes while preserving convenient formats, familiar taste expectations, and shelf stability. These products also provide a clear route for communicating waste-reduction benefits without requiring major changes in consumer eating habits.
- For instance, in June 2025, according to the European Commission’s CORDIS platform, MOA Foodtech advanced fermentation technology that transforms food-industry by-products into customizable protein ingredients for commercial food development.
Agricultural Food Ingredients are expected to be the growing segment. Growth is supported by improved extraction, fermentation, drying, and milling methods that convert agricultural side streams into proteins, fibres, flavours, and functional compounds. Ingredient suppliers can serve several product categories, giving processors greater formulation flexibility while creating additional value from materials that previously had limited commercial use.
Distribution Channel Analysis
Supermarkets & Hypermarkets dominate with 48.0% because broad visibility supports mainstream product discovery.
In 2025, Supermarkets & Hypermarkets held a dominant market position, capturing more than a 48.0% share. Their leadership was supported by large customer traffic, established grocery routines, and the ability to position upcycled foods beside familiar snacks, bakery items, beverages, and ingredients. Physical stores also allow shoppers to compare labels, packaging, prices, and sustainability claims before purchase. Retailers can strengthen adoption through dedicated displays, in-store sampling, promotional campaigns, and placement within health, organic, or environmentally focused sections, helping emerging brands reach wider audiences.
- For instance, in February 2025, according to the Specialty Food Association, Upcycled Foods, Inc. and Misfits Market launched the retailer’s first upcycled breads under its Odds & Ends private label.
Online Sales Channels are expected to be the growing segment. Their expansion is supported by direct brand storytelling, searchable product information, subscription options, wider geographic reach, and easier access to specialized products. Digital platforms also help smaller upcycled brands test demand, gather customer feedback, and reach buyers beyond traditional retail networks across regional and international consumer markets.
End Use Analysis
Food & Beverage Manufacturers dominate with 45.0% because scalable formulation supports commercial use.
In 2025, Food & Beverage Manufacturers held a dominant market position, capturing more than a 45.0% share. Their leadership was supported by the ability to incorporate upcycled fibres, proteins, powders, flavours, and concentrates into established production lines. Large manufacturers can test ingredient performance, standardize recipes, secure regular side-stream supplies, and introduce products across bakery, snack, beverage, and nutrition categories. Existing quality systems, technical teams, and distribution networks also help them manage safety, traceability, shelf life, and consumer communication while expanding circular product portfolios.
- For instance, in September 2025, according to Upcycled Foods, Inc., the company received a BEAM Circular research grant to develop new commercial uses for almond hulls with the Almond Board of California.
Retail is expected to be a growing segment. Its expansion is supported by stronger shelf visibility, private-label development, sustainability-focused merchandising, and direct consumer education. Retailers can introduce certified upcycled products through dedicated displays, loyalty programmes, sampling, and clear packaging, helping smaller brands reach mainstream shoppers and encouraging repeat purchases across physical and digital stores.
Key Market Segments
By Source
- Fruit & Vegetable Waste
- Agricultural By-products
- Food Processing Waste
- Grains & Others
By Type
- Snacks & Bakery Products
- Food Ingredients
- Beverages
- Animal Feed & Pet Food
- Others
By Distribution Channel
- Supermarkets & Hypermarkets
- Online Sales Channels
- Food Service
- Specialty Stores & Others
By End-Use
- Food & Beverage Manufacturers
- Retail
- Food Service
- Others (Animal Feed, Cosmetics)
Driver Analysis
Food-waste mandates and landfill avoidance
Regulatory pressure increasingly converts food residuals from a disposal issue into a recoverable-input opportunity: the EU’s revised Waste Framework Directive entered into force on 16 October 2025 and requires member states to reduce food waste by 10% in processing/manufacturing and by 30% per capita across retail, restaurants, foodservice and households by 2030; member states must designate responsible authorities by January 2026 and update prevention programmes by October 2027.
The commercial incentive is substantial because the EU generates more than 59 million tonnes of food waste annually, valued at about €132 billion, while worldwide food waste reached 1.05 billion tonnes in 2022, equal to 132 kg per capita and nearly one-fifth of food available to consumers. For processors, this raises the avoided-cost value of peels, pomace, whey, spent grain and off-spec output, supporting multi-year contracts with upcyclers rather than low-value disposal, composting or anaerobic digestion.
Drivers Impact Analysis
| Driver | (~) % Impact on CAGR | Geographic Relevance | Impact Timeline |
|---|---|---|---|
| Food-waste mandates and landfill avoidance | +1.6 pp | EU core, UK, North America, APAC cities | Medium term (2–4 years) |
| Low-cost co-product feedstock monetization | +1.4 pp | North America, EU, India, China, Brazil | Short term (≤2 years) |
| Drying, extraction and fermentation scale-up | +1.2 pp | North America, EU, Japan, South Korea, China | Medium term (2–4 years) |
| Functional nutrition and clean-label reformulation | +1.1 pp | North America, EU, urban APAC | Short term (≤2 years) |
| ESG procurement and auditable supply chains | +0.9 pp | North America, EU, Australia, Japan | Medium term (2–4 years) |
| Retail and foodservice surplus conversion | +0.8 pp | U.S., Canada, EU, GCC, major APAC metros | Short term (≤2 years) |
Restraint Analysis
Variable Feedstock Quality
The core unit-economics restraint is that upcycled feedstock is intrinsically inconsistent: moisture, microbial load, sugar concentration, particle size, pesticide residues, allergens and sensory properties can vary by crop season, production line, supplier and collection time, making a stable specification harder to achieve than for virgin ingredients. A 2026 underwriting model should assume that 5–15% of received material can be lost through sorting, moisture adjustment, failed quality checks or low-yield extraction when supplier controls are immature; this directly raises effective cost per usable kilogram and reduces plant utilization.
The problem is especially acute in decentralized fruit-and-vegetable, retail-surplus and foodservice streams, where poor cold-chain coverage, weak traceability and limited farm-level aggregation interrupt predictable volumes. Companies therefore face a strategic trade-off between buying low-cost but volatile residuals and paying for dedicated supply contracts, pre-processing hubs and source-level segregation, delaying margin expansion until throughput becomes sufficiently dense.
Restraint Impact Analysis
| Restraint | (~) % Impact on CAGR | Geographic Relevance | Impact Timeline |
|---|---|---|---|
| Variable feedstock quality | -1.5 pp | India, China, Brazil, EU, U.S. | Short term (≤2 years) |
| Safety and traceability burden | -1.3 pp | North America, EU, Japan, Australia | Medium term (2–4 years) |
| High stabilization CapEx | -1.1 pp | APAC, Latin America, Africa, EU | Medium term (2–4 years) |
| Consumer quality skepticism | -1.0 pp | North America, EU, urban APAC | Short term (≤2 years) |
| Fragmented rules and claims | -0.8 pp | EU, U.S., UK, APAC export markets | Medium term (2–4 years) |
| Retail price and scale pressure | -0.7 pp | North America, EU, GCC, APAC metros | Short term (≤2 years) |
Opportunity Analysis
B2B Functional Ingredient Platforms
The largest white space is the transition from niche consumer-facing upcycled products into B2B ingredient platforms that sell standardized fiber, protein, starch, natural color, flavor, pectin and texturizing systems to mainstream food manufacturers; this is an opportunity rather than a present baseline driver because most value chains still monetize co-products through single-product brands or low-value feed and waste routes. Global food waste reached 1.05 billion tonnes in 2022, while an additional 13% of food is lost after harvest and before retail, indicating a large but under-industrialized reservoir of processable material; only a fraction is presently converted into specification-grade human-food ingredients.
A 2026–2030 execution case can target gross margins of 30–45% for application-specific dry ingredients, versus roughly 15–25% for simple bulk powders, provided processors secure 3–5 year source agreements, reach 65–75% asset utilization and develop formulations that reduce a customer’s cost or improve nutrition at inclusion levels of 2–10%. The strategic upside derives from recurring formulation wins, multi-SKU penetration and lower customer-acquisition cost per tonne than direct-to-consumer brands, but success requires technical-sales capability, regulatory dossiers and repeatable specifications rather than sustainability branding alone.
Opportunity Impact Analysis
| Opportunity | (~) % Potential CAGR | Geographic Relevance | Execution Window |
|---|---|---|---|
| B2B functional ingredient platforms | +1.8 pp | North America, EU, Japan, South Korea | Medium term (2–4 years) |
| Bioactive nutraceutical extraction | +1.5 pp | EU, North America, China, India | Medium term (2–4 years) |
| Digital feedstock exchange platforms | +1.3 pp | U.S., EU, India, Southeast Asia | Short term (≤2 years) |
| Co-located modular biorefineries | +1.2 pp | Brazil, India, China, EU, U.S. | Medium term (2–4 years) |
| Emerging-market post-harvest hubs | +1.1 pp | India, ASEAN, Africa, Latin America | Long term (≥4 years) |
| M&A-led regional ingredient roll-ups | +0.9 pp | North America, EU, Australia, Japan | Medium term (2–4 years) |
Challenges Analysis
Wet-Feedstock Process Control
Food upcycling must continuously manage biological variability rather than simply procure a standardized raw material: fruit pomace, spent grain, dairy permeate, vegetable trimmings and mixed surplus streams can differ materially in moisture, pH, microbial load, particle size, sugar content and composition between suppliers, seasons and production shifts. High moisture content and variable composition are repeatedly identified as core technical challenges in food-waste valorization because they affect storage stability, energy demand, extraction efficiency and final-product consistency.
A practical 2026 operating model should expect 3–8 percentage points of yield variation between incoming lots, 5–15% material loss from sorting or quality downgrades in immature supply networks, and higher cleaning, drying and testing costs when multiple residue types share a line. This is a challenge not a direct restraint because sales can continue, but operators must mitigate it through supplier scorecards, rapid testing, digital batch records, ingredient blending rules and flexible process parameters to prevent margin volatility and customer-specification failures.
Challenges Impact Analysis
| Challenge | (~) % CAGR Friction | Geographic Relevance | Mitigation Horizon |
|---|---|---|---|
| Wet-feedstock process control | -1.2 pp | India, Brazil, EU, U.S., China | Medium term (2–4 years) |
| Cold-chain logistics coordination | -1.0 pp | APAC, Latin America, Africa, U.S. | Medium term (2–4 years) |
| Traceability data interoperability | -0.9 pp | North America, EU, Japan, Australia | Medium term (2–4 years) |
| Specialist workforce scarcity | -0.8 pp | North America, EU, Japan, urban APAC | Long term (≥4 years) |
| Yield scale-up reproducibility | -0.8 pp | North America, EU, China, South Korea | Medium term (2–4 years) |
| Climate-driven supply volatility | -0.7 pp | India, ASEAN, Brazil, Africa, EU | Long term (≥4 years) |
Geopolitical Impact Analysis
Trade Policy Reversals and Compliance Fragmentation Reshaping Food Upcycling Supply Chains.
Geopolitical tensions are reshaping the food upcycling market by altering the availability and price of agricultural side streams. In March 2025, China imposed 100% tariffs on Canadian canola oil, canola meal, and peas, alongside 25% tariffs on selected pork, fish, and seafood products. These measures affected materials that can be converted into proteins, fibres, oils, and food ingredients, increasing sourcing uncertainty for processors dependent on cross-border feedstock flows.
Policy reversals can change market conditions just as quickly. In March 2026, China suspended tariffs on Canadian canola meal and peas until the end of 2026 and reduced the applied tariff on canola seed to 14.9% from nearly 85%. This shift improved access to approximately CAD 4 billion in annual Canadian canola exports, showing how diplomatic agreements can rapidly redirect ingredient supply and investment planning.
Regulatory fragmentation is also increasing traceability requirements. The European Union Deforestation Regulation covers cattle, cocoa, coffee, palm oil, rubber, soy, wood, and selected derived products. Large and medium operators must comply from December 30, 2026, requiring businesses using coffee pulp, cocoa shells, soy residues, or cattle-derived side streams to prove compliant sourcing.
Packaging rules add another layer of adjustment. The European Commission states that the Packaging and Packaging Waste Regulation begins applying from mid-2026 and requires all packaging to be recyclable by 2030. Upcycling companies are therefore strengthening local sourcing, documentation, formulation control, and recyclable packaging strategies, although changing tariffs and regional compliance systems continue to raise commercialization costs.
Regional Analysis
North America leads the Food Upcycling Market with 55.7% share, supported by strong sustainability initiatives and advanced food recovery infrastructure
In 2025, North America held a dominant position in the global food upcycling market, accounting for 55.7% of the total market and generating approximately USD 29.08 billion in revenue. The region’s leadership is supported by a well-established ecosystem of food recovery organizations, sustainability-focused food manufacturers, and growing consumer awareness regarding food waste reduction.
Europe maintained a significant position in the market, supported by stringent food waste reduction policies and sustainability targets. Food manufacturers across the region are increasingly incorporating recovered ingredients into value-added food products. Meanwhile, Asia Pacific is emerging as a promising market due to rising urbanization, expanding food processing activities, and growing awareness of sustainable consumption.
Key Regions and Countries Covered
- North America
- The US
- Canada
- Europe
- Germany
- France
- The UK
- Spain
- Italy
- Russia & CIS
- Rest of Europe
- APAC
- China
- Japan
- South Korea
- India
- ASEAN
- Rest of APAC
- Latin America
- Brazil
- Mexico
- Rest of Latin America
- Middle East & Africa
- GCC
- South Africa
- Rest of MEA
Key Players Analysis
The food upcycling market is characterized by growing competition among companies focused on converting surplus food materials into value-added products. Key players such as Upcycled Foods, Inc., Barnana, RIND Snacks, Renewal Mill, Matriark Foods, and The Spare Food Co. are strengthening their presence through product innovation, sustainable sourcing, and brand differentiation.
Companies increasingly develop snacks, bakery products, beverages, and food ingredients from recovered fruits, vegetables, grains, and processing by-products. Expanding product portfolios and improving ingredient-recovery capabilities remain important competitive strategies across the industry.
Other participants, including Toast Ale Ltd., Rubies in the Rubble Ltd., CRUST Group Pte. Ltd., Misfits Market, Imperfect Foods, and The Spent Goods Co., focus on partnerships with food manufacturers, retailers, farms, and food-recovery organizations to secure a steady supply of raw materials.
Strategic collaborations, retail expansion, and investment in circular production models help improve market reach and operating efficiency. As awareness of food-waste reduction continues to grow, companies are emphasizing supply-chain coordination, product quality, traceability, and consumer education to strengthen their competitive position and support long-term business growth.
Market Key Players
- Upcycled Foods, Inc.
- Barnana
- RIND Snacks
- Planetarians
- Toast Ale Ltd.
- The Ugly Company
- Trashy Chips
- Renewal Mill
- Rubies in the Rubble Ltd.
- CRUST Group Pte. Ltd.
- Matriark Foods
- DIANA’S BANANAS LLC.
- Oisix Ra Daichi Inc.
- Superfrau
- The Spare Food Co.
- The Spent Goods Co.
- Treasure8 (Nutri8)
- Wtrmln Wtr
- Imperfect Foods
- Misfits Market
- Others
Key Development
- In May 2026, Misfits Market reported that it had acquired zero-waste delivery company The Rounds and expanded its Odds & Ends private-label portfolio to 130 products during 2025.
- In December 2025, Toast Ale Ltd. partnered with Northern Monk to launch a limited-edition lager made using 19,000 slices of surplus bakery bread, with distribution across more than 500 Co-op stores.
- In November 2025, RIND Snacks launched Raspberry Almond Granola Squares, marking its expansion into the granola category, with the product introduced exclusively through Sam’s Club.
Report Scope
| Report Features | Description |
|---|---|
| Market Value (2025) | USD 52.2 Bn |
| Forecast Revenue (2035) | USD 97.7 Bn |
| CAGR (2026-2035) | 6.5% |
| Base Year for Estimation | 2025 |
| Historic Period | 2020-2024 |
| Forecast Period | 2026-2035 |
| Report Coverage | Revenue Forecast, Market Dynamics, Competitive Landscape, Recent Developments |
| Segments Covered | By Source (Fruit & Vegetable Waste, Agricultural By-products, Food Processing Waste, and Grains & Others), By Type (Snacks & Bakery Products, Food Ingredients, Beverages, Animal Feed & Pet Food, and Others), By Distribution Channel (Supermarkets & Hypermarkets, Online Sales Channels, Food Service, and Specialty Stores & Others), By End Use (Food & Beverage Manufacturers, Retail, Food Service, and Others) |
| Regional Analysis | North America – The US & Canada; Europe – Germany, France, The UK, Spain, Italy, Russia & CIS, Rest of Europe; APAC– China, Japan, South Korea, India, ASEAN & Rest of APAC; Latin America– Brazil, Mexico & Rest of Latin America; Middle East & Africa– GCC, South Africa, & Rest of MEA |
| Competitive Landscape | Upcycled Foods, Inc., Barnana, RIND Snacks, Planetarians, Toast Ale Ltd., The Ugly Company, Trashy Chips, Renewal Mill, Rubies in the Rubble Ltd., CRUST Group Pte. Ltd., Matriark Foods, DIANA’S BANANAS LLC., Oisix Ra Daichi Inc., Superfrau, The Spare Food Co., The Spent Goods Co., Treasure8 (Nutri8), Wtrmln Wtr, Imperfect Foods, Misfits Market, and Others. |
| Customization Scope | Customization for segments, region/country-level will be provided. Moreover, additional customization can be done based on the requirements. |
| Purchase Options | We have three licenses to opt for: Single User License, Multi-User License (Up to 5 Users), Corporate Use License (Unlimited Users and Printable PDF) |





































