
Quick Navigation
Report Overview
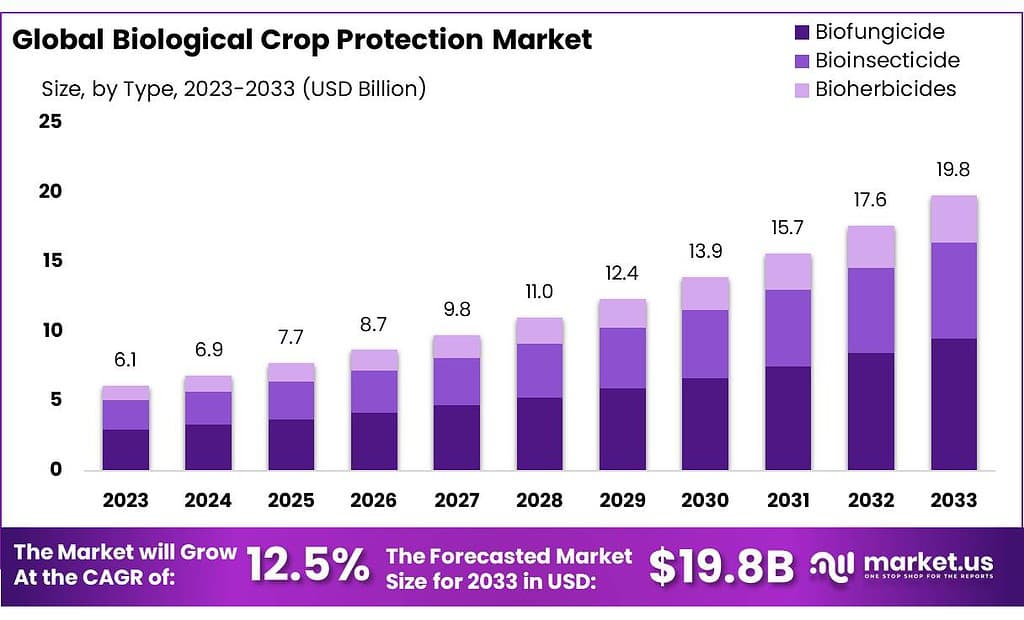
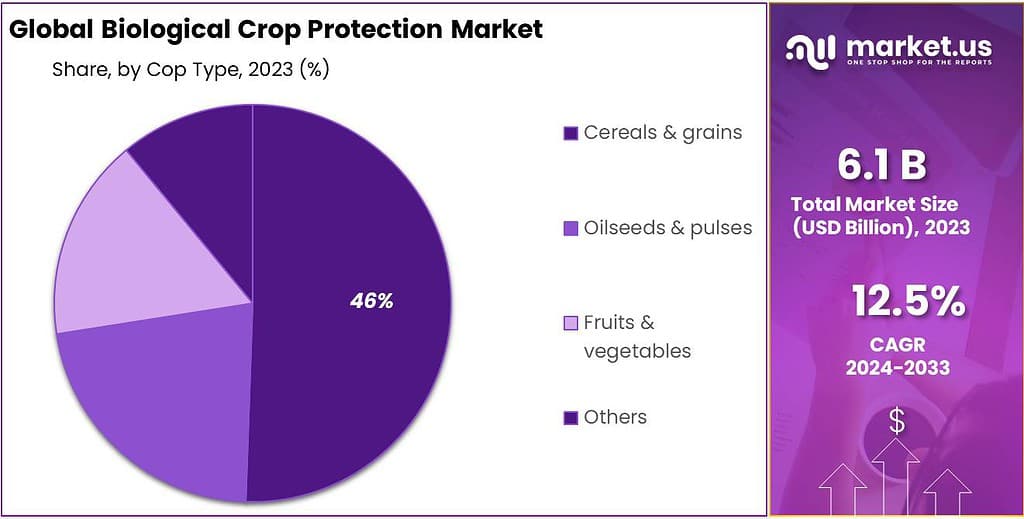
The global Biological Crop Protection Market size is expected to be worth around USD 19.8 billion by 2033, from USD 6.1 billion in 2023, growing at a CAGR of 12.5% during the forecast period from 2023 to 2033.
The Biological Crop Protection Market refers to a sector within the agriculture industry focused on the development, production, and sale of biological control agents for the management of pests and diseases in crops. This market emphasizes the use of naturally occurring substances, microorganisms, or other biological entities as alternatives to synthetic chemical pesticides. The aim is to offer sustainable, environmentally friendly solutions for crop protection that minimize harm to non-target organisms, including humans, and reduce the risk of developing pesticide resistance.
Biological crop protection products, also known as biopesticides or biologicals, include a wide range of materials such as bacteria, fungi, viruses, plant extracts, and natural predators of pests. These products work through various mechanisms, including competition, parasitism, and predation, to suppress harmful pest populations effectively. The growth of the market can be attributed to several factors, including increasing regulatory restrictions on synthetic pesticides, growing consumer demand for organic and sustainably produced food, and the rising awareness of the environmental impact of conventional agricultural practices.
Market offerings in this sector typically encompass microbial pesticides, bio-derived chemicals, plant-incorporated protectants, and beneficial insects. The adoption of biological crop protection methods is seen as a key component of integrated pest management (IPM) strategies, aiming to reduce the reliance on chemical pesticides while maintaining agricultural productivity and profitability.
The Biological Crop Protection Market is dynamic, with continuous research and development efforts leading to the discovery and commercialization of new biological products. This market is critical for the future of sustainable agriculture, providing effective tools to combat pests and diseases while supporting the health of ecosystems and promoting biodiversity.
Key Takeaways
- Market Growth: The Biological Crop Protection Market is projected to reach USD 19.8 billion by 2033, with a CAGR of 12.5%.
- Product Diversity: Biofungicides lead, capturing over 48.6% market share, driven by rising fungal diseases.
- Formulation Preference: Dry formulations dominate, with a 69.6% share in 2023, favored for storage convenience.
- Application Methods: Foliar spray holds a 46.3% market share, known for immediate action against pests.
- Crop Segments: Cereals & grains lead, with over 46.4% market share in 2023, reflecting high demand.
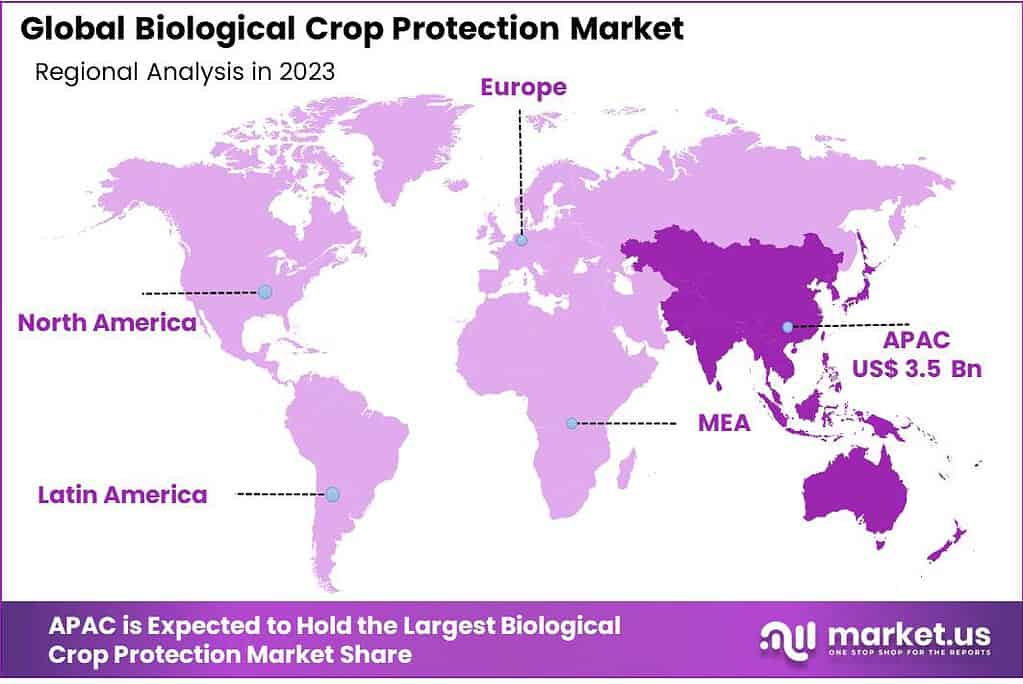
- Regional Analysis: Asia Pacific is set to lead with a 57% share, driven by growing demand for sustainable solutions
By Type
In 2023, Biofungicide held a dominant market position, capturing more than a 48.6% share. This segment’s lead is attributed to the rising prevalence of fungal diseases in crops and the growing resistance to traditional chemical fungicides.
Biofungicides, derived from natural organisms like bacteria and fungi, offer a safer, more sustainable method to combat these diseases. Their popularity has surged among organic farmers and those transitioning to more sustainable practices, driven by the demand for eco-friendly and residue-free produce.
Following closely, Bioinsecticides accounted for a significant portion of the market. These products, utilizing natural predators, parasites, or microorganisms to target and control pest populations, have gained traction due to their specificity and minimal impact on non-target species, including pollinators.
The increasing incidence of pest infestations and the shift towards integrated pest management (IPM) strategies have further fueled their adoption. Manufacturers and researchers continue to explore novel bioinsecticides, expanding their applicability across diverse agricultural settings.
Bioherbicides, although a smaller segment, are witnessing a gradual increase in interest. This growth can be linked to the rising concern over herbicide resistance and the environmental repercussions of synthetic herbicides. Bioherbicides, often consisting of microbial agents or plant-derived substances, offer an innovative approach to weed management.
They present minimal risk to crops, soil health, and biodiversity. As awareness and regulatory support for sustainable agricultural inputs grow, the bioherbicide segment is expected to gain momentum, carving out a niche in the biological crop protection market.
By Form
In 2023, Dry form held a dominant market position, capturing more than a 69.6% share. The preference for dry formulations can be attributed to their ease of storage, longer shelf life, and convenience in transport.
These factors make dry biopesticides highly favorable among farmers and distributors alike. Additionally, the ability to blend dry formulations with other soil amendments or apply them directly to the soil has further enhanced their utility in diverse agricultural practices. The segment benefits from continuous innovation aimed at improving the efficacy and application efficiency of dry biopesticides.
On the other hand, Liquid form biopesticides also play a crucial role in the biological crop protection market. Although they hold a smaller market share compared to dry forms, their significance is growing. Liquid biopesticides are valued for their ease of application, particularly in foliar sprays and irrigation systems, allowing for precise targeting of pests and diseases.
The development of liquid formulations that are compatible with existing farm equipment is driving their adoption. As technology advances, these products are becoming more effective and stable, encouraging their use in integrated pest management strategies. The trend towards sustainable and organic farming practices is expected to boost the demand for liquid biopesticides, highlighting their potential for growth in the coming years.
By Mode of Application
In 2023, Foliar Spray held a dominant market position, capturing more than a 46.3% share. This method’s popularity stems from its direct application to plant leaves, allowing for immediate action against pests and diseases. Foliar sprays are highly effective for quick intervention and are preferred for their versatility in delivering nutrients and biopesticides alike. Their widespread use is supported by the ease of integration into existing farm management practices, making them a go-to solution for farmers seeking efficient and immediate crop protection measures.
Seed Treatment emerged as another significant segment, emphasizing the preventive approach in crop protection. By treating seeds before planting, farmers can protect young plants from pests and diseases from the very start, enhancing crop health and yield potential. This method has gained traction for its cost-effectiveness and the minimal environmental impact it offers, aligning well with sustainable agriculture practices.
Soil Treatment also holds a crucial place in the market, focusing on creating a healthy foundation for plant growth. By addressing pests and pathogens residing in the soil, this method contributes to the long-term health of crops and reduces the need for repeated applications of biopesticides. Soil treatments are particularly valuable in organic farming, where maintaining soil health is paramount.
By Cop Type
In 2023, Cereals & Grains held a dominant market position, capturing more than a 46.4% share. This segment’s prominence is due to the global reliance on cereals and grains as staple food sources. The high demand for these crops drives the need for effective and sustainable protection measures, making biological crop protection solutions particularly appealing. Farmers favor these eco-friendly alternatives to safeguard yields and meet the quality expectations of increasingly health-conscious consumers. The trend towards sustainable agriculture further bolsters the adoption of biologicals in cereals and grains.
Oilseeds & Pulses followed as a significant segment in the market. These crops, essential for their nutritional value and role in crop rotation practices, benefit greatly from biological crop protection. Biopesticides help manage pests and diseases while preserving the beneficial organisms that support soil health and fertility. The growing market for organic and non-GMO oilseeds and pulses amplifies the demand for biological protection methods, aligning with consumer preferences for sustainably produced food.
Fruits & Vegetables accounted for a substantial share, driven by their high susceptibility to pests and diseases and the direct impact of these challenges on crop quality and marketability. Biological crop protection offers solutions that are safe for use on crops that are often consumed fresh, addressing consumer concerns about pesticide residues. The segment’s growth is fueled by the expanding global demand for fresh produce and the strict regulations governing pesticide use in many countries.
Key Market Segments
By Type
- Biofungicide
- Bioinsecticide
- Bioherbicides
By Form
- Dry
- Liquid
By Mode of Application
- Foliar Spray
- Seed Treatment
- Soil Treatment
- Others
By Cop Type
- Cereals & grains
- Oilseeds & pulses
- Fruits & vegetables
- Others
Drivers
Increasing Regulatory Restrictions on Synthetic Pesticides
One of the most significant drivers propelling the growth of the Biological Crop Protection Market is the increasing regulatory restrictions on synthetic pesticides. Governments and regulatory bodies worldwide are implementing stricter regulations on the use of chemical pesticides due to growing concerns over their environmental impact, the health risks they pose to humans and wildlife, and the problem of pests developing resistance. These concerns have led to bans and restrictions on several widely used chemical pesticides, pushing the agricultural sector to seek safer, more sustainable alternatives.
As awareness of the negative effects of synthetic pesticides grows among consumers, there is a noticeable shift in preference towards organically produced food. This consumer demand is not only driving the expansion of the organic farming sector but also influencing conventional farmers to adopt more sustainable practices, including the use of biological crop protection products. Biologicals offer an appealing solution, as they are derived from natural sources, such as plants, bacteria, fungi, and viruses, and are generally considered safe for the environment, non-target organisms, and human health.
Furthermore, the integration of biological products into integrated pest management (IPM) programs is becoming increasingly common. IPM strategies that combine biological, cultural, physical, and sometimes chemical methods to manage pests in a more sustainable and environmentally friendly manner are being widely adopted. Biological crop protection products play a crucial role in these programs, offering effective pest and disease control without the drawbacks associated with chemical pesticides.
Additionally, the innovation and technological advancements in the field of biotechnology are leading to the development of more effective and reliable biological crop protection products. These advancements are not only improving the efficacy of biological products but also expanding their range of application, making them more competitive with synthetic pesticides.
Restraints
Limited Shelf Life and Variable Efficacy of Biological Products
A major restraint facing the Biological Crop Protection Market is the limited shelf life and variable efficacy of biological products compared to their synthetic counterparts. Biological crop protection agents, being derived from living organisms such as bacteria, fungi, viruses, and natural enemies of pests, are inherently less stable than synthetic chemicals. This biological nature subjects them to degradation over time and under varying environmental conditions, such as temperature fluctuations and humidity levels, which can significantly reduce their effectiveness and shelf life. This aspect poses logistical challenges for manufacturers, distributors, and farmers, who must ensure that these products are stored and used within a relatively narrow timeframe to maintain their efficacy.
The variable efficacy of biological products further complicates their adoption. The performance of biopesticides can be highly dependent on specific environmental conditions, including the timing of application, the pest or pathogen targeted, and the crop being treated. Unlike synthetic pesticides, which often have a broad and consistent effect across a wide range of conditions, biologicals may require more precise application strategies and may not always provide the same level of control. This inconsistency can deter farmers accustomed to the reliability of chemical solutions, especially when dealing with severe pest infestations or diseases.
Moreover, the initial cost and the need for more frequent applications of biological products can be higher compared to synthetic pesticides. While long-term benefits such as improved soil health and reduced pest resistance can offset these costs, the immediate financial outlay and the perceived risk of lower efficacy can be significant barriers to widespread adoption.
The education and training required for the effective use of biological crop protection products also represent a challenge. Farmers and agricultural professionals need to understand the specific modes of action, application timing, and environmental factors that influence the performance of biologicals. This knowledge gap can lead to misapplication or misuse, undermining the potential benefits of these products.
Opportunity
Expansion into Emerging Markets and Organic Farming
A major opportunity for the Biological Crop Protection Market lies in its expansion into emerging markets and the rapidly growing organic farming sector. As global awareness of environmental sustainability and health consciousness rises, there is a significant shift in consumer preferences towards organically produced foods and sustainable agricultural practices.
This shift is not confined to established markets in North America and Europe but is increasingly evident in emerging economies across Asia, Africa, and Latin America. These regions, characterized by their vast agricultural sectors and growing populations, present untapped potential for the adoption of biological crop protection products.
Emerging markets are witnessing a surge in demand for agricultural products due to increasing population and rising income levels. This demand creates a pressing need for sustainable intensification of agriculture that not only boosts productivity but also preserves environmental health and biodiversity.
Biological crop protection products, with their environmentally friendly profiles and ability to integrate into diverse farming systems, are perfectly aligned with these goals. Their adoption supports the transition to more sustainable agricultural practices, helping to reduce the reliance on synthetic pesticides that have long-term detrimental effects on ecosystems and human health.
Furthermore, the global organic food market is experiencing unprecedented growth, driven by consumers who are willing to pay a premium for products that are perceived as healthier, safer, and more environmentally friendly. This trend provides a significant opportunity for the biological crop protection market, as biopesticides and other biological control agents are integral to organic farming practices. Regulatory support for organic agriculture, including subsidies and certification programs, further amplifies this opportunity.
The expansion into these new markets is facilitated by advancements in biotechnology and the development of innovative products that are more effective, stable, and easier to use. Partnerships between biological product manufacturers and local agricultural sectors can accelerate the adoption of biological solutions, providing farmers with the tools and knowledge to tackle pest and disease challenges sustainably.
Additionally, the increasing focus on food security and the need for resilient agricultural systems in the face of climate change highlight the importance of sustainable crop protection solutions. Biological products offer the adaptability and environmental compatibility necessary to meet these challenges, making their adoption a strategic imperative for future agricultural development.
Trends
Technological Innovations and Biotechnological Advances
A significant trend shaping the Biological Crop Protection Market is the rapid pace of technological innovations and biotechnological advances. This trend is revolutionizing the way biological crop protection products are developed, produced, and applied, enhancing their efficacy, stability, and range of action. Innovations in genetic engineering, microbial technology, and nanotechnology are at the forefront of creating next-generation biopesticides that are more effective against a broader spectrum of pests and diseases while being safer for the environment and non-target organisms.
Genetic engineering is enabling the development of microbial strains with enhanced pesticidal properties. By manipulating the genetic material of bacteria, fungi, and viruses, scientists are able to produce biocontrol agents that are highly specific to target pests or pathogens, reducing the risk of harming beneficial species. This precision not only improves the sustainability of crop protection practices but also addresses the issue of resistance development in pests and diseases.
Microbial technology is another area witnessing significant advancements. The isolation and characterization of novel microorganisms from diverse environments are leading to the discovery of unique bioactive compounds with pesticidal properties. These natural products offer a rich source of innovation for the development of biopesticides that are effective under a wide range of conditions. Furthermore, advancements in fermentation technology and formulation processes are improving the viability and shelf-life of microbial-based products, making them more attractive to farmers.
Nanotechnology is also playing a crucial role in transforming the biological crop protection landscape. Nanoformulations enhance the delivery and persistence of biopesticides, improving their absorption by plants and pests. This technology enables the controlled release of active ingredients, maximizing their efficacy while minimizing environmental impact. Nanocarriers can protect bioactive compounds from degradation, extend their action time, and reduce the frequency of applications needed, thereby lowering costs and labor inputs for farmers.
These technological and biotechnological innovations are not only expanding the capabilities of biological crop protection products but are also making them more competitive with synthetic chemicals. They are paving the way for the development of integrated pest management strategies that are more efficient, sustainable, and aligned with the global push towards minimizing the agricultural sector’s environmental footprint.
Regional Analysis
The Asia Pacific region is anticipated to emerge as a leader in the Biological Crop Protection Market, securing a dominant share of 57%. This growth is fueled by the escalating demand for sustainable and environmentally friendly crop protection solutions in vital sectors such as agriculture, horticulture, and organic farming. Significant investments in agricultural research and development, particularly in countries like China, India, and various Southeast Asian nations, are poised to drive market expansion. This surge is supported by the region’s robust agricultural activities and a strong commitment to sustainable farming practices.
In North America, economic growth and the burgeoning demand from sectors that prioritize nutritious and sustainably produced agricultural products, including the organic farming and agro-tourism industries, are expected to catalyze the market for biological crop protection. The region’s dedication to health-conscious lifestyles and environmental sustainability is set to amplify this trend, establishing North America as a key player in the global market for biological crop protection solutions.
Europe, likewise, is set to witness notable growth in the Biological Crop Protection Market. This momentum is driven by an increasing consumer shift towards fresh, organic, and locally sourced agricultural products, along with growing demand from the organic farming, food retail, and agro-tourism sectors. Europe’s focus on health-conscious living, sustainable agriculture, and environmental conservation highlights the expanding integration of biological crop protection methods in the region, marking it as an important market for these eco-friendly solutions.
Key Regions and Countries
- North America
- US
- Canada
- Mexico
- Europe
- Germany
- UK
- France
- Italy
- Russia
- Spain
- Rest of Europe
- APAC
- China
- Japan
- South Korea
- India
- Rest of Asia-Pacific
- South America
- Brazil
- Argentina
- Rest of South America
- MEA
- GCC
- South Africa
- Israel
- Rest of MEA
Market Share Analysis of the Biological Crop Protection Market reveals a competitive and dynamically evolving landscape. This sector is characterized by its focus on sustainable agriculture, driven by increasing environmental concerns and consumer demand for organic products. The analysis highlights several key aspects
Key Market Players
- ADAMA Ltd.
- Andermatt Biocontrol
- BASF
- Bayer AG
- Bionema
- Certis USA LLC
- Chengdu New Sun
- Coromandel
- Corteva Agriscience
- Dow
- DuPont Inc.
- FMC Corporation
- Isagro
- Jiangsu Luye
- Jiangxi Xinlong Biological
- Koppert
- Marrone Bio Innovations Inc.
- Novozymes
- SEIPASA
- Som Phytopharma India
- Syngenta AG
- Valent BioSciences
Recent Developments
In 2023, BASF SE demonstrated significant advancements in the Biological Crop Protection sector, marking its position as a leader in the development and application of sustainable agricultural solutions.
In 2023, Bayer AG made significant strides in the Biological Crop Protection sector through strategic partnerships and investments aimed at expanding its portfolio of sustainable agricultural solutions.
Report Scope
| Report Features | Description |
|---|---|
| Market Value (2023) | USD 6.1 Bn |
| Forecast Revenue (2033) | USD 19.8 Bn |
| CAGR (2024-2033) | 12.5% |
| Base Year for Estimation | 2023 |
| Historic Period | 2020-2023 |
| Forecast Period | 2024-2033 |
| Report Coverage | Revenue Forecast, Market Dynamics, COVID-19 Impact, Competitive Landscape, Recent Developments |
| Segments Covered | By Type(Biofungicide, Bioinsecticide, Bioherbicides), By Form(Dry, Liquid), By Mode of Application(Foliar Spray, Seed Treatment, Soil Treatment, Others), By Cop Type(Cereals & grains, Oilseeds & pulses, Fruits & vegetables, Others) |
| Regional Analysis | North America – The US & Canada; Europe – Germany, France, The UK, Spain, Italy, Russia & CIS, Rest of Europe; APAC– China, Japan, South Korea, India, ASEAN & Rest of APAC; Latin America– Brazil, Mexico & Rest of Latin America; Middle East & Africa– GCC, South Africa, & Rest of MEA |
| Competitive Landscape | ADAMA Ltd., Andermatt Biocontrol, BASF, Bayer AG, Bionema, Certis USA LLC, Chengdu New Sun, Coromandel, Corteva Agriscience, Dow, DuPont Inc., FMC Corporation, Isagro, Jiangsu Luye, Jiangxi Xinlong Biological, Koppert, Marrone Bio Innovations Inc., Novozymes, SEIPASA, Som Phytopharma India, Syngenta AG, Valent BioSciences |
| Customization Scope | Customization for segments, region/country-level will be provided. Moreover, additional customization can be done based on the requirements. |
| Purchase Options | We have three licenses to opt for: Single User License, Multi-User License (Up to 5 Users), Corporate Use License (Unlimited User and Printable PDF) |
Frequently Asked Questions (FAQ)
Biological Crop Protection Market size is expected to be worth around USD 19.8 billion by 2033, from USD 6.1 billion in 2023
ADAMA Ltd., Andermatt Biocontrol, BASF, Bayer AG, Bionema, Certis USA LLC, Chengdu New Sun, Coromandel, Corteva Agriscience, Dow, DuPont Inc., FMC Corporation, Isagro, Jiangsu Luye, Jiangxi Xinlong Biological, Koppert, Marrone Bio Innovations Inc., Novozymes, SEIPASA, Som Phytopharma India, Syngenta AG, Valent BioSciences


