One Stop Shop For Reports One Stop Shop For Reports
  • All Reports
  • All Sectors
    • Chemicals & Materials
      • Advanced Materials
      • Bulk Chemicals
      • Coatings | Paints and Additives
      • Composites
      • Renewable | Speciality chemicals
    • Consumer Goods
      • Baby Products
      • Consumer Electronics
      • Consumer Packaging
      • Cosmetics & Personal Care
      • Homecare & Decor
      • Luxury & premium products
    • Energy and Power
      • Energy Efficiency and Conservation
      • Green | Renewable Energy
      • Non Renewable | Conventional Energy
      • Power Equipment and Devices
    • Life Science
      • Biotechnology
      • Diagnostics
      • Healthcare
      • Healthcare IT
      • Medical Devices & Supplies
      • Pharmaceuticals
    • Food and Beverage
      • Agriculture & Agri Products
      • Beverages
      • Food Ingredients
      • Food Services and Hospitality
      • Nutraceutical | Wellness Food
      • Processed & Frozen Foods
    • Automotive and Transportation
      • Automotive components
      • Automotive Logistics
      • Automotive systems and accessories
    • Information and Communications Technology
      • E Commerce and Outsourcing
      • Entertainment & Media
      • High Tech | Enterprise & Consumer IT
      • Information & Network Security
      • Mobility | Telecom & Wireless
      • Software and Services
    • Semiconductor and Electronics
      • Semiconductor Materials and Components
      • Display Technology
      • Electronics System and Components
      • Emerging technologies
      • Security and Surveillance
      • Sensors and Controls
    • Building and Construction
      • Construction Materials
      • HVAC
      • Residential Construction and Improvement
      • Roads & Highways
    • Manufacturing
      • Manufacturing Services
      • Heavy Manufacturing
      • Packaging
      • Engineering | Equipment and Machinery
  • Who Trust Us
  • inquiry@market.us
  • +1 718 874 1545 (International)
  • +91 78878 22626 (Asia)

More Results

One Stop Shop For Reports One Stop Shop For Reports
  • All Reports
  • All Sectors
    • Chemicals & Materials
      • Advanced Materials
      • Bulk Chemicals
      • Coatings | Paints and Additives
      • Composites
      • Renewable | Speciality chemicals
    • Consumer Goods
      • Baby Products
      • Consumer Electronics
      • Consumer Packaging
      • Cosmetics & Personal Care
      • Homecare & Decor
      • Luxury & premium products
    • Energy and Power
      • Energy Efficiency and Conservation
      • Green | Renewable Energy
      • Non Renewable | Conventional Energy
      • Power Equipment and Devices
    • Life Science
      • Biotechnology
      • Diagnostics
      • Healthcare
      • Healthcare IT
      • Medical Devices & Supplies
      • Pharmaceuticals
    • Food and Beverage
      • Agriculture & Agri Products
      • Beverages
      • Food Ingredients
      • Food Services and Hospitality
      • Nutraceutical | Wellness Food
      • Processed & Frozen Foods
    • Automotive and Transportation
      • Automotive components
      • Automotive Logistics
      • Automotive systems and accessories
    • Information and Communications Technology
      • E Commerce and Outsourcing
      • Entertainment & Media
      • High Tech | Enterprise & Consumer IT
      • Information & Network Security
      • Mobility | Telecom & Wireless
      • Software and Services
    • Semiconductor and Electronics
      • Semiconductor Materials and Components
      • Display Technology
      • Electronics System and Components
      • Emerging technologies
      • Security and Surveillance
      • Sensors and Controls
    • Building and Construction
      • Construction Materials
      • HVAC
      • Residential Construction and Improvement
      • Roads & Highways
    • Manufacturing
      • Manufacturing Services
      • Heavy Manufacturing
      • Packaging
      • Engineering | Equipment and Machinery
  • Who Trust Us
Home ➤ Food and Beverage ➤ Fruits And Vegetables Market
Fruits And Vegetables Market
Published date: August 2026 • Formats:
sales@market.us +1 718 874 1545
Request Sample Schedule a Call
Table of Contents
  • Report Overview
  • Key Takeaways
  • By Product Type
  • By Category
  • By Produce
  • By Fruit
  • By Distribution Channel
  • By Processing Form
  • Key Market Segments
  • Driver Analysis
  • Restraint Analysis
  • Opportunity Analysis
  • Challenges Analysis
  • Geopolitical Impact Analysis
  • Regional Analysis
  • Key Players Analysis
  • Key Development
  • Report Scope
  • Home ➤ Food and Beverage ➤ Fruits And Vegetables Market

Fruits And Vegetables Market Size, Share And Analysis Report By Product Type (Fresh Fruits & Vegetables, Processed Fruits & Vegetables, Frozen Fruits & Vegetables, Dried / Dehydrated Fruits & Vegetables, Canned & Preserved Fruits & Vegetables), By Category (Conventional, Organic), By Produce (Vegetables (Leafy, Root, Cruciferous), Fruits (Tropical, Citrus, Berries, Pome)), By Fruit (Bananas, Apples & Pears, Citrus Fruits, Berries & Grapes, Mangoes & Guava, Pineapples, Watermelon & Melon, Others), By Distribution Channel (Supermarkets / Hypermarkets, Grocery / Convenience Stores, Online Retail / E-Commerce, Wet Markets / Traditional Retail, Foodservice / HORECA, Others), By Processing Form (Juices & Beverages, Jams, Preserves & Spreads, Frozen & IQF, Canned / Tinned, Dried & Dehydrated, Others (Pickled, Purée)), By Region and Companies Industry Segment Outlook, Market Assessment, Competition Scenario, Trends and Forecast 2026 2035

  • Published date: August 2026
  • Report ID: 118001
  • Number of Pages: 220
  • Format:
Fact Checked
Fruits And Vegetables Market https://market.us/report/fruits-and-vegetables-market/
Cite this Research
  • Overview
  • Table of Contents
  • Segmentation
  • currency-icon
    Revenue, 2025 (US$B)
    565.13 Bn
    growth-icon
    Forecast, 2035 (US$B)
    889.29 Bn
    chart-icon
    CAGR, 2025 - 2035
    4.64%
    globe-icon
    Leading Region
    Asia Pacific

    Quick Navigation

    • Report Overview
    • Key Takeaways
    • By Product Type
    • By Category
    • By Produce
    • By Fruit
    • By Distribution Channel
    • By Processing Form
    • Key Market Segments
    • Driver Analysis
    • Restraint Analysis
    • Opportunity Analysis
    • Challenges Analysis
    • Geopolitical Impact Analysis
    • Regional Analysis
    • Key Players Analysis
    • Key Development
    • Report Scope

    Report Overview

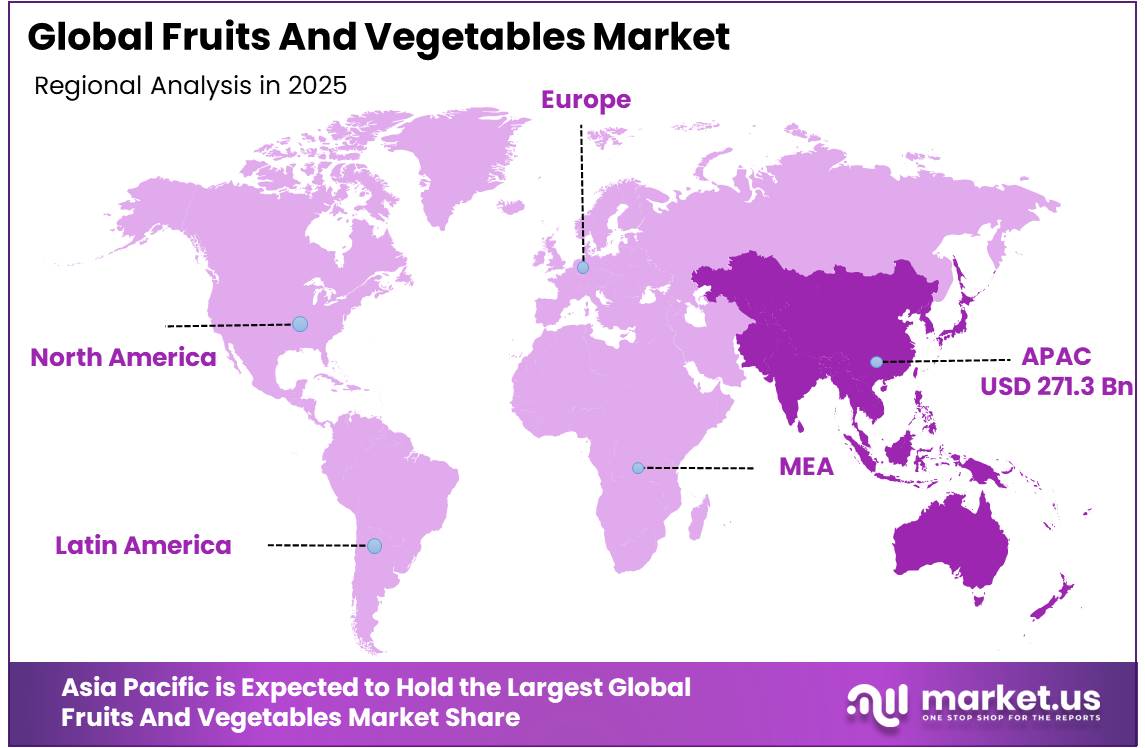
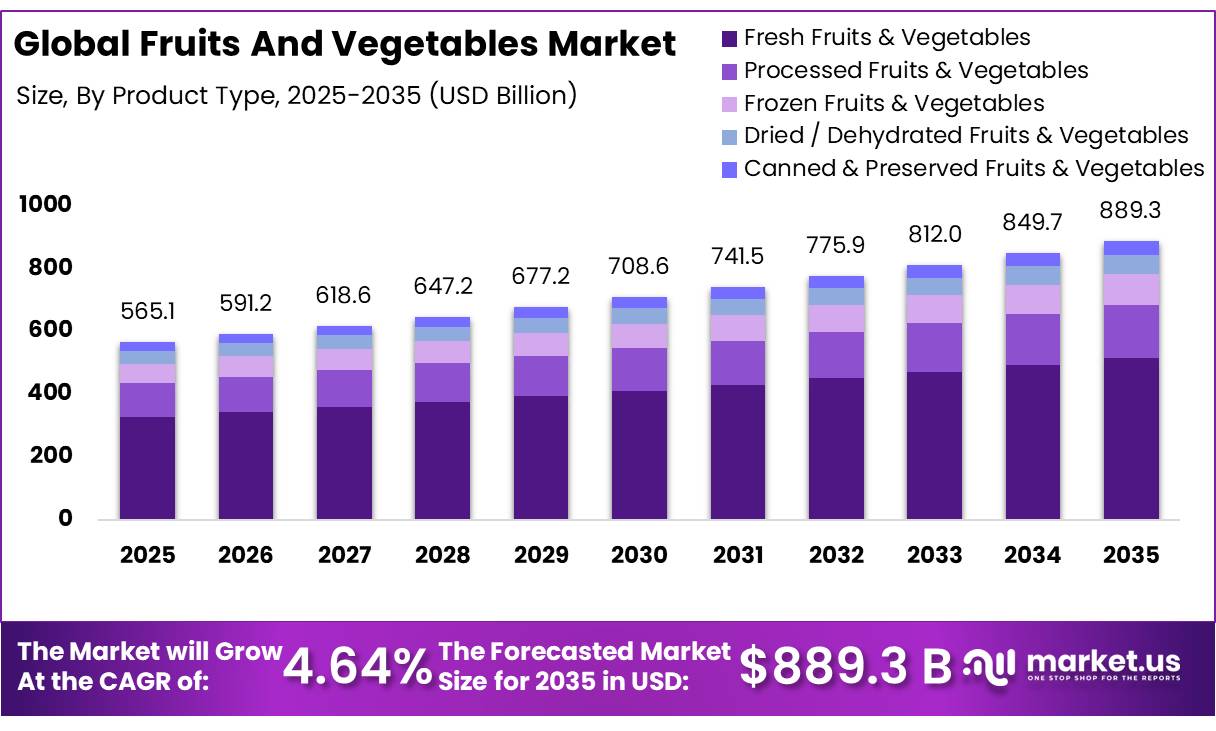
    In 2025, the Global Fruits And Vegetables Market was valued at USD 565.1 Billion, and between 2026 and 2035, this market is estimated to register a CAGR of 4.64%, reaching about USD 889.3 Billion by 2035. Asia Pacific held a dominant market position, capturing more than a 48.0% share, holding USD 271.3 Billion in revenue.

    The global fruit and vegetable industry represents one of the largest and most vital segments of the world’s agrifood system, supplying essential nutrients and dietary fiber that support food security and public health.

    • According to the Food and Agriculture Organization (FAO) of the United Nations, world fruit and vegetable production reached 2.1 billion tonnes in 2023, an increase of 1% from 2022, underscoring the sector’s expanding scale and its foundational role in global diets and trade networks.
    Key Takeaways

    • The Global Fruits & Vegetables Market was valued at US$565.1 billion in 2025.
    • The global fruits & vegetables market is projected to grow at a CAGR of 4.64% and is estimated to reach US$889.3 billion by 2035.
    • On the basis of product type, Fresh Fruits & Vegetables dominated the market, constituting 58.0% of the total market share.
    • Based on the category (nature), Conventional products dominated the market, with a substantial market share of around 87.5%.
    • Based on the produce sub-category, Vegetables (Leafy, Root, Cruciferous) dominated the market, accounting for 53.4% of the total market share.
    • Based on the fruit sub-type, Bananas dominated the market, accounting for 15.8% of the total market share.
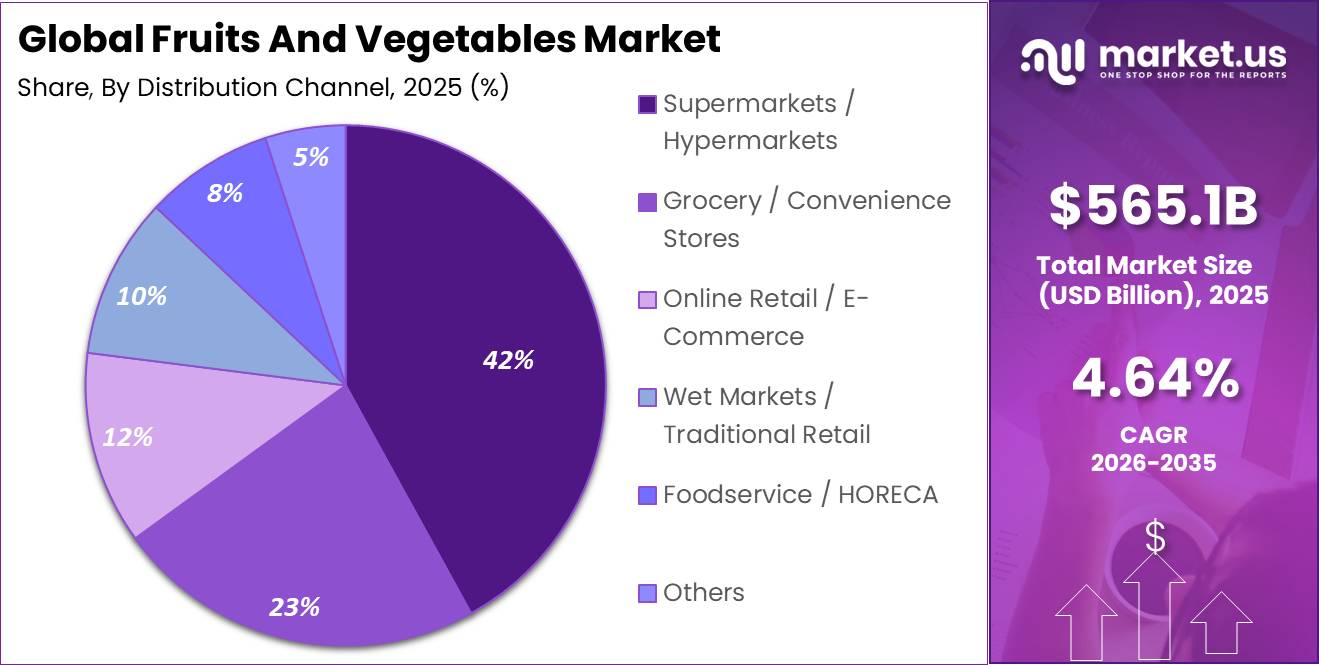
    • Based on the distribution channel, Supermarkets / Hypermarkets dominated the market, accounting for 42.0% of the total market share.
    • Based on the processing form (processed segment), Juices & Beverages dominated the market, accounting for 28.0% of the total market share.
    • In 2025, Asia Pacific was the most dominant region in the fruits & vegetables market, accounting for 48.0% of the global market.

    Vegetable output alone climbed to 1.2 billion tonnes in 2023, a rise of 26% since 2010, with tomatoes remaining the most cultivated vegetable at 192 million tonnes, followed by onions at 111 million tonnes and cucumbers at 98 million tonnes. Fruit production similarly expanded, reaching close to 1 billion tonnes in the same year, reflecting sustained cultivation growth, improved agricultural yields, and diversification across fruit and vegetable varieties worldwide.

    Rising health consciousness continues to drive consumption, supported by the World Health Organization (WHO) recommendation of consuming at least 400 grams of fruit and vegetables daily to reduce risks of noncommunicable diseases.

    • Per the United Kingdom government’s Food Security Report, production per capita of fruit and vegetables increased 105.8% between 1961 and 2022, highlighting long-term structural growth. Expanding urban populations, dietary diversification in developing economies, and rising demand for fresh and processed produce present significant growth opportunities across cultivation, cold chain logistics, and export-oriented supply chains.

    Government-backed nutrition programs continue to strengthen sector demand. The European Commission’s School Fruit, Vegetables and Milk Scheme allocates an EU budget of 220.8 million Euros per school year, comprising up to 130.6 million Euros for fruit and vegetables and 90.1 million Euros for milk, supporting healthier eating habits among schoolchildren across the European Union (EU) and reinforcing consumption patterns that sustain long-term industry expansion and stability.

    By Product Type

    Fresh Fruits & Vegetables dominates with 58.0% owing to strong everyday consumer demand and regular household consumption.

    In 2025, Fresh Fruits & Vegetables held a dominant market position, capturing more than a 58.0% share of the global fruits and vegetables market. The segment remained the preferred choice because consumers continued to purchase fresh produce for daily meals, home cooking, and nutritional needs. Regular consumption of fresh fruits and vegetables, supported by their easy availability through supermarkets, grocery stores, and local markets, helped maintain their leading position.

    Processed Fruits & Vegetables represented the growing segment in 2025, supported by changing lifestyles and increasing preference for convenient food options. Demand continued to rise as consumers looked for products that offered longer shelf life, easy storage, and quicker meal preparation without requiring fresh produce every day.

    By Category

    Conventional dominates with 87.5% due to its broad availability and well-established farming practices.

    In 2025, Conventional held a dominant market position, capturing more than 87.5% share of the global fruits and vegetables market by category (nature). The segment maintained its leading position because conventional farming remained the primary cultivation method across many agricultural regions, ensuring consistent production and supply throughout the year. Its widespread adoption by growers, established distribution networks, and steady availability across wholesale markets, supermarkets, and retail stores supported its strong market presence.

    Organic emerged as the growing segment in 2025, supported by rising consumer interest in food produced through natural farming practices. Growth was encouraged by increasing awareness of sustainable agriculture, greater preference for certified organic produce, and expanding availability through organized retail and online platforms.

    By Produce

    Vegetables (Leafy, Root, Cruciferous) dominate with 53.4% due to their essential role in daily diets and regular consumption.

    In 2025, Vegetables (Leafy, Root, Cruciferous) held a dominant market position, capturing more than 53.4% share of the global fruits and vegetables market by produce sub-category. The segment remained ahead because vegetables are a regular part of everyday meals in households, restaurants, and institutional food services. Their year-round demand, wide cultivation across different climate zones, and continuous supply through traditional and modern retail channels supported their leading position.

    Fruits (Tropical, Citrus, Berries, Pome) represented the growing segment in 2025, driven by increasing consumer preference for nutritious and naturally sweet food options. Rising awareness of healthy eating habits, expanding availability of both domestic and imported fruit varieties, and stronger retail distribution supported the segment’s growth.

    By Fruit

    Bananas dominate with 15.8% due to their year-round availability and widespread consumer preference.

    In 2025, Bananas held a dominant market position, capturing more than 15.8% share of the global fruits and vegetables market by fruit sub-types. The segment maintained its leading position because bananas remained one of the most widely consumed fruits across all age groups, supported by their consistent availability throughout the year and broad distribution through supermarkets, grocery stores, and traditional retail outlets.

    Apples & Pears represented the growing segment in 2025, supported by increasing consumer demand for fresh and nutritious fruit options. Growth was encouraged by improved cold storage infrastructure, wider retail availability, and expanding domestic as well as international trade.

    By Distribution Channel

    Supermarkets / Hypermarkets dominate with 42.0% due to their wide product selection and convenient shopping experience.

    In 2025, Supermarkets / Hypermarkets held a dominant market position, capturing more than 42.0% share of the global fruits and vegetables market by distribution channel. The segment remained the leading sales channel because it offered consumers a wide range of fresh and packaged produce under one roof, along with consistent product quality and convenient shopping.

    Grocery / Convenience Stores emerged as the growing segment in 2025, supported by their easy accessibility and frequent consumer visits for daily food purchases. Their presence in residential neighborhoods and urban locations made them a preferred option for quick shopping, especially for fresh produce bought in smaller quantities.
    By Processing Form

    Juices & Beverages dominate with 28.0% due to their convenience and strong consumer preference for ready-to-consume products.

    In 2025, Juices & Beverages held a dominant market position, capturing more than 28.0% share of the global fruits and vegetables market by processing form (for the processed segment). The segment maintained its leading position because it offered a convenient way for consumers to include fruit and vegetable ingredients in their daily diets.

    Jams, Preserves & Spreads represented the growing segment in 2025, driven by increasing consumer interest in products with longer shelf life and convenient everyday use. Demand continued to rise as these products became popular for breakfast, snacks, and bakery applications.

    Key Market Segments

    By Product Type

    • Fresh Fruits & Vegetables
    • Processed Fruits & Vegetables
    • Frozen Fruits & Vegetables
    • Dried / Dehydrated Fruits & Vegetables
    • Canned & Preserved Fruits & Vegetables

    By Category

    • Conventional
    • Organic

    By Produce

    • Vegetables (Leafy, Root, Cruciferous)
    • Fruits (Tropical, Citrus, Berries, Pome)

    By Fruit

    • Bananas
    • Apples & Pears
    • Citrus Fruits
    • Berries & Grapes
    • Mangoes & Guava
    • Pineapples
    • Watermelon & Melon
    • Others

    By Distribution Channel

    • Supermarkets / Hypermarkets
    • Grocery / Convenience Stores
    • Online Retail / E-Commerce
    • Wet Markets / Traditional Retail
    • Foodservice / HORECA
    • Others

    By Processing Form

    • Juices & Beverages
    • Jams, Preserves & Spreads
    • Frozen & IQF
    • Canned / Tinned
    • Dried & Dehydrated
    • Others (Pickled, Purée)

    Driver Analysis

    Health-led fresh consumption

    Dietary guidance and consumer focus on preventive health are expanding the volume and value of fruit and vegetable consumption, particularly in urban households, institutional foodservice, premium retail, and health-oriented convenience formats. WHO recommends that people older than 10 consume at least 400 g of fruits and vegetables daily, while children aged 2–5 and 6–9 should consume at least 250 g and 350 g respectively; yet intake remains below this benchmark in most population groups, and around one-third of countries lacked sufficient domestic availability to meet 400 g per person per day in 2022.

    This creates a structural consumption gap: moving an urban population of 10 million people just 50 g per day closer to the recommended intake would require an additional 182,500 tonnes of annual produce demand, equivalent to roughly 500 tonnes per day.

    The commercial impact is a shift from bulk seasonal commodity sales toward repeat-purchase categories such as cut vegetables, washed greens, fruit cups, ready-to-cook packs, residue-tested produce, organic lines, high-fibre vegetables, berries, citrus, and functional-snacking formats, where retail realization can be 20%–80% above loose produce when spoilage, processing, packaging, and cold-chain costs remain controlled.

    Drivers Impact Analysis

    Driver (~) % Impact on CAGR Geographic Relevance Impact Timeline
    Health-led fresh consumption +1.8 pp Global urban markets Long term (≥ 4 years)
    Horticulture output expansion +1.6 pp India, China, ASEAN, Africa Short term (≤ 2 years)
    Quick-commerce fresh retail +1.4 pp India, China, SEA, GCC, LATAM Medium term (2-4 years)
    Cold-chain loss reduction +1.3 pp India, Africa, ASEAN, LATAM Medium term (2-4 years)
    Export-grade assortment demand +1.1 pp EU, North America, GCC, East Asia Medium term (2-4 years)
    Precision horticulture adoption +0.9 pp North America, EU, China, India Long term (≥ 4 years)

    Restraint Analysis

    Post-harvest spoilage

    Global food loss between harvest and retail is 13.3%, but fruits and vegetables are materially more exposed, with estimates indicating that nearly 45% may be discarded or wasted before reaching consumers in weak supply chains; a 5-percentage-point spoilage reduction from a 1-million-tonne procurement base would release 50,000 tonnes of sellable product without adding acreage or cultivation cost.

    The unit-economics penalty is severe: if a distributor buys at $300–500 per tonne, incurs $80–150 per tonne in grading, crates, transport, cooling, and handling, and loses 20% of volume, the effective landed cost of the surviving product rises by roughly 25% before retail overhead and margin.

    High loss rates force traders to use wider procurement margins, retailers to mark down fresh inventory, processors to face irregular input supply, and farmers to accept lower farm-gate prices; these effects deter investment in higher-value perishables such as berries, leafy vegetables, exotic fruit, and fresh-cut products.

    Restraint Impact Analysis

    Restraint (~) % Impact on CAGR Forecast Geographic Relevance Impact Timeline
    Post-harvest spoilage -2.1 pp India, Africa, ASEAN, LATAM Short term (≤ 2 years)
    Climate-driven crop volatility -1.8 pp South Asia, Africa, MENA, LATAM Long term (≥ 4 years)
    Farm-to-retail fragmentation -1.5 pp India, Africa, ASEAN, LATAM Medium term (2-4 years)
    Export residue compliance -1.3 pp EU import corridors, Asia, Africa, LATAM Medium term (2-4 years)
    Retail price sensitivity -1.1 pp Global mass-market channels Short term (≤ 2 years)
    Cold-chain capital burden -0.9 pp Emerging markets, rural corridors Medium term (2-4 years)

    Opportunity Analysis

    Fresh-to-processed conversion

    India’s processing penetration remains only 4.5% for fruits and 2.7% for vegetables, compared with 68% for food grains, creating a large conversion white space; applying even a 5-percentage-point increase in processing to a 370.85-million-tonne horticulture base could redirect about 18.5 million tonnes into higher-stability value chains.

    A processor buying cosmetically imperfect produce at 20%–40% below premium fresh grade can recover 55%–85% usable yield depending on crop and process, extend shelf life from 3–14 days to 6–24 months, and generate 15%–35% higher gross margins through branded or business-to-business ingredients.

    India’s FY2026–27 food-processing budget allocation of ₹4,064 crore, including ₹1,000 crore for 50 multi-product irradiation units and 100 NABL-accredited food-testing laboratories, strengthens infrastructure availability; the opportunity remains distinct from baseline consumption because it requires deliberate investment in localized processing clusters, off-take contracts, standardized grades, aseptic or frozen capacity, and demand creation in foodservice and packaged-food channels.

    Opportunity Impact Analysis

    Opportunity (~) % Potential CAGR Upside Geographic Relevance Execution Window
    Fresh-to-processed conversion +2.1 pp India, ASEAN, Africa, LATAM Short term (≤ 2 years)
    Surplus recovery platforms +1.7 pp EU, North America, India, GCC Medium term (2-4 years)
    Farm-to-fork traceability SaaS +1.5 pp U.S., EU, export APAC, LATAM Medium term (2-4 years)
    Controlled-environment produce +1.3 pp GCC, Singapore, Japan, EU, U.S. Long term (≥ 4 years)
    Procurement-platform roll-ups +1.2 pp India, ASEAN, Africa, LATAM Medium term (2-4 years)
    Export-grade value chains +1.0 pp India, Africa, LATAM, ASEAN Medium term (2-4 years)

    Challenges Analysis

    Climate-resilient crop planning

    The World Bank estimated a 61%–87% probability of El Niño emerging by mid-2026 and persisting into 2027, which raises the probability of weather-linked yield and quality variation across South Asia, Africa, Latin America, and Southeast Asia; horticultural crops are particularly sensitive because a 3–7-day heatwave during flowering or fruit set can reduce size, firmness, colour, or marketable grade even where total field yield is retained.

    In India, earlier weather shocks pushed tomato inflation to 37% in July 2023 and potato inflation to 42% in October 2024, demonstrating how a localized harvest disruption can transmit rapidly through national wholesale and retail channels. For a 10,000-tonne annual procurement programme, a 10% climate-driven decline in Grade-A yield can remove 1,000 tonnes of premium stock and force processors and retailers into lower-grade substitutions or long-distance sourcing, increasing delivered cost by an estimated 8%–20%.

    Effective mitigation requires diversified production geographies, crop calendars staggered by 2–6 weeks, heat-tolerant varieties, protected cultivation, micro-irrigation, weather-index insurance, and procurement algorithms that reallocate volume before shortages become visible at wholesale markets.

    Challenges Impact Analysis

    Challenge (~) % CAGR Friction Geographic Relevance Mitigation Horizon
    Climate-resilient crop planning -1.5 pp South Asia, Africa, MENA, LATAM Long term (≥ 4 years)
    Cold-chain execution gaps -1.3 pp India, Africa, ASEAN, LATAM Medium term (2-4 years)
    Seasonal labour instability -1.1 pp North America, EU, Australia, India Long term (≥ 4 years)
    Farm-level data fragmentation -1.0 pp Global, especially emerging markets Medium term (2-4 years)
    Export logistics volatility -0.9 pp Asia–EU, LATAM–EU, MENA corridors Medium term (2-4 years)
    Residue-control standardization -0.8 pp EU import hubs, Asia, Africa, LATAM Long term (≥ 4 years)

    Geopolitical Impact Analysis

    Geopolitical conflicts are reshaping fruit and vegetable supply chains through higher logistics and input costs.

    The ongoing conflicts in Eastern Europe and the Middle East continue to influence the global fruits and vegetables market by disrupting transportation, increasing production costs, and creating uncertainty in agricultural trade. Fresh produce depends on efficient logistics, refrigerated transport, and stable energy supplies, making the sector highly sensitive to geopolitical tensions.

    • According to the Food and Agriculture Organization (FAO), the FAO Food Price Index averaged 127.2 points in 2025, representing a 4.3% increase compared with 2024, reflecting the impact of higher prices across several food commodities. These cost increases have affected producers, exporters, retailers, and consumers throughout the fresh produce value chain.

    Many fruit and vegetable exporters have responded by diversifying sourcing locations, strengthening regional supply networks, and investing in cold-chain infrastructure to reduce delivery risks. Governments and food safety authorities have also prioritized domestic food production, strategic food reserves, and improved logistics to strengthen food security. Businesses are increasingly relying on local procurement and shorter transportation routes to reduce exposure to global disruptions.

    Regional Analysis

    Regional Analysis: Asia Pacific.

    Asia Pacific stands as the dominant region in the global fruit and vegetable market, commanding a 48.0% share of total value, equivalent to USD 271.3 billion, reflecting the region’s unmatched scale in cultivation, processing, and consumption of fresh produce. This leadership position is anchored in the region’s vast agricultural base, favorable growing climates, and large domestic consumer markets across East and Southeast Asia.

    • According to the Food and Agriculture Organization (FAO), Asia dominated the global production of major vegetables and fruits in 2024, with China alone accounting for 55% of the world’s peas output and 39% of the global chilies and peppers output. This concentration underscores the region’s structural advantage in high-volume horticultural farming.

    Supporting this dominance, global vegetable production reached 1.2 billion tonnes and fruit production reached 954 million tonnes in 2024, according to the FAO, with Asia contributing the largest regional share of both categories. Reflecting this leadership, global production of mangoes, guavas, and mangosteen crops predominantly cultivated across Asia Pacific rose 55% between 2010 and 2024, while apple production increased 37% over the same period, further reinforcing the region’s role as the chief driver of world fruit output growth.

    Key Regions and Countries Covered

    • North America
      • The US
      • Canada
    • Europe
      • Germany
      • France
      • The UK
      • Spain
      • Italy
      • Russia & CIS
      • Rest of Europe
    • APAC
      • China
      • Japan
      • South Korea
      • India
      • ASEAN
      • Rest of APAC
    • Latin America
      • Brazil
      • Mexico
      • Rest of Latin America
    • Middle East & Africa
      • GCC
      • South Africa
      • Rest of MEA

    Key Players Analysis

    Producers, growers, processors, and distributors in the fruits and vegetables market focus on expanding product quality, improving supply chain efficiency, and strengthening market reach to remain competitive. A major priority is increasing the production of high-quality fresh produce while reducing post-harvest losses through better harvesting, grading, packaging, and storage practices.

    Market participants are also strengthening relationships with farmers through contract farming, direct sourcing, and sustainable agricultural practices to ensure a reliable supply of quality produce. Investments in digital technologies, including farm monitoring, inventory management, and demand forecasting, are helping improve operational efficiency across the value chain.

    Market Key Players

    • Dole plc
    • Fresh Del Monte Produce Inc.
    • Chiquita Brands International, Inc.
    • Driscoll’s, Inc.
    • Calavo Growers, Inc.
    • Greenyard NV
    • Nature’s Pride B.V.
    • Unifrutti Group
    • Bonduelle S.A.
    • ADM (Archer Daniels Midland Co.)
    • The Kraft Heinz Company
    • Conagra Brands, Inc.
    • General Mills, Inc.
    • Zespri International Ltd.
    • Other Key Players

    Key Development

    • In February 2026, Dole plc reported its fourth quarter and full year 2025 financial results, with full year revenue of USD 9.2 billion, an increase of 2%, and Adjusted EBITDA of USD 395.4 million, while also announcing an agreement to sell its port assets in Ecuador for expected net proceeds of approximately USD 75 million.
    • In February 2026, Fresh Del Monte Produce Inc. reported fourth quarter and full fiscal year 2025 results, with full year earnings per diluted share of USD 1.88 and Adjusted earnings per diluted share of USD 3.68, up 22% year over year, supported by improved product mix across all business segments.
    • In February 2026, Bonduelle Group reported its first half fiscal year 2025-2026 sales and financial results, with sales of EUR 1,111.1 million and current operating income of EUR 50.5 million, representing an operating margin of 4.5%, up from 3% in the prior year period.
    • In May 2026, Zespri International Limited reported record financial results for the 2025/26 season, with global fruit sales revenue reaching a record NZ$5.9 billion from a record 248.1 million trays sold, and net profit after tax of NZ$280.1 million, up from NZ$155.2 million in the prior season.

    Report Scope

    Report Features Description
    Market Value (2025) US$565.1 Bn
    Forecast Revenue (2035) US$889.3 Bn
    CAGR (2026 2035) 4.64%
    Base Year for Estimation 2025
    Historic Period 2020-2024
    Forecast Period 2026-2035
    Report Coverage Revenue Forecast, Market Dynamics, Competitive Landscape, Recent Developments
    Segments Covered By Product Type (Fresh Fruits & Vegetables, Processed Fruits & Vegetables, Frozen Fruits & Vegetables, Dried / Dehydrated Fruits & Vegetables, Canned & Preserved Fruits & Vegetables), By Category (Conventional, Organic), By Produce (Vegetables (Leafy, Root, Cruciferous), Fruits (Tropical, Citrus, Berries, Pome)), By Fruit (Bananas, Apples & Pears, Citrus Fruits, Berries & Grapes, Mangoes & Guava, Pineapples, Watermelon & Melon, Others), By Distribution Channel (Supermarkets / Hypermarkets, Grocery / Convenience Stores, Online Retail / E-Commerce, Wet Markets / Traditional Retail, Foodservice / HORECA, Others), By Processing Form (Juices & Beverages, Jams, Preserves & Spreads, Frozen & IQF, Canned / Tinned, Dried & Dehydrated, Others (Pickled, Purée))
    Regional Analysis North America    The US & Canada; Europe    Germany, France, The UK, Spain, Italy, Russia & CIS, Rest of Europe; APAC  China, Japan, South Korea, India, ASEAN & Rest of APAC; Latin America  Brazil, Mexico & Rest of Latin America; Middle East & Africa  GCC, South Africa, & Rest of MEA
    Competitive Landscape Dole plc, Fresh Del Monte Produce Inc., Chiquita Brands International, Inc., Driscoll’s, Inc., Calavo Growers, Inc., Greenyard NV, Nature’s Pride B.V., Unifrutti Group, Bonduelle S.A., ADM (Archer Daniels Midland Co.), The Kraft Heinz Company, Conagra Brands, Inc., General Mills, Inc., Zespri International Ltd., Other Key Players
    Customization Scope Customization for segments, region/country level will be provided. Moreover, additional customization can be done based on the requirements.
    Purchase Options We have three licenses to opt for: Single User License, Multi User License (Up to 5 Users), Corporate Use License (Unlimited Users and Printable PDF)


    keyboard_arrow_up
  • Segments Sub-segments
    By Product Type
    • Fresh Fruits & Vegetables
    • Processed Fruits & Vegetables
    • Frozen Fruits & Vegetables
    • Dried / Dehydrated Fruits & Vegetables
    • Canned & Preserved Fruits & Vegetables
    By Category (Nature)
    • Conventional
    • Organic
    By Produce Sub-Category
    • Vegetables (Leafy, Root, Cruciferous)
    • Fruits (Tropical, Citrus, Berries, Pome)
    By Battery Type
    • Bananas
    • Apples & Pears
    • Citrus Fruits
    • Berries & Grapes
    • Mangoes & Guava
    • Pineapples
    • Watermelon & Melon
    • Others
    By Distribution Channel
    • Supermarkets / Hypermarkets
    • Grocery / Convenience Stores
    • Online Retail / E-Commerce
    • Wet Markets / Traditional Retail
    • Foodservice / HORECA
    • Others
    By Processing Form (for Processed Segment)
    • Juices & Beverages
    • Jams, Preserves & Spreads
    • Frozen & IQF
    • Canned / Tinned
    • Dried & Dehydrated
    • Others (Pickled, Purée)

     
    North America Europe Asia Pacific Latin America Middle East & Africa
    • US
    • Canada
    • Germany
    • France
    • The UK
    • Spain
    • Italy
    • Rest of Europe
    • China
    • Japan
    • South Korea
    • India
    • Australia
    • Rest of APAC
    • Brazil
    • Mexico
    • Rest of Latin America
    • GCC
    • South Africa
    • Rest of MEA
Fruits And Vegetables Market
Published date: August 2026
add_shopping_cartBuy Now get_appDownload Sample

Related Reports

  • Aerogel Market
  • 3D Printing Metal Market
  • Optical Coatings Market
  • Synthetic Leather Market
  • Flame Retardant Market
  • Citric Acid Market
Fruits And Vegetables Market
  • 118001
  • August 2026
    • ★★★★★
      ★★★★★
Buy Now
Trusted by more than 17382 organizations globally
  • Client Logo
  • Client Logo
  • Client Logo
  • Client Logo
  • Client Logo
  • Client Logo
  • Client Logo
  • Client Logo
  • Client Logo
  • Client Logo
  • Client Logo
  • Client Logo
  • Client Logo
  • Client Logo
  • Client Logo
  • Client Logo

Our Clients

philips
pentair
suez
ecowater
ergobaby
fabricato
genomatica
lenzing
lilly
siemens
honeywell
valspar
pactiv
petsure
schweitzer-online
sappi
pfizer
unilabs
lonza
BD
mckinsey
hilti
✖
Request a Sample Report
We'll get back to you as quickly as possible

✖
Request a Sample Report
We'll get back to you as quickly as possible

  • location_on420 Lexington Avenue, Suite 300 New York City, NY 10170,
    United States
  • phone+1 718 874 1545 (International)
  • phone+91 78878 22626 (Asia)
  • emailinquiry@market.us
  • Facebook Logo
  • Twitter Logo
  • LinkedIn Logo
Find Help
  • Contact Us
  • How to Order
Legal
  • Privacy Policy
  • Refund Policy
  • Frequently Asked Questions
  • Terms and Conditions
Explore
  • About Us
  • Our Clients
  • Media Mentions
  • Infographics
  • Statistics and Facts
  • Research Methodology
  • Why Choose Us?
Secured Payment Options

© 2026 Market.Us. All Rights Reserved.