


Report Overview
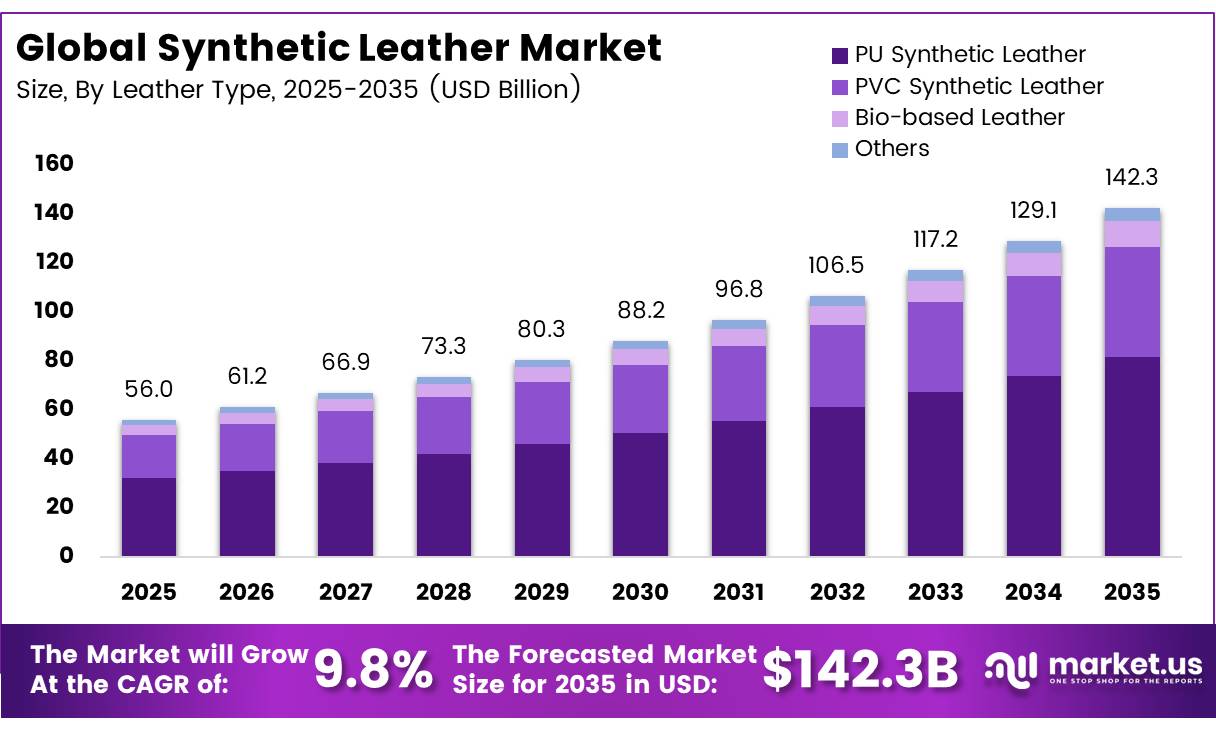
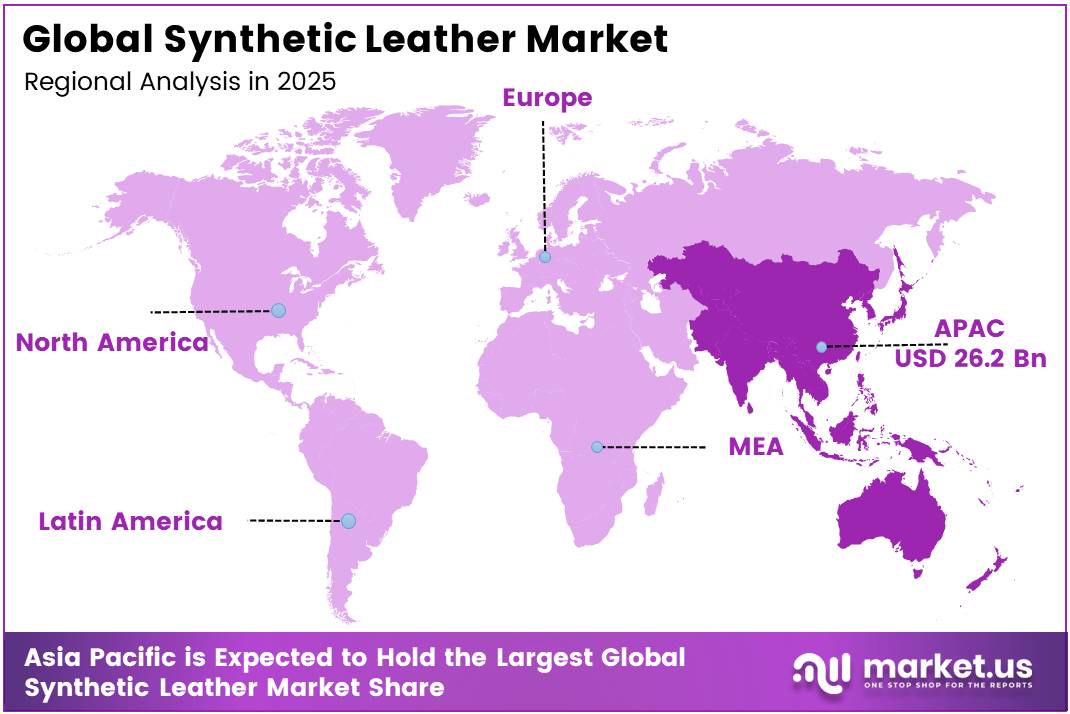
In 2025, the Global Synthetic Leather Market was valued at US$56.0 billion, and between 2026 and 2035, this market is estimated to register a CAGR of 9.8%, reaching about US$142.3 billion by 2035. In 2025, Asia Pacific led the market, achieving over 46.8% share with a revenue of US$ 26.21 Billion.
Synthetic leather is an engineered surface material used as an alternative to animal leather in footwear, apparel, furniture and accessories. The industry relies on coated textile backings that provide consistent colour, flexibility, abrasion resistance and scalable manufacturing. Demand is increasingly influenced by online fashion sales, material affordability and brand requirements for uniform quality.
- In February 2025, according to Eurostat, clothing, including sportswear, shoes and accessories was the most frequently purchased online goods category in the EU during 2024, bought by 45% of people within the previous three months.
Circularity is becoming a major growth direction for synthetic leather producers. In February 2025, according to the Council of the European Union, the EU generated 12.6 million tonnes of textile waste annually, while clothing and footwear represented 5.2 million tonnes, or 12 kilograms per person. In February 2026, according to the European Commission, 4%–9% of unsold textiles were destroyed annually, generating about 5.6 million tonnes of carbon-dioxide emissions; the destruction ban for large companies applies from 19 July 2026. These developments create opportunities for water-based coatings, recycled textile backings, durable constructions, repairable products and traceable supply chains across future synthetic leather manufacturing.
Key Takeaways
- The global synthetic leather market was valued at USD 56.0 billion in 2025.
- The global market is projected to grow at a CAGR of 9.8% and is estimated to reach USD 142.3 billion by 2035.
- On the basis of leather type, the PU synthetic leather dominated the Global Synthetic Leather market, constituting 57.3% of the total market share in 2025.
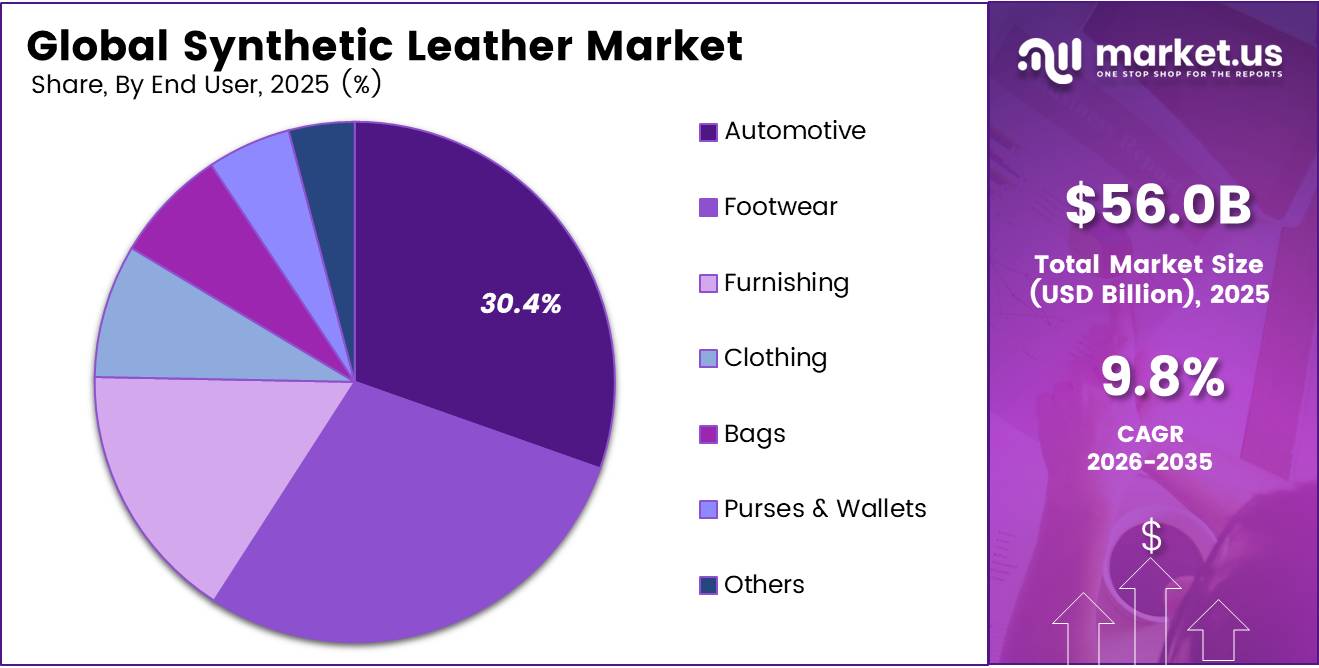
- Among the end-users, the automotive industry held a major share in the synthetic leather market, 30.4% of the market share in 2025.
- Based on the distribution channel, the direct dominated the synthetic leather market, with a substantial market share of around 63.4% in 2025.
- In 2025, the Asia Pacific was the most dominant region in the synthetic leather market, accounting for 46.8% of the total global consumption.
Leather Type Analysis
PU Synthetic Leather represents dominant Segment in the Market.
Polyurethane (PU) synthetic leather accounted for 57.3% of the market because it offers an ideal balance of durability, softness, breathability, and aesthetic appeal across multiple end-use industries. Its widespread adoption in automotive interiors, footwear, furniture, fashion accessories, and upholstery continues to strengthen demand. Compared with PVC-based alternatives, PU synthetic leather provides greater comfort, enhanced flexibility, and lower environmental impact, while ongoing advancements in water-based and solvent-free PU technologies further support its preference among manufacturers seeking high-performance, sustainable material solutions.
Bio-based leather is projected to be the fastest-growing segment as manufacturers and global brands increasingly invest in sustainable material alternatives to reduce dependence on petroleum-based products. Continuous innovations using plant-based feedstocks, agricultural waste, and mycelium are improving product performance and commercial scalability, enabling bio-based leather to gain traction across premium fashion, automotive, and lifestyle applications.
Distribution Channel Analysis
Direct procurement dominates the Distribution Channel Segment
Direct procurement accounted for 63.4% of the synthetic leather market as large manufacturers prioritize long-term supplier relationships to ensure consistent material quality, stable pricing, and reliable product availability. Automotive, footwear, furniture, and fashion companies often work directly with producers to obtain customized specifications, technical support, and greater supply chain transparency. This approach also improves production planning, strengthens quality control, and reduces procurement risks, making direct sourcing the preferred distribution channel for high-volume industrial buyers.
Indirect procurement is expected to witness the fastest growth as small and medium-sized manufacturers increasingly rely on distributors and digital sourcing platforms to access diverse synthetic leather products without maintaining direct supplier contracts. Expanding e-commerce, wider product availability, and shorter delivery times are making indirect channels more attractive. Additionally, distributors offer flexible order quantities, localized inventory, and value-added services, enabling businesses to respond quickly to changing customer preferences while reducing procurement complexity and operational costs.
End Use Analysis
Synthetic Leather Are Mostly Utilized in the Automotive Sector.
EV platform development is deepening automotive’s position with 30.4% as vehicle manufacturers increasingly prefer synthetic leather for its durability, lightweight properties, and consistent quality. The material enhances interior aesthetics while supporting sustainability goals through reduced reliance on animal-derived products. Growing production of electric and premium vehicles, combined with rising consumer demand for comfortable, easy-to-maintain interiors, continues to strengthen adoption. Synthetic leather also offers greater design flexibility, cost efficiency, and scalable manufacturing, making it the preferred choice for modern automotive interiors.
For instance, May 2026, Škoda Auto unveiled the Škoda Epiq electric SUV, featuring premium synthetic leather upholstery in higher variants alongside sustainable interior materials made from 100% recycled polyester. The launch reflects the growing adoption of synthetic leather in EV interiors to enhance durability, premium aesthetics, and sustainability while supporting lightweight vehicle design.
The footwear segment is expected to register the fastest growth as manufacturers increasingly adopt synthetic leather to produce lightweight, durable, and affordable shoes that appeal to a wide consumer base. Rising demand for athletic, casual, and fashion footwear, coupled with growing awareness of cruelty-free and sustainable materials, is accelerating adoption. Continuous product innovations, improved comfort, enhanced moisture resistance, and expanding online retail channels are further supporting the rapid growth of synthetic leather across global footwear manufacturing.
Key Market Segments
By Leather Type
- PU Synthetic Leather
- PVC Synthetic Leather
- Bio-based Leather
- Others
By Distribution Channel
- Direct
- Indirect
By End User
- Automotive
- Footwear
- Furnishing
- Clothing
- Bags
- Purses & Wallets
- Others
Drivers
Sustainability shift from natural leather to synthetic alternatives
Sustainability shift from natural leather to synthetic alternatives is a primary structural driver because it taps into long‑horizon ESG, animal‑welfare and resource‑efficiency narratives that are reconfiguring buyer preferences across fashion, automotive and furniture, raising the ceiling for synthetic leather penetration rather than just cycling demand.
As major fashion and auto brands adopt explicit animal‑free or “leather‑free” pledges for selected lines, the substitution curve accelerates: even if synthetic replaces only 20–30% of natural leather volumes in premium segments by 2030–2035, the revenue impact is magnified by higher specification and value‑added finishes.
Strategically, this driver alters business models by moving synthetic‑leather producers from low‑cost PVC commodity positioning toward brand‑aligned sustainability partners, where they can command higher ASPs for LCA‑verified, traceable and, in some cases, bio‑based materials; this shift plausibly adds 2–2.5 percentage points of CAGR to the sector versus a world where natural leather’s environmental and ethical profile remained uncontested and synthetic leather was viewed purely as a cheap substitute.
Drivers Impact Analysis
| Driver | (~) % Impact on CAGR | Geographic Relevance | Impact Timeline |
|---|---|---|---|
| Sustainability shift from natural leather to synthetic alternatives | +2.3% | Asia-Pacific core, EU, North America, Latin America spill-over | Long term (≥ 4 years) |
| Expansion in footwear, athleisure and fashion accessories | +2.0% | APAC manufacturing hubs, EU fashion centers, North America | Medium term (2-4 years) |
| Automotive interior upgrades and EV-specific design trends | +1.9% | China, EU, North America, South Korea-Japan | Medium term (2-4 years) |
| Material innovation in bio-based, waterborne and solvent-free synthetics | +1.7% | EU regulatory hubs, Japan, North America, premium APAC | Long term (≥ 4 years) |
| Emerging markets urbanization and middle-class lifestyle upgrades | +1.6% | India, ASEAN, Africa, Latin America | Long term (≥ 4 years) |
| OEM/brand ESG mandates and sustainable procurement standards | +1.5% | EU, U.K., U.S., global consumer brands | Medium term (2-4 years) |
Restraints
PVC/PU toxicity, VOC and regulatory pressure
PVC/PU toxicity, VOC and regulatory pressure is a structural restraint because the mainstream chemistries underpinning synthetic leather—PVC plastisols and solvent‑borne PU systems with N,N‑dimethylformamide (DMF) and other hazardous solvents—sit squarely in the crosshairs of tightening chemical, worker‑safety and emissions rules, forcing continuous reformulation and capex for abatement that raise cost and risk without collapsing demand.
In practice, this means producers in EU, U.S., Japan and advanced APAC markets must invest in waterborne PU dispersions, solvent‑free coatings, alternative plasticizers and closed‑loop emissions controls, raising capex per line and opex per square meter while going through lengthy requalification with OEMs; smaller Asian producers selling into less regulated markets often lag this transition, but face future export barriers as import rules tighten.
Strategically, the sector cannot simply walk away from PVC/PU overnight due to installed capacity and cost advantages, so it operates in a prolonged dual‑track mode—maintaining legacy lines under stricter compliance while scaling new chemistries—which dilutes capital efficiency and slows net margin expansion; this drag likely trims around 2 percentage points from potential global CAGR relative to a hypothetical where core chemistries were not under sustained regulatory and tox‑eco scrutiny.
Restraint Impact Analysis
| Restraint | (~) % Impact on CAGR | Geographic Relevance | Impact Timeline |
|---|---|---|---|
| PVC/PU toxicity, VOC and regulatory pressure | -2.1% | EU, U.S., Japan, advanced APAC | Long term (≥ 4 years) |
| Fossil-based feedstock and microplastic sustainability backlash | -1.9% | EU regulatory hubs, U.K., North America, premium brands | Long term (≥ 4 years) |
| Volatile petrochemical feedstock and coating-chemical costs | -1.7% | Asia production hubs, EU, North America | Medium term (2-4 years) |
| Overcapacity, price compression and low-cost Asian competition | -1.6% | Global, acute in Asia-to-EU/US trade lanes | Medium term (2-4 years) |
| Quality, durability and performance perception gaps vs. natural leather | -1.5% | Global, strong in luxury and high-end automotive | Long term (≥ 4 years) |
| Brand and consumer confusion over “vegan vs. sustainable” claims | -1.3% | EU, U.S., global D2C brands | Medium term (2-4 years) |
Opportunity
Next-gen bio-based and mycelium hybrid leather platforms
Next‑gen bio‑based and mycelium hybrid leather platforms represent a forward opportunity rather than a current driver because, while early products exist, they remain niche and small‑scale relative to the >40–50 billion USD synthetic‑leather base, yet they sit at the convergence of strong animal‑free, low‑water and reduced‑fossil‑content demand signals that will shape premium segments to 2035. Technical reviews of leather alternatives highlight that conventional synthetic leather can reduce water use by 90–95% versus chrome‑tanned hides, but that emerging mycelium, plant‑based and bio‑PU materials have the potential to further improve environmental profiles if they can be scaled and cost‑optimized.
Today, most mycelium and plant‑based “leathers” are pilot‑scale, targeted at luxury capsules and collaborations, with square‑meter costs several times that of PU/PVC sheets, meaning they are not yet factored into mainstream growth models; however, by 2035, even 5–10% penetration into high‑margin footwear, handbags and small‑leather‑goods TAM—segments where global leather goods revenues are projected in the high‑hundreds of billions—would translate into multi‑billion‑dollar revenue pools.
Strategically, building integrated “next‑gen leather” platforms with their own brands, certifications and LCA datasets allows these players to expand into luxury, automotive and electronics segments that currently cap synthetic‑leather share due to authenticity and sustainability perceptions; successful execution could add roughly 2 percentage points of CAGR on top of baseline synthetic‑leather forecasts by unlocking high‑price, low‑volume niches that are largely excluded from conventional projections.
Opportunity Impact Analysis
| Opportunity | (~) % Potential CAGR | Geographic Relevance | Execution Window |
|---|---|---|---|
| Next-gen bio-based and mycelium hybrid leather platforms | +2.2% | EU, U.S., Japan, premium APAC | Long term (≥ 4 years) |
| Chemical and mechanical recycling–enabled circular synthetic leather | +2.0% | EU, U.K., North America, China | Long term (≥ 4 years) |
| DMF-free, low-VOC PU technology licensing and tolling ecosystems | +1.8% | APAC production hubs, EU, North America | Medium term (2-4 years) |
| Segment-specific performance brands for EV, outdoor and luxury | +1.7% | China, EU, U.S., South Korea-Japan | Medium term (2-4 years) |
| Digital design, on-demand coloring and mass-customization platforms | +1.5% | Global, strongest in EU, U.S., China | Medium term (2-4 years) |
| M&A roll-ups into global “next-gen materials” champions | +1.4% | EU, U.S., APAC innovation corridors | Long term (≥ 4 years) |
Challenges
Volatile petrochemical and backing-fabric input costs
Volatile petrochemical and backing‑fabric input costs are a persistent challenge rather than an outright restraint because they do not halt production but continuously compress margins, destabilize pricing and complicate long‑term contracts, forcing producers to operate with higher risk premia and more conservative capex plans than headline demand growth alone would suggest
Polyester and cotton backings add another layer of variability linked to petrochemical and agricultural cycles, while energy costs for drying, curing and lamination move with regional power and gas tariffs, meaning total variable cost per square meter can deviate by 10–20% from initial assumptions over 12–24 months. For OEMs and brands operating on fixed‑season pricing and budgets, such volatility leads to intense negotiations and, at times, down‑specification of materials or shifting of volumes to other substrates, eroding the ability of producers to pass through spikes and encouraging shorter contract tenors that raise commercial uncertainty.
Strategically, manufacturers respond with hedging, multi‑sourcing, inventory buffers and index‑linked pricing clauses, but these tools are imperfect and add working‑capital and administrative burdens; across the global sector this ongoing cost noise likely shaves around 1.5–1.6 percentage points from maximum feasible CAGR, as some planned capacity additions are delayed, marginal producers exit in high‑cost phases, and demand is temporarily diverted to alternative materials when synthetic‑leather price inflation overshoots consumer tolerance.
Challenges Impact Analysis
| Challenge | (~) % CAGR Friction Drag | Geographic Relevance | Mitigation Horizon |
|---|---|---|---|
| Volatile petrochemical and backing-fabric input costs | -1.6% | APAC manufacturing hubs, EU, North America | Medium term (2-4 years) |
| Regulatory complexity on solvents, VOCs and hazardous additives | -1.5% | EU regulatory hubs, U.S., Japan, Korea | Long term (≥ 4 years) |
| Non-biodegradability and waste management pressure | -1.4% | EU, U.K., North America, advanced APAC | Long term (≥ 4 years) |
| Asia-centric capacity concentration and logistics vulnerability | -1.3% | Asia-to-EU/US trade lanes, India, ASEAN | Medium term (2-4 years) |
| Traceability, ESG data gaps and greenwashing risk | -1.2% | EU, U.K., U.S., global brands’ supply chains | Medium term (2-4 years) |
| Skilled-operator, process and digitalization talent gaps | -1.1% | Global, pronounced in emerging Asia clusters | Long term (≥ 4 years) |
Geopolitical Impact Analysis
Active conflict zones and sanctions pressure are forcing synthetic leather supply chains to reprice risk across Middle Eastern and Central Asian corridors.
The Russia-Ukraine war has done something more lasting than disrupt short-term supply flows it has permanently removed a significant upstream chemical supplier from European procurement. Russia’s SIBUR remains under the EU’s February 2025 expanded sanctions package, and European manufacturers have rebuilt feedstock sourcing around domestic suppliers at structurally higher input costs that are not cyclical.
Simultaneously, Houthi attacks on Red Sea shipping documented continuously through 2025 by UNCTAD’s maritime disruption monitoring have forced Asia-Europe container rerouting around the Cape of Good Hope, adding 10 to 14 transit days and 20 to 30% additional freight costs per container. For Vietnamese and Chinese synthetic leather manufacturers on just-in-time schedules to European automotive clients, that is an embedded cost shift making nearshore production meaningfully more competitive than it has been in years.
Iran’s escalating tensions with Israel and Gulf states through 2025 introduced a feedstock risk that Asian PVC-dependent manufacturers cannot easily hedge. The US Treasury’s January 2025 expanded sanctions on Iranian petrochemical export networks have already tightened ethylene and propylene derivative availability across Asian markets. Persian Gulf supply disruption is no longer a tail risk for South and Southeast Asian producers it is an active planning variable. The cumulative effect of simultaneous conflict pressure across three theatres is a sourcing logic shift across the industry: manufacturers are accepting cost premiums for nearshore chemical suppliers over cheaper but geopolitically exposed import sources, a trade-off that will outlast the conflicts driving it.
Regional Analysis
Asia Pacific Held the Largest Share of the Global Synthetic Leather Market.
Asia Pacific represents the largest market share of 46.8%, this dominance reflects integrated supply chain depth built over decades co-located chemical processing, fabric manufacturing, and end-use industries operating within cost structures that cannot be replicated quickly elsewhere. China’s Ministry of Industry and Information Technology 2025 synthetic materials development plan designated advanced synthetic leather as a strategic export category, allocating preferential energy tariffs and land for upgraded production facilities. That policy commitment signals active government intent to defend export competitiveness rather than allow gradual attrition.
The US Inflation Reduction Act’s domestic content requirements for EV components are translating directly into synthetic leather manufacturing investment. Interior suppliers serving IRA-qualifying programmes face structural pressure to source from North American producers. Ford’s 2025 supplier diversity report referenced active qualification of North American synthetic leather suppliers for next-generation EV interior programmes, with domestic sourcing preference explicitly linked to IRA compliance a regulatory-to-procurement linkage with policy durability that sustains investment commitment beyond individual sourcing cycles.
Key Regions and Countries Covered
- North America
- The US
- Canada
- Europe
- Germany
- France
- The UK
- Spain
- Italy
- Russia & CIS
- Rest of Europe
- APAC
- China
- Japan
- South Korea
- India
- ASEAN
- Rest of APAC
- Latin America
- Brazil
- Mexico
- Rest of Latin America
- Middle East & Africa
- GCC
- South Africa
- Rest of MEA
Key Players Analysis
Synthetic leather vendors focus on strengthening technological differentiation, production scale efficiency, and supply chain integration to maintain competitiveness across automotive, footwear, and furnishing end markets. A key priority is continuous material innovation including ceramic-influenced coating technologies, ultra-thin microfibre substrates, and high-porosity membrane structures that improve thermal stability, surface durability, and performance consistency for demanding automotive interior applications.
Companies like Stahl Holdings / Stahl Group, Covestro AG, Evonik Industries are further investing heavily in waterborne and solvent-free manufacturing expansion, as these processes deliver more uniform surface structures, satisfy tightening European REACH compliance requirements, and support premium electric vehicle interior qualification programmes that solvent-based production cannot access.
Vertical integration with polyurethane chemical suppliers and automotive tier-one manufacturers helps leading producers secure raw material stability and improve cost control amid volatile MDI and TDI input pricing. Strategic capacity expansion, particularly across Asia Pacific, enables alignment with concentrated demand from electric vehicle and footwear production ecosystems.
Teijin Cordley reinforces competitive positioning through deep automotive qualification histories across Japanese and European OEM platforms, while Kuraray competes on surface performance consistency and bio-content documentation capabilities aligned with 2026 model year procurement requirements. Wanhua Chemical Group leverages upstream MDI production integration to compress input cost exposure that independent converters absorb entirely at market rates.
The Major Players In The Industry
- KURARAY CO., LTD.
- ALFATEX ITALIA SRL
- FILWEL Co., Ltd.
- R. Polycoats Private Limited.
- Jasch Industries Limited
- Mayur Uniquoters Limited
- Nan Ya Plastics Corporation
- Responsive Industries Ltd.
- San Fang Chemical Industry Co. Ltd.
- Teijin Cordley Limited
- Wanhua Chemical Group Co.,Ltd.
- Yantai Wanhua Synthetic Leather Group Co. Ltd.
- Other Key Players
Key Development
- In February 2026, Wanhua Chemical Group Co., Ltd. Announced expansion of its MDI production capacity at its Yantai, China facility, directly strengthening upstream polyurethane feedstock supply for its synthetic leather downstream operations amid tightening European MDI availability; expansion targeted at both domestic and export-oriented synthetic leather manufacturers.
- In January 2026, Kuraray expanded its CLARINO man‑made leather portfolio with sustainable variants, building on recycled‑nylon Eco RX8060 and water‑borne Tirrenina technologies to target fashion, interiors, and mobility applications.
Report Scope
| Report Features | Description |
|---|---|
| Market Value (2025) | US$56.0 Bn |
| Forecast Revenue (2035) | US$ 142.3 Bn |
| CAGR (2026-2035) | 9.8% |
| Base Year for Estimation | 2025 |
| Historic Period | 2020-2024 |
| Forecast Period | 2026-2035 |
| Report Coverage | Revenue Forecast, Market Dynamics, Competitive Landscape, Recent Developments |
| Segments Covered | By Leather Type (PU Synthetic Leather, PVC Synthetic Leather, Bio-based Leather, and Others), By End User (Automotive, Footwear, Furnishing, Clothing, Bags, Purses & Wallets, and Others), By Distribution Channel (Direct and Indirect) |
| Regional Analysis | North America – The US & Canada; Europe – Germany, France, The UK, Spain, Italy, Russia & CIS, Rest of Europe; APAC– China, Japan, South Korea, India, ASEAN & Rest of APAC; Latin America– Brazil, Mexico & Rest of Latin America; Middle East & Africa– GCC, South Africa, & Rest of MEA |
| Competitive Landscape | KURARAY CO., LTD., ALFATEX ITALIA SRL, FILWEL Co., Ltd., H.R. Polycoats Private Limited., Jasch Industries Limited, Mayur Uniquoters Limited, Nan Ya Plastics Corporation, Responsive Industries Ltd., San Fang Chemical Industry Co. Ltd., Teijin Cordley Limited, Wanhua Chemical Group Co.,Ltd., Yantai Wanhua Synthetic Leather Group Co. Ltd., Other Key Players |
| Customization Scope | Customization for segments, region/country-level will be provided. Moreover, additional customization can be done based on the requirements. |
| Purchase Options | We have three licenses to opt for: Single User License, Multi-User License (Up to 5 Users), Corporate Use License (Unlimited Users and Printable PDF) |





































