


Report Overview
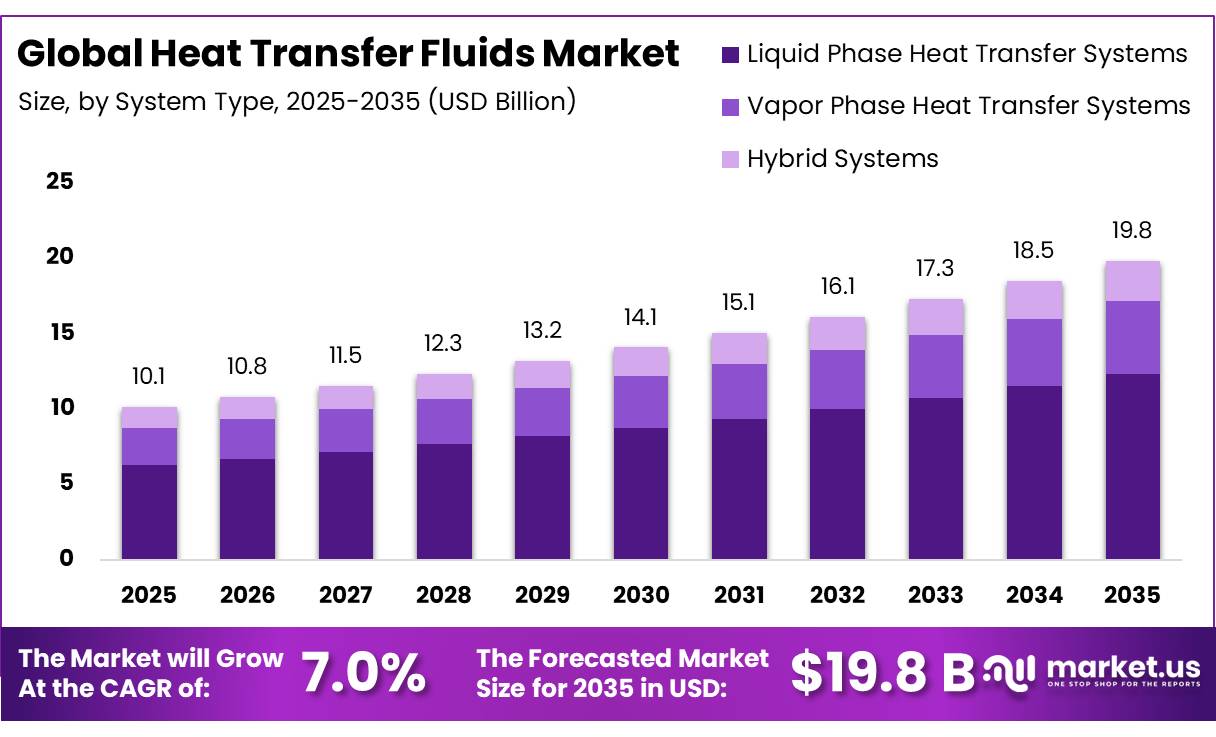
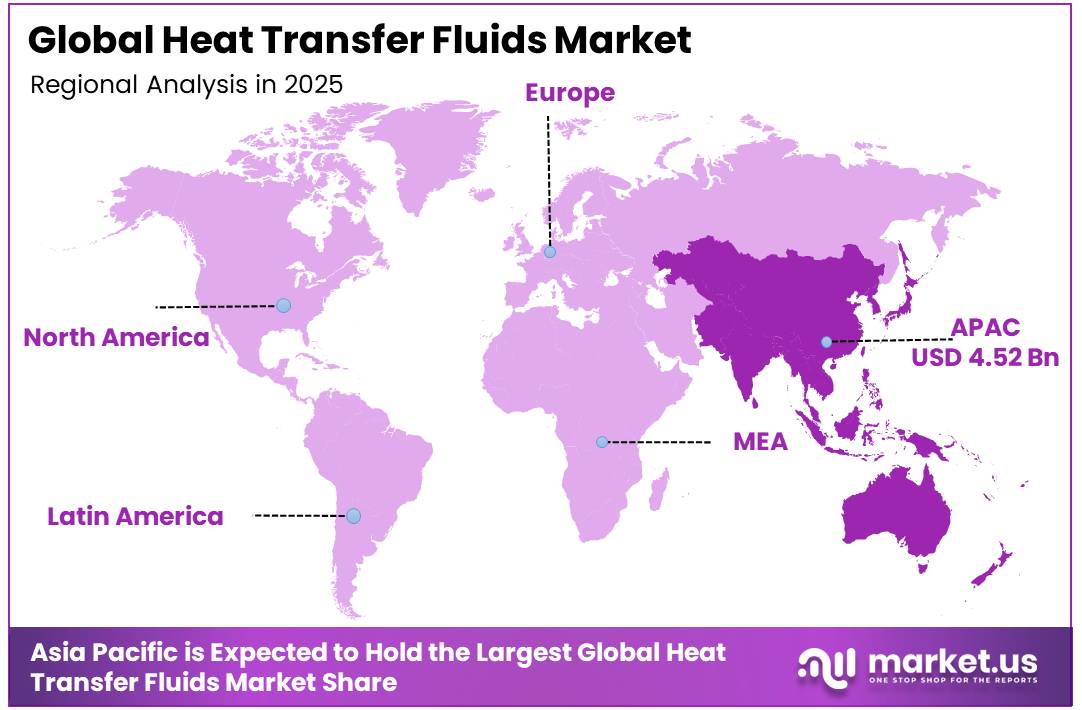
In 2025, the Global Heat Transfer Fluids Market was valued at US$10.1 billion, and between 2026 and 2035, this market is estimated to register a CAGR of 7.0%, reaching about US$19.8 billion by 2035. Asia Pacific held a dominant market position, capturing more than a 44.60% share, holding USD 4.52 billion in revenue.
The heat transfer fluids market is a specialty chemical segment serving controlled heating, cooling, and thermal energy transfer in chemical processing, oil and gas, concentrated solar power, food processing, pharmaceuticals, heating, ventilation, air conditioning, and refrigeration systems.
- In 2025, the United States Energy Information Administration said the industrial sector accounted for 33% of total United States energy consumption, showing the scale of thermal operations that need reliable fluids.
Key Takeaways
- The global Heat Transfer Fluids Market was valued at USD 10.1 billion in 2025.
- The global Market is projected to grow at a CAGR of 7.0% and is estimated to reach USD 19.8 billion by 2035.
- Glycol-Based Fluids dominated the market, constituting 36.80% of the total market share.
- Chemical Processing dominated the heat transfer fluids market, with a substantial market share of around 33.90%.
- Chemicals & Petrochemicals led the market, comprising 38.50% of the total market.
- Liquid Phase Heat Transfer Systems held a major share in the heat transfer fluids market, accounting for 62.10% of the market share.
- Low Temperature Fluids were the most considerable within the market, accounting for around 41.20% of the revenue.
- Cooling Applications dominated the heat transfer fluids market, accounting for 48.60% of the total market share.
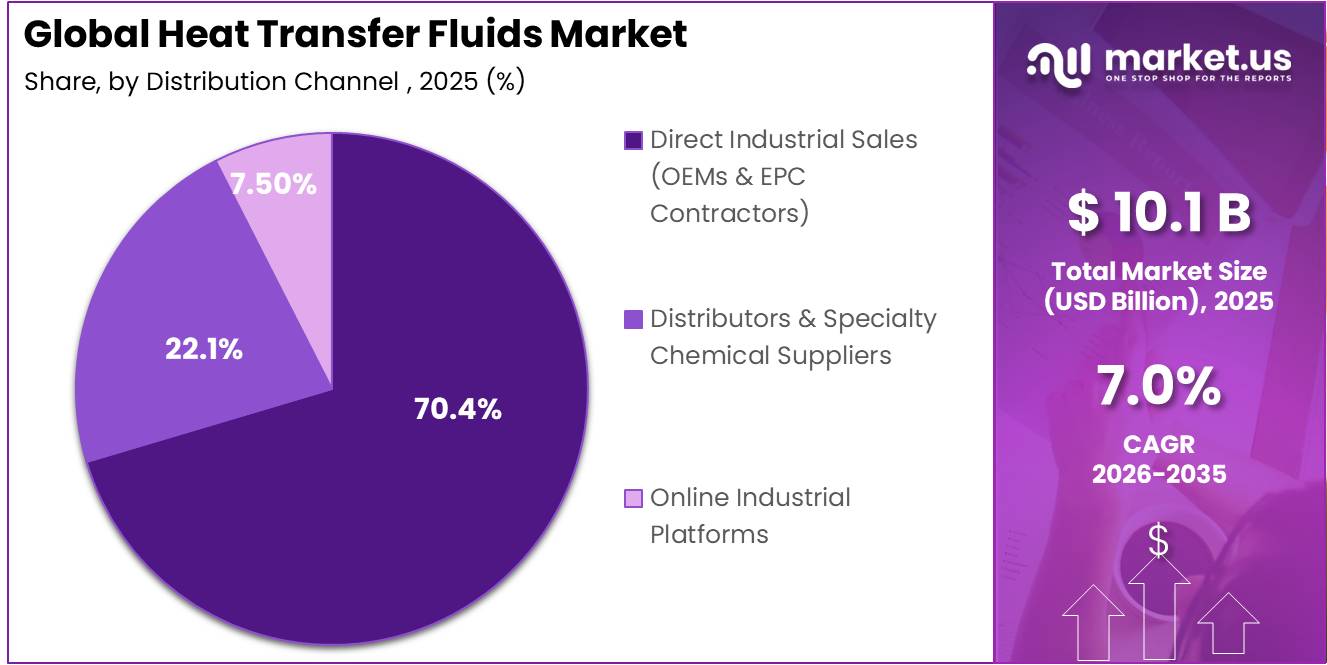
- Direct Industrial Sales (OEMs & EPC Contractors) dominated the market, comprising 70.40% of the total market share.
- Liquid Heat Transfer Fluids led the market, accounting for 92.10% of the total market share.
- In 2025, the Asia Pacific was the most dominant region in the Heat Transfer Fluids Market, accounting for 60% of the total global consumption.
The European Chemical Industry Council reported that Europe’s chemical industry generated €635 billion turnover and employed 1.2 million people, reflecting a large base of downstream fluid users. The American Chemistry Council stated in 2026 that global chemical production was expected to grow 0.5%, while plastic resins output was expected to rise 0.7%, supporting steady demand from polymer and chemical plants.
Key driving factors include process safety, energy efficiency, equipment protection, and stricter environmental rules. The United States Department of Energy stated that industrial heat accounts for about 9% of the entire United States emissions footprint, making thermal efficiency a policy and operating priority. In refrigeration and cooling, the United States Environmental Protection Agency is phasing down regulated hydrofluorocarbons to 15% of historic baseline levels by 2036, encouraging lower impact thermal management choices.
Growth opportunities are expected in electrified process heat, thermal energy storage, concentrated solar power, low carbon manufacturing, and advanced bio based fluids across large energy intensive industrial facilities worldwide today. The European Commission launched the Clean Industrial Deal on 26 February 2025 and plans to mobilise more than €100 billion for European Union made clean manufacturing. The United States Department of Energy’s Industrial Demonstrations Program also covers chemicals, refining, food and beverage, and process heat, with $6.3 billion in support for industrial decarbonisation projects.
Fluid Type Analysis
Glycol-Based Fluids dominate with 36.80% due to wide use in cooling and heating systems.
In 2025, Glycol-Based Fluids (Ethylene Glycol, Propylene Glycol) held a dominant market position, capturing more than a 36.80% share of the heat transfer fluids market by fluid type. In the June 2025 market view, this segment led because glycol-based fluids are widely used in heating, cooling, refrigeration, and industrial temperature-control systems. Their strong demand was supported by good thermal performance, freeze protection, easy availability, and suitability for different operating conditions. Industries preferred these fluids because they help maintain stable temperatures, protect equipment, and support reliable process operations across chemical, food, pharmaceutical, HVAC, and energy-related applications.
Synthetic Heat Transfer Fluids (Aromatic, Silicone-based) emerged as the fastest growing segment. Their growth was supported by rising use in high-temperature systems where longer service life, better stability, and cleaner heat transfer performance are important.
Application Analysis
Chemical Processing dominates with 33.90% due to strong use in controlled industrial heating and cooling.
In 2025, Chemical Processing held a dominant market position, capturing more than a 33.90% share of the heat transfer fluids market by application. In the June 2025 market view, this segment led because chemical plants require stable temperature control during reaction, distillation, drying, blending, and process heating operations. Heat transfer fluids are widely used in this application to maintain process safety, improve operating consistency, and protect equipment from overheating or freezing. Their demand remained strong as chemical manufacturers focused on smoother production, better energy use, and reliable thermal performance across continuous processing systems.
Oil & Gas emerged as the fastest growing segment. Its growth was supported by rising use of heat transfer fluids in upstream, midstream, and downstream operations where heating, cooling, and temperature stability are important for safe and efficient processing.
End-Use Industry Analysis
Chemicals & Petrochemicals dominate with 38.50% due to strong need for controlled process heating and cooling.
In 2025, Chemicals & Petrochemicals held a dominant market position, capturing more than a 38.50% share of the heat transfer fluids market by end-use industry. In the June 2025 market view, this segment led because chemical and petrochemical plants depend on heat transfer fluids for safe heating, cooling, reaction control, distillation, and process stability. These fluids help maintain steady operating temperatures, protect equipment, and support smooth production in demanding industrial environments. Their use remained strong as producers focused on better energy efficiency, safer handling, and reliable thermal performance across continuous processing systems.
Energy & Power Generation emerged as the fastest growing segment. Its growth was supported by rising use of heat transfer fluids in power plants, renewable energy systems, and thermal energy storage applications where stable heat movement is important.
System Type Analysis
Liquid Phase Heat Transfer Systems dominate with 62.10% due to reliable temperature control in industrial operations.
In 2025, Liquid Phase Heat Transfer Systems held a dominant market position, capturing more than a 62.10% share of the heat transfer fluids market by system type. In the June 2025 market view, this segment led because liquid phase systems are widely used for controlled heating and cooling in chemical processing, petrochemicals, food processing, pharmaceuticals, and energy applications. Industries preferred these systems because they provide steady heat movement, easier handling, better operational control, and reliable performance across continuous production environments. Their strong use was also supported by suitability for medium and high-capacity industrial processes.
Vapor Phase Heat Transfer Systems emerged as the fastest growing segment. Their growth was supported by rising demand in applications requiring fast heat transfer, uniform temperature distribution, and efficient thermal performance in specialized process systems.
Temperature Range Analysis
Low Temperature Fluids dominate with 41.20% due to strong use in cooling and temperature-sensitive systems.
In 2025, Low Temperature Fluids held a dominant market position, capturing more than a 41.20% share of the heat transfer fluids market by temperature range. In the June 2025 market view, this segment led because low temperature fluids are widely used in cooling, refrigeration, cold storage, food processing, pharmaceuticals, and heating, ventilation, air conditioning, and refrigeration systems. Industries preferred these fluids because they support stable temperature control, freeze protection, and safe operation in sensitive process environments. Their demand remained strong where equipment protection and consistent cooling performance were important.
Medium Temperature Fluids emerged as the fastest growing segment. Their growth was supported by wider use in chemical processing, oil and gas, and industrial heating systems where balanced thermal stability and flexible operating performance are required.
Function Type Analysis
Cooling Applications dominate with 48.60% due to strong use in industrial temperature control.
In 2025, Cooling Applications held a dominant market position, capturing more than a 48.60% share of the heat transfer fluids market by function type. In the June 2025 market view, this segment led because cooling applications are widely used across chemical processing, food processing, pharmaceuticals, refrigeration, and industrial systems. Heat transfer fluids help maintain stable operating temperatures, protect equipment, and prevent overheating during continuous production. Their strong demand was also supported by the need for safe cooling performance in sensitive and high-load process environments.
Heating Applications emerged as the fastest growing segment. Their growth was supported by rising use in process heating, energy systems, oil and gas operations, and manufacturing facilities where steady heat transfer and reliable thermal performance are important.
Distribution Channel Analysis
Direct Industrial Sales dominate with 70.40% due to strong industrial procurement needs.
In 2025, Direct Industrial Sales (OEMs & EPC Contractors) held a dominant market position, capturing more than a 70.40% share of the heat transfer fluids market by distribution channel. In the June 2025 market view, this segment led because large industrial users preferred direct purchasing for better product reliability, technical support, and supply continuity. Original equipment manufacturers and engineering, procurement, and construction contractors often required heat transfer fluids suited to specific system designs, operating temperatures, and safety needs. Direct sales also helped buyers manage bulk supply, pricing, and long-term project requirements more effectively.
Distributors & Specialty Chemical Suppliers emerged as the fastest growing segment. Their growth was supported by wider access to smaller buyers, quicker delivery, and flexible product availability across industrial applications.
Form Type Analysis
Liquid Heat Transfer Fluids dominate with 92.10% due to their wide use in industrial heating and cooling.
In 2025, Liquid Heat Transfer Fluids held a dominant market position, capturing more than a 92.10% share of the heat transfer fluids market by form type. In the June 2025 market view, this segment led because liquid fluids are widely used across chemical processing, oil and gas, food processing, pharmaceuticals, heating, ventilation, air conditioning, refrigeration, and energy systems. Industries preferred liquid heat transfer fluids because they offer easy circulation, stable temperature control, efficient heat movement, and better compatibility with existing industrial equipment. Their strong use also came from their ability to support both heating and cooling operations in continuous process environments.
Solid / Phase Change Materials (PCMs) emerged as the fastest growing segment. Their growth was supported by rising use in thermal energy storage and temperature-stabilizing applications where controlled heat release is important.
Key Market Segments
By Fluid Type
- Glycol-Based Fluids (Ethylene Glycol, Propylene Glycol)
- Synthetic Heat Transfer Fluids (Aromatic, Silicone-based)
- Mineral Oils
- Molten Salts
- Bio-Based Heat Transfer Fluids
By Application
- Chemical Processing
- Oil & Gas
- Concentrated Solar Power (CSP)
- Food & Beverage Processing
- Pharmaceutical Manufacturing
- HVAC & Refrigeration Systems
By End-Use Industry
- Chemicals & Petrochemicals
- Energy & Power Generation
- Food Processing Industry
- Automotive & Transportation
- Pharmaceuticals
- Plastics & Polymers
By System Type
- Liquid Phase Heat Transfer Systems
- Vapor Phase Heat Transfer Systems
- Hybrid Systems
By Temperature Range
- Low Temperature Fluids
- Medium Temperature Fluids
- High Temperature Fluids
By Function Type
- Cooling Applications
- Heating Applications
- Thermal Energy Storage
By Distribution Channel
- Direct Industrial Sales (OEMs & EPC Contractors)
- Distributors & Specialty Chemical Suppliers
- Online Industrial Platforms
Form Type
- Liquid Heat Transfer Fluids
- Solid / Phase Change Materials (PCMs)
Driver Analysis
CSP molten-salt buildout and storage retrofits
The U.S. EIA notes that advanced power-tower designs are experimenting with molten nitrate salt because of stronger heat-transfer and energy-storage performance, while DOE program material shows Gen3 pathways targeting operating temperatures above 700°C and chloride-salt concepts in roughly the 500°C to 735°C range, materially above traditional organic HTF envelopes.
That temperature step-up expands value per installed thermal block through larger fluid inventory, tighter corrosion-control requirements, specialized seals/valves, and more frequent engineering support, which lifts the revenue pool beyond simple volume sales. The CAGR effect is most visible from 2026 to 2030 in North America, Southern Europe, MENA, and China-linked EPC corridors because those markets combine dispatchable-renewable policy support with arid-grid use cases where thermal storage remains commercially relevant.
Drivers Impact Analysis
| Driver | (~) % Impact on CAGR Forecast | Geographic Relevance | Impact Timeline |
|---|---|---|---|
| CSP molten-salt buildout and storage retrofits | +1.4% | North America core, MENA, Southern EU, China-linked APAC corridors | Medium term (2-4 years) |
| Industrial decarbonization and higher-temperature process heat | +1.2% | EU core, North America, Japan, Korea, China industrial belts | Medium term (2-4 years) |
| PFAS and chemical reporting pressure shifting fluid selection | +0.8% | North America core, EU, high-compliance export hubs in APAC | Short term (≤ 2 years) |
| EU BAT and emissions-efficiency compliance upgrades | +0.9% | EU core, UK spill-over, export-oriented EMEA plants | Short term (≤ 2 years) |
| Oil-linked input cost normalization improving replacement economics | +0.7% | North America, LATAM importers, Middle East process industries, APAC | Short term (≤ 2 years) |
| Solar thermal and thermal-storage integration beyond power generation | +1.0% | China, India, Southern EU, Middle East, selective U.S. industry clusters | Long term (≥ 4 years) |
Restraint Analysis
PFAS compliance burden
The sharpest regulatory restraint sits in fluorinated and specialty heat-transfer fluid chemistries exposed to the EU’s widening PFAS control architecture, because the European Commission states that national authorities have already submitted a request to restrict all PFAS under REACH, Member States have had to monitor PFAS in drinking water since January 2026, stricter industrial emissions reporting for PFOA and PFHxS begins from 2028, and food-contact packaging PFAS limits start from August 2026, all of which collectively raise compliance screening, reformulation, documentation, and customer qualification costs across lubricant and thermal-fluid value chains.
For producers selling into Europe, that means additional raw-material traceability, expanded analytical testing, dual-SKU management, and elevated substitution risk for fluorinated performance additives, which can plausibly add 150 to 350 basis points to SG&A and technical service cost for affected product lines, extend reformulation cycles by 6 to 18 months, and depress customer requalification throughput by 20% to 30% where process validation is stringent.
Restraint Impact Analysis
| Restraint | (~) % Impact on CAGR Forecast | Geographic Relevance | Impact Timeline |
|---|---|---|---|
| PFAS compliance burden | -1.4% | EU core, UK-linked supply chains, export-oriented APAC | Medium term (2-4 years) |
| Feedstock cost volatility | -1.1% | North America core, EU, Northeast Asia | Short term (≤ 2 years) |
| Industrial CapEx deferrals | -0.9% | EU manufacturing belt, North America process industries | Short term (≤ 2 years) |
| Waste handling escalation | -0.8% | EU core, North America regulated states, Japan | Medium term (2-4 years) |
| Energy-efficiency redesign shift | -0.7% | North America HVAC/process heat, EU thermal systems | Medium term (2-4 years) |
| Emissions and water monitoring overhead | -0.6% | EU core, advanced OECD industrial corridors | Long term (≥ 4 years) |
Opportunity Analysis
Industrial TES fluids
This is an opportunity rather than a current driver because the baseline market already reflects routine demand from existing chemical processing, CSP, and closed-loop thermal systems, whereas the upside comes from monetizing a newer layer of industrial thermal energy storage projects being pulled forward by decarbonization programs and process-electrification economics.
DOE’s Industrial Heat Shot explicitly targets cost-competitive industrial heat solutions with at least 85% lower greenhouse gas emissions by 2035 and identifies electrification, thermal storage, and low-emissions heat integration as priority pathways, while EIA shows U.S. industrial natural gas use already reached a record 23.6 Bcf/d in 2025, signaling a very large incumbent heat load that can be partially displaced or buffered by storage-enabled thermal systems.
For fluid suppliers, the white space is not selling standard fluid volumes into existing loops, but designing high-cycle formulations for charge-discharge duty, bundling degradation analytics, and targeting brownfield retrofits in the roughly 150–400°C band where storage economics can reduce peak fuel and power exposure; a realistic commercialization case is that storage-linked deployments could lift supplier revenue growth by roughly 2.4 percentage points above baseline if even 3%–5% of addressable medium-temperature industrial sites convert to fluid-based TES architectures by the early 2030s, with EBITDA margins expanding about 150–300 basis points through higher-value service contracts, lower churn, and replacement intervals priced on throughput instead of liters sold.
Opportunity Impact Analysis
| Opportunity | (~) % Potential CAGR Upside | Geographic Relevance | Execution Window |
|---|---|---|---|
| Industrial TES fluids | +2.4% | North America core, EU, GCC, India | Short term (≤ 2 years) |
| Geothermal district loops | +1.9% | North America, Nordics, EU, China | Medium term (2-4 years) |
| PFAS-free retrofit cycle | +1.3% | U.S., EU, Japan, South Korea | Short term (≤ 2 years) |
| CSP-to-process heat media | +1.7% | U.S. Southwest, MENA, India, Australia | Medium term (2-4 years) |
| HTF-as-a-service | +1.1% | North America, EU, APAC industrial hubs | Short term (≤ 2 years) |
| Nuclear microheat fluids | +0.9% | U.S., Canada, UK, Eastern Europe | Long term (≥ 4 years) |
Challenges Analysis
Skilled thermal systems talent gap
Energy and industrial statistics show that chemicals, petroleum, and primary metals segments jointly account for most manufacturing energy consumption, implying a large installed base of heat‑dependent processes; yet the number of professionals with deep expertise in thermodynamics, fluid mechanics, process safety, and digital monitoring remains significantly below the level required to systematically upgrade and expand these systems.
In practical terms, a typical large plant might need 10–20 specialized thermal systems professionals to manage HTF selection, system design, monitoring, and failure analysis across dozens of circuits, but often operates with only 4–8 such experts, resulting in project delays of 6–12 months for retrofits, conservative adoption of novel HTF chemistries, and suboptimal operating envelopes that leave 5–10% efficiency and capacity gains untapped.
Across regions such as Europe, North America, and advanced APAC economies, retirement of experienced engineers and competition from other sectors (renewables, digital tech, battery systems) further deepen the gap: vacancy durations for specialized thermal roles can extend to 6–9 months, and average workloads per remaining engineer increase by 20–40%, pushing companies to limit the number of concurrent HTF‑intensive projects they undertake annually.
This systemic talent friction likely subtracts around 1.0 percentage point from the market’s unconstrained CAGR by slowing system modernization and reducing the rate at which high‑value HTF applications scale. Strategic mitigation involves multi‑year investment in training pipelines, partnerships with universities, and internal cross‑training programs aiming to increase the number of qualified thermal specialists per plant by 30–50% over 4–6 years, but the inherently long lead times of education and skill development mean that this will remain a long‑term drag well beyond the current planning cycle.
Challenges Impact Analysis
| Challenge | (~) % CAGR Friction Drag | Geographic Relevance | Mitigation Horizon |
|---|---|---|---|
| Volatile base oil input costs | -1.2% | North America, Europe, APAC refining hubs | Medium term (2-4 years) |
| Thermal stability & lifecycle uncertainty | -0.9% | Global industrial clusters | Long term (≥ 4 years) |
| Regulatory compliance & reporting load | -0.8% | EU regulatory hubs, North America core | Medium term (2-4 years) |
| Skilled thermal systems talent gap | -1.0% | EU, North America, high-tech APAC | Long term (≥ 4 years) |
| Supply chain logistics & transit risk | -0.7% | APAC–EU–US trade corridors | Short term (≤ 2 years) |
| End-user fluid monitoring underinvestment | -0.6% | Global mid-size industrial users | Medium term (2-4 years) |
Geopolitical Impact Analysis
Feedstock Security and Energy Policy Shifts Are Reshaping the Heat Transfer Fluids Market
The heat transfer fluids market is becoming more sensitive to geopolitical changes because glycol-based fluids, synthetic aromatic fluids, silicone-based fluids, mineral oils, and molten salts depend on stable energy, petrochemical, and industrial raw material supply. The International Energy Agency stated that oil markets are facing uncertainty due to rising geopolitical strains and trade tensions, while global oil demand is expected to increase by 2.5 million barrels per day between 2024 and 2030. This affects heat transfer fluid producers because petrochemical feedstocks and base oils influence production cost, availability, and long-term supply planning.
Petrochemical-linked demand is another important pressure point. The International Energy Agency reported that in 2026, petrochemical feedstocks will dominate oil demand growth, with their share rising to more than 60% from 40% in 2025. For heat transfer fluids, this matters because several product types are connected to petrochemical intermediates, refined oils, and specialty additives. Any disruption in oil trade, sanctions, freight movement, or refining margins can therefore affect pricing and procurement cycles.
- The European Commission’s Clean Industrial Deal, launched on 26 February 2025, focuses on energy-intensive sectors including chemicals, while the United States Department of Energy aims for industrial heat technologies with at least 85% lower greenhouse gas emissions by 2035. As a result, heat transfer fluid suppliers are expected to focus on cleaner formulations, longer fluid life, energy-efficient systems, and stronger regional supply networks.
Regional Analysis
Asia-Pacific leads with 44.60% share, valued at USD 4.52 billion, supported by strong industrial heating and cooling demand.
In 2025, Asia-Pacific held a dominant market position in the heat transfer fluids market, capturing more than a 44.60% share and reaching a value of USD 4.52 billion. In the June 2025 market view, the region led due to strong demand from chemicals and petrochemicals, energy and power generation, food processing, pharmaceuticals, and industrial manufacturing. Heat transfer fluids were widely used across the region for controlled heating, cooling, process stability, and equipment protection.
The presence of large-scale chemical plants, refining units, power facilities, and manufacturing clusters supported steady consumption. Asia-Pacific also benefited from growing use of liquid heat transfer fluids, glycol-based fluids, and thermal systems in continuous process operations. As industries focused on safer temperature control and better operating efficiency, the region maintained a strong position in the global market.
Key Regions and Countries Covered
- North America
- The US
- Canada
- Europe
- Germany
- France
- The UK
- Spain
- Italy
- Russia & CIS
- Rest of Europe
- APAC
- China
- Japan
- South Korea
- India
- ASEAN
- Rest of APAC
- Latin America
- Brazil
- Mexico
- Rest of Latin America
- Middle East & Africa
- GCC
- South Africa
- Rest of MEA
Key Players Analysis
Heat transfer fluid manufacturers focus on strengthening product performance, thermal stability, safety profile, and application-specific formulation to maintain competitiveness. A key priority is continuous innovation in glycol-based fluids, synthetic heat transfer fluids, mineral oils, molten salts, bio-based fluids, and liquid heat transfer systems that improve heating, cooling, temperature control, and equipment protection.
Competitive positioning in the heat transfer fluids market is shaped by technical service, long-term industrial supply contracts, product customization, and distribution strength. Direct industrial sales remain important because original equipment manufacturers and engineering, procurement, and construction contractors often require fluids designed for specific system types, temperature conditions, and operational safety needs.
Market Key Players
- Dow Inc.
- Eastman Chemical Company
- ExxonMobil Corporation
- Shell plc
- BASF SE
- Chevron Corporation
- Clariant AG
- Solutia Inc. (Eastman subsidiary)
- Paratherm Corporation
- Dynalene Inc.
- Therminol (Eastman brand)
- Global Heat Transfer Ltd.
- Relatherm (Radco Industries)
- Hindustan Petroleum Corporation Limited (HPCL)
- Indian Oil Corporation Limited (IOCL)
- Coveris Holdings S.A.
- Pregis LLC
- Uline, Inc.
Key Development
- In November 2025, Dow expanded its thermal-management research capabilities by opening its first Cooling Science Studio in Shanghai, built around 3 core modules covering testing, application demonstrations and technical support.
- In 2025, Eastman continued to strengthen product development around Therminol and Marlotherm fluids, which serve more than 15,000 system operators worldwide and cover operating temperatures from -115°C to 400°C. Its portfolio includes Therminol 66 for temperatures up to 345°C and Therminol VP-1 for applications reaching 400°C, supporting chemicals, oil and gas, solar power and food processing.
- In May 2026, Clariant AG listed Antifrogen LC25 PG as a low-conductivity heat transfer fluid tailored for data center and direct-to-chip cooling. The product was positioned for sensitive cooling systems where reliable thermal performance and corrosion protection are important.
Report Scope
| Report Features | Description |
|---|---|
| Market Value (2025) | USD 10.1 Bn |
| Forecast Revenue (2035) | USD 19.8 Bn |
| CAGR (2026-2035) | 7.0% |
| Base Year for Estimation | 2025 |
| Historic Period | 2020-2024 |
| Forecast Period | 2026-2035 |
| Report Coverage | Revenue Forecast, Market Dynamics, Competitive Landscape, Recent Developments |
| Segments Covered | By Fluid Type (Glycol-Based Fluids, Synthetic Heat Transfer Fluids, Mineral Oils, Molten Salts, and Bio-Based Heat Transfer Fluids), By Application (Chemical Processing, Oil & Gas, Concentrated Solar Power, Food & Beverage Processing, Pharmaceutical Manufacturing, and HVAC & Refrigeration Systems), By End-Use Industry (Chemicals & Petrochemicals, Energy & Power Generation, Food Processing Industry, Automotive & Transportation, Pharmaceuticals, and Plastics & Polymers), By System Type (Liquid Phase Heat Transfer Systems, Vapor Phase Heat Transfer Systems, and Hybrid Systems), By Temperature Range (Low Temperature Fluids, Medium Temperature Fluids, and High Temperature Fluids), By Function Type (Cooling Applications, Heating Applications, and Thermal Energy Storage), By Distribution Channel (Direct Industrial Sales, Distributors & Specialty Chemical Suppliers, and Online Industrial Platforms), By Form Type (Liquid Heat Transfer Fluids and Solid / Phase Change Materials |
| Regional Analysis | North America – The US & Canada; Europe – Germany, France, The UK, Spain, Italy, Russia & CIS, Rest of Europe; APAC– China, Japan, South Korea, India, ASEAN & Rest of APAC; Latin America– Brazil, Mexico & Rest of Latin America; Middle East & Africa– GCC, South Africa, & Rest of MEA |
| Competitive Landscape | Dow Inc., Eastman Chemical Company, ExxonMobil Corporation, Shell plc, BASF SE, Chevron Corporation, Clariant AG, Solutia Inc. (Eastman subsidiary), Paratherm Corporation, Dynalene Inc., Therminol (Eastman brand), Global Heat Transfer Ltd., Relatherm (Radco Industries), Hindustan Petroleum Corporation Limited (HPCL), Indian Oil Corporation Limited (IOCL), Coveris Holdings S.A., Pregis LLC, and Uline, Inc. |
| Customization Scope | Customization for segments, region/country-level will be provided. Moreover, additional customization can be done based on the requirements. |
| Purchase Options | We have three licenses to opt for: Single User License, Multi-User License (Up to 5 Users), Corporate Use License (Unlimited Users and Printable PDF) |





































