
Quick Navigation
Report Overview
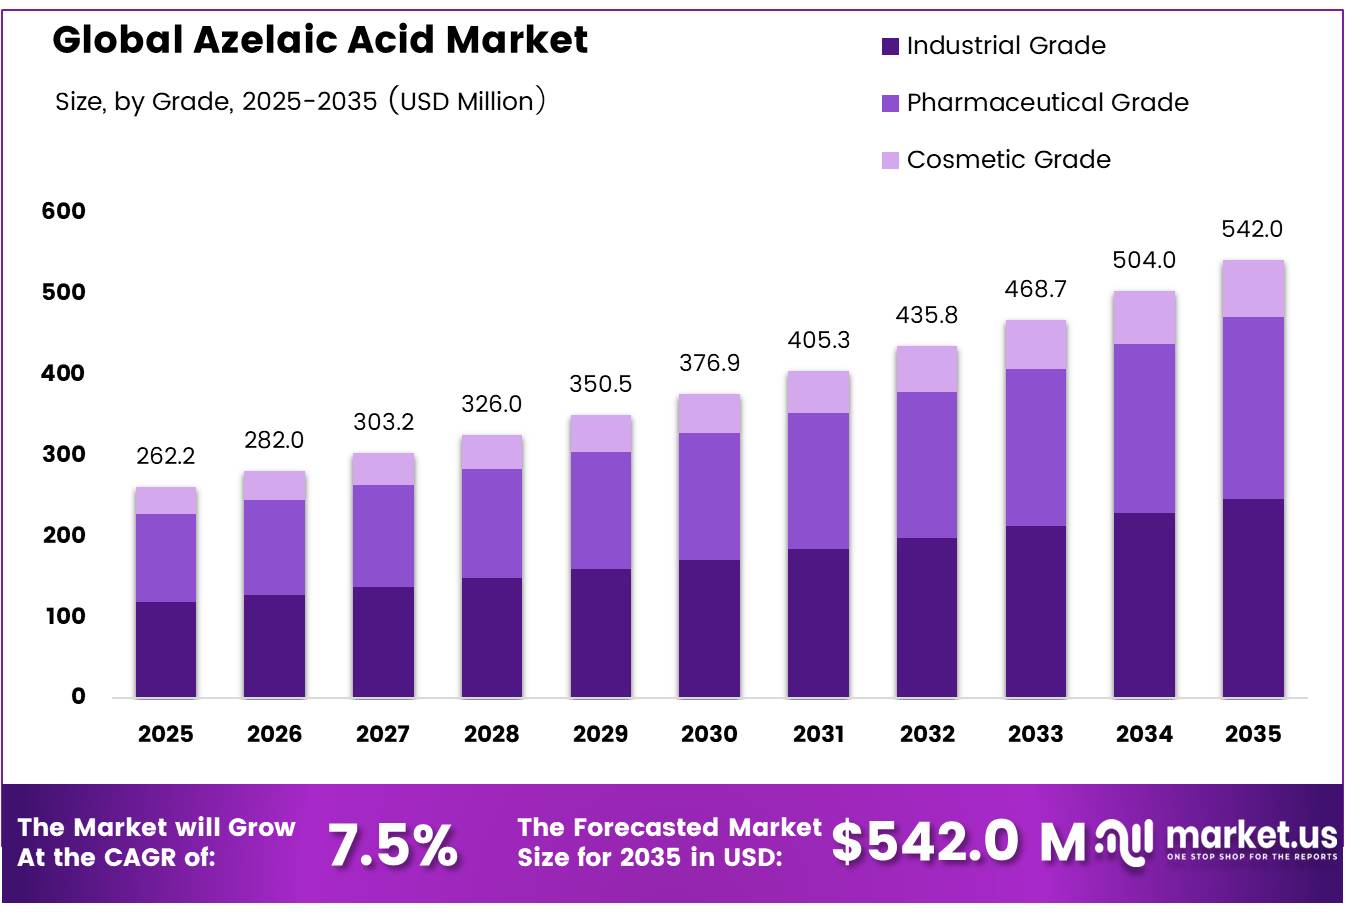
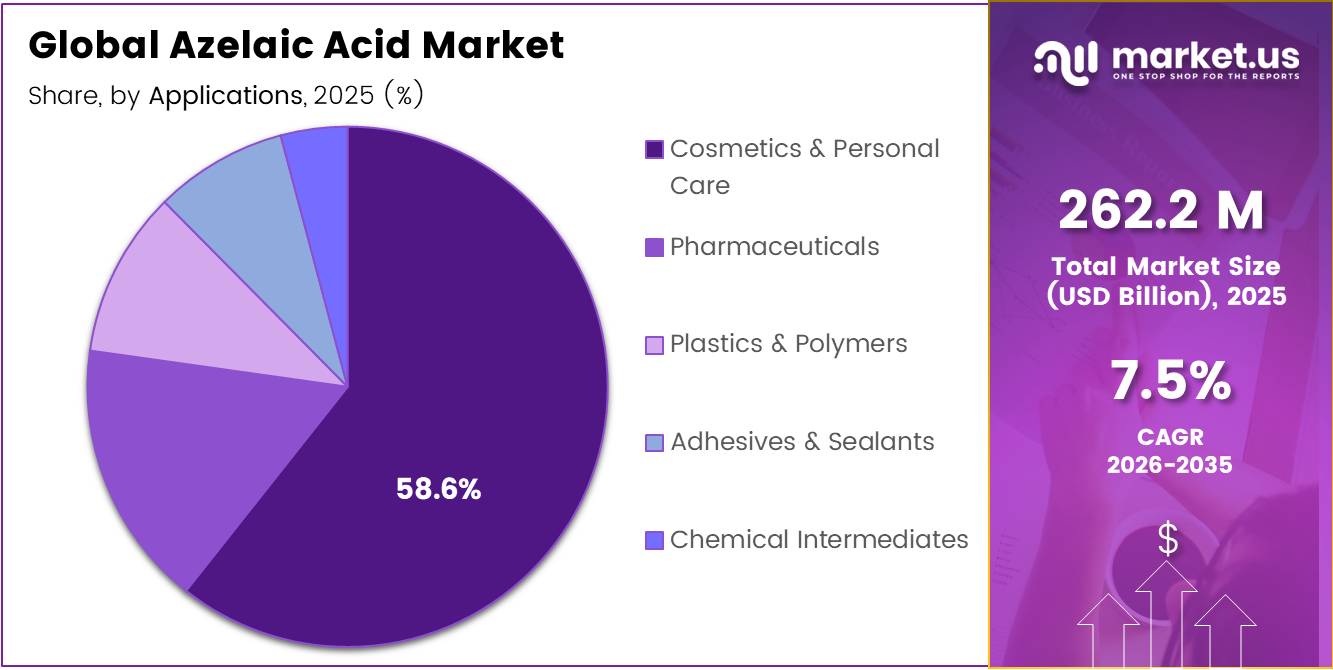
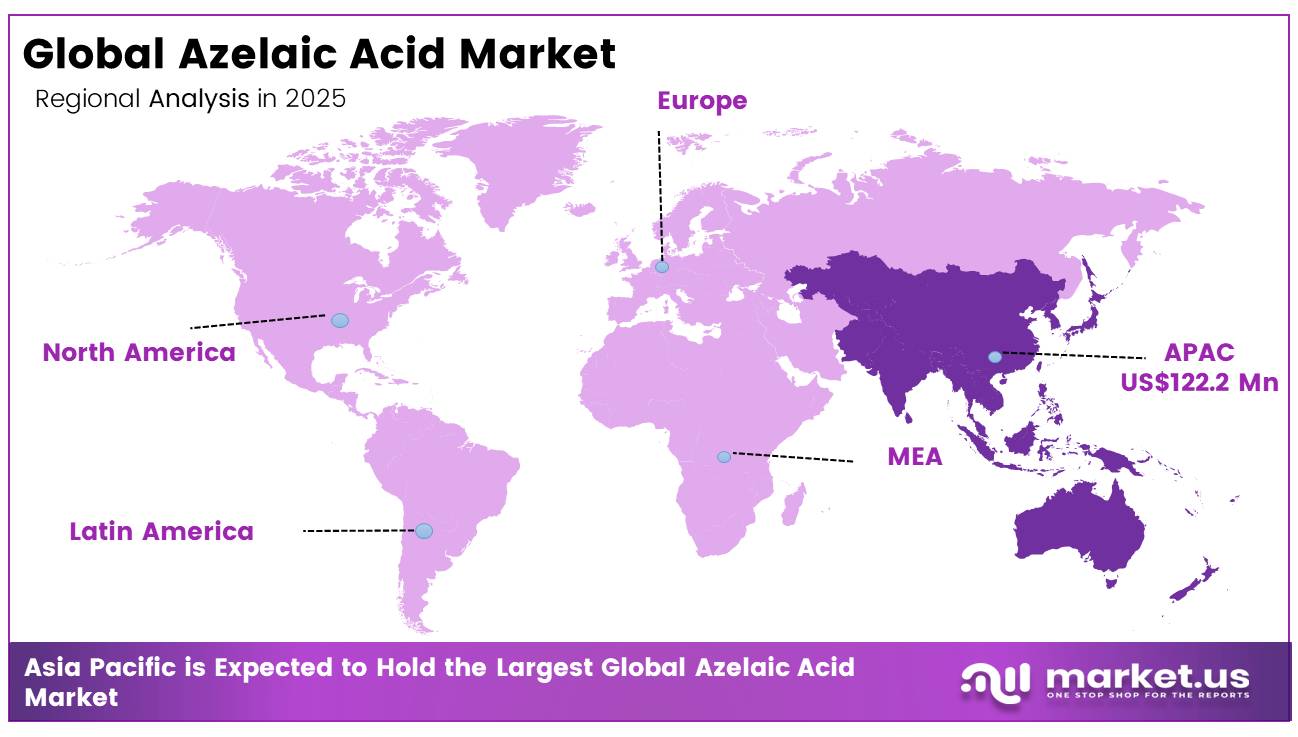
In 2025, the Global Azelaic Acid Market was valued at USD 262.2 million, and between 2025 and 2035, this market is estimated to register a CAGR of 7.5%, reaching about USD 542.0 million by 2035. In 2025, Asia Pacific held a dominant market position, capturing more than a 46.6% share, holding USD 122.1 million in revenue.
Azelaic acid is a nine-carbon saturated dicarboxylic acid, with the molecular formula C9H16O4, used in pharmaceuticals, cosmetics, polymers, plasticizers, lubricants and corrosion-control formulations. Pharmaceutical and personal-care demand remains a central growth driver. The U.S. DailyMed label, updated on August 22, 2025, confirms a 15% azelaic acid gel for mild-to-moderate rosacea.
Two 12-week trials covering 664 participants recorded lesion reductions of 57.9% and 50.0%, versus 39.9% and 38.2% for the vehicle. Cosmetics Europe’s 2025 data valued European cosmetics and personal-care retail sales at €110 billion, including €32.3 billion from skin care, supporting a broad formulation base.
Future opportunities are emerging in bio-based polyesters, specialty greases, low-temperature plasticizers and sustainable personal-care ingredients. On April 23, 2026, Circular Bio-based Europe opened a €170.7 million funding call across 13 topics, including €20 million for bio-based home and personal-care solutions. Such programmes can reduce scale-up risk and support renewable-feedstock chemical production. They also encourage purification, circular processing, pilot plants and commercial manufacturing investment.
Key Takeaways
- The global Azelaic Acid Market was valued at USD 262.2 million in 2025.
- The Market is projected to grow at a CAGR of 7.5% and is estimated to reach USD 542.0 million by 2035.
- On the basis of Product Type, Synthetic Azelaic Acid dominated the market, constituting 87.8% of the total market share.
- Based on the Grade, Industrial Grade dominated the Azelaic Acid Market, with a substantial market share of around 45.6%.
- Based on the Application, Cosmetics & Personal Care led the market, comprising 58.6% of the total market.
- In 2025, the Asia Pacific was the most dominant region in the Azelaic Acid Market, accounting for 46.6% of the total global consumption.
Azelaic Acid Market Segments
Product Type Analysis
Synthetic Azelaic Acid represents dominant Segment in the Market.
Synthetic azelaic acid commands an 87.8% share because it is the only production pathway delivering the volume, consistency, and cost efficiency that industrial-scale pharmaceutical, polymer, and personal care manufacturing demands. Its scalability has earned broad regulatory acceptance across major jurisdictions, the European Chemicals Agency listed azelaic acid as an authorized monomer under EU Plastics Food Contact Regulation 10/2011/EU, amended by Regulation (EU) 2024/3190 on 31 December 2024, directly validating its role in industrial polymer manufacturing.
Simultaneously, EU Commission Regulation 1223/2009 permits its unrestricted cosmetic use across all member states, eliminating additional approval burdens for manufacturers and cementing synthetic azelaic acid as the commercially preferred grade across both industrial and personal care segments
Natural azelaic acid is gaining ground as sustainability mandates reshape ingredient sourcing. Its renewable origin aligns with tightening government policy: China’s NMPA Announcement No. 45, dated October 30, 2024, introduced a dedicated cosmetic testing standard for azelaic acid and its salts, effective July 1, 2025, formally validating naturally derived variants for the first time. The EU’s “Safe and Sustainable by Design” framework, reviewed by environment ministers in October 2024, further widens its commercial pathway across European markets.
Grade Analysis
Industrial-grade a significant grade.
Industrial Grade holds the largest share at 45.6% of the global azelaic acid market, and its dominance comes down to one fundamental reality: it feeds industries that never stop growing. As a key precursor for polyamide 6, 9 production, plasticizers, lubricants, and specialty coatings, industrial-grade azelaic acid is deeply embedded in manufacturing value chains across automotive, packaging, and electronics sectors.
The EU’s REACH regulation and its Chemicals Strategy for Sustainability reinforced through 2024–2025 amendments are actively incentivizing biodegradable polymers and bio-based feedstocks over petrochemical alternatives, effectively redirecting industrial procurement toward azelaic acid-derived materials. Europe alone accounted for approximately 35% of global bio-based azelaic acid demand as of 2024, driven precisely by these regulatory mandates compelling manufacturers to reformulate with greener chemical building blocks.
Pharmaceutical Grade commands is closing the gap steadily. Its growth is anchored in rising global prevalence of chronic dermatological conditions a 2024 worldwide study across 50,552 individuals in 20 countries found acne affecting 20.5% of the global population, sustaining consistent prescription-level demand. Growing clinical adoption in combination therapies for moderate-to-severe cases, alongside expanding government-backed dermatology access programs in emerging markets through 2025–2026, is steadily broadening its therapeutic and commercial footprint.
Application Analysis
Cosmetics & Personal Care Are the Most Widely Used Applicants
Cosmetics & Personal Care commands 58.6% of the global azelaic acid market because it sits at the intersection of two powerful forces: tightening regulation and rising consumer demand for clean-label actives. EU Cosmetic Regulation (EC) No 1223/2009 amended in March 2024 via Regulation (EU) 2024/858 and May 2025 via Regulation (EU) 2025/877 has progressively banned synthetic alternatives like hydroquinone, effectively narrowing formulator choices and elevating azelaic acid as a compliant, naturally derived replacement.
Its multifunctional efficacy across acne, rosacea, hyperpigmentation, and uneven skin tone means a single ingredient serves multiple product lines a commercial efficiency that cements its irreplaceable position across premium skincare portfolios globally.
Pharmaceuticals is growing fastest because azelaic acid is one of the very few dermatological actives carrying dual FDA approval 20% cream for acne (1995) and 15% gel for rosacea (2002) giving it prescription-level credibility no over-the-counter competitor easily replicates. This regulatory head start, combined with its growing use in combination therapies for moderate-to-severe cases, means demand is being pulled from both clinical and consumer directions simultaneously through 2024–2026.
Key Market Segments
By Product Type
- Natural Azelaic Acid
- Synthetic Azelaic Acid
By Grade
- Pharmaceutical Grade
- Cosmetic Grade
- Industrial Grade
By Application
- Pharmaceuticals
- Acne Treatment
- Rosacea Treatment
- Others
- Cosmetics & Personal Care
- Skincare Creams
- Serums
- Anti-aging Products
- Others
- Plastics & Polymers
- Lubricants
- Plasticizers
- Polyesters
- Others
- Adhesives & Sealants
- Chemical Intermediates
- Others
Driver Analysis
OTC dermocosmetic expansion for pigmentation and sensitive-skin regimens
A second growth engine is azelaic acid’s widening role in non-prescription skincare, especially for hyperpigmentation, post-inflammatory marks, and sensitive-skin acne routines where consumers want efficacy without the irritation profile associated with stronger acids or retinoids. Safety reviews cited in current technical summaries indicate low systemic absorption, commonly under 4% of applied dose, and support the use of azelaic acid in leave-on cosmetic products at concentrations up to 10%, which creates a clear bridge between prescription dermatology and cosmeceutical positioning.
That bridge is commercially important because it enables brands to launch 8%–10% serums, creams, and booster products that sit in the premium “active skincare” segment rather than the lower-margin commodity cleanser segment. The demand effect is amplified in pigmentation-focused markets such as the U.S., Western Europe, Japan, South Korea, China’s tier-1 cities, and GCC countries, where uneven skin tone and acne marks are major purchase triggers and where hybrid pharmacy-beauty retail formats are expanding.
Drivers Impact Analysis
| Driver | (~) % Impact on CAGR Forecast | Geographic Relevance | Impact Timeline |
|---|---|---|---|
| Acne and rosacea protocol adoption lifting dermatology throughput | +2.2% | North America core, EU core, urban APAC | Short term (≤ 2 years) |
| OTC dermocosmetic expansion for pigmentation and sensitive-skin regimens | +1.8% | North America, Western Europe, Japan, South Korea, China tier-1 cities, GCC | Short term (≤ 2 years) |
| Prestige and mass beauty channel growth improving azelaic-acid product velocity | +1.4% | U.S., EU-5, South Korea, Japan, China coastal metros | Medium term (2-4 years) |
| Bio-based oleic-acid process innovation improving cost and ESG positioning | +1.6% | Europe manufacturing hubs, U.S., China, India | Medium term (2-4 years) |
| Multi-indication formulation value from acne, rosacea, melasma, and PIH | +1.9% | Global, strongest in multicultural dermatology markets | Medium term (2-4 years) |
| Prescription-to-hybrid channel migration supporting premiumized repeat use | +1.3% | U.S., EU, Brazil, Southeast Asia private dermatology corridors | Long term (≥ 4 years) |
Restraint Analysis
Irritation and adherence limits
Even though azelaic acid is generally well tolerated, its clinical and OTC conversion is still constrained by local irritation, dryness, stinging, and adherence drop-off, especially in multi-step regimens where consumers compare it against simpler moisturizers or fast-acting spot treatments. The FDA label for Finacea Foam reports application-site pain in 6.2% of treated subjects, pruritus in 2.5%, and dryness and erythema each at 0.7%, while also warning about hypopigmentation monitoring, ocular irritation, flammability, and the need to reassess if no improvement is seen after 12 weeks.
12-week efficacy window is commercially less forgiving than rapid-cue beauty products because churn risk rises if visible improvement is delayed, particularly in self-directed OTC channels where consumers switch products quickly after early irritation or limited short-term benefit. This does not eliminate demand, but it does reduce repeat-purchase velocity, increase return and complaint rates, and force brands to spend more on calming excipients, consumer education, and dermatologist validation, which lowers contribution margin per SKU and restrains category penetration outside medically supervised channels.
Restraint Impact Analysis
| Restraint | (~) % Impact on CAGR Forecast | Geographic Relevance | Impact Timeline |
|---|---|---|---|
| Oleic feedstock volatility | -1.7% | APAC supply base, EU, U.S. | Short term (≤ 2 years) |
| Energy and specialty-chemical cost inflation | -1.4% | Europe core, U.K., high-cost North America | Medium term (2-4 years) |
| Cosmetic-drug compliance split | -1.5% | EU, U.S., U.K., Japan, South Korea | Short term (≤ 2 years) |
| Irritation and adherence limits | -1.1% | Global, strongest in OTC channels | Short term (≤ 2 years) |
| Concentration ceiling in cosmetics | -1.3% | EU core, U.K., developed APAC | Medium term (2-4 years) |
| Scale and channel fragmentation | -1.2% | Latin America, MEA, Southeast Asia, smaller EU markets | Long term (≥ 4 years) |
Opportunity Analysis
PIH and skin-of-color platforms
Reviews and practice references continue to position azelaic acid as effective for PIH and pigment modulation, and one cited 16-week study of azelaic acid gel 15% reported statistically significant PIH improvement with more than 50% of participants showing no PIH by study end, which creates a credible basis for indication-adjacent product expansion.
The white space lies in building complete regimens—cleanser, treatment serum, barrier cream, sunscreen—around acne-mark correction for higher-melanin consumers, where basket size can rise from a single $18–$30 treatment SKU to a $55–$95 regimen and retention can extend from 8–10 weeks to 4–6 months if dark-spot maintenance is positioned correctly. For companies that localize shade-inclusive education and dermatologist endorsement in the U.S., Brazil, GCC, India, and Southeast Asia, customer acquisition cost can be spread across a broader regimen architecture and gross margin can improve by 400–700 basis points versus single-SKU treatment models, making this a clear uncaptured TAM expansion rather than a baseline demand factor.
Opportunity Impact Analysis
| Opportunity | (~) % Potential CAGR Upside | Geographic Relevance | Execution Window |
|---|---|---|---|
| PIH and skin-of-color platforms | +2.4% | U.S., Brazil, GCC, South Africa, India, Southeast Asia | Short term (≤ 2 years) |
| Rx-to-OTC ladder portfolios | +1.9% | North America core, EU, Japan, South Korea | Medium term (2-4 years) |
| Bio-based premium ingredient tier | +1.6% | EU, U.S., Japan, premium APAC | Medium term (2-4 years) |
| Online derm-subscription model | +1.7% | U.S., U.K., Germany, urban India, Australia | Short term (≤ 2 years) |
| Adjacent industrial grade expansion | +1.3% | China, EU manufacturing hubs, U.S. | Long term (≥ 4 years) |
| Roll-up of niche dermocosmetic brands | +1.5% | North America, Western Europe, South Korea | Medium term (2-4 years) |
Challenges Analysis
Freight route instability
The market also faces a logistics challenge because azelaic acid and its intermediates move through the same disrupted chemical freight networks that have been stressed by Red Sea insecurity, longer Asia-Europe detours, and reduced vessel availability. Chemistry World reported that Red Sea disruption created a “mini Covid” effect for chemicals trade between Asia and Europe by forcing ships around the Cape of Good Hope and reducing effective shipping capacity, while 2025 logistics updates estimated average transit-time increases of about 14 days, freight-cost inflation of 20%–30%, and insurance premium increases of 50% on affected routes.
For a relatively niche specialty chemical like azelaic acid, which does not always justify priority freight allocation, this produces delayed raw-material arrivals, longer replenishment cycles for cosmetic brands, and higher safety-stock requirements that can add 15–25 days of buffer inventory and pressure cash conversion. The challenge is ongoing rather than restraining because goods can still move, but producers and buyers must continuously redesign routing, dual-source inventory, and contract terms to prevent episodic freight shocks from eroding service levels and gross margin.
Challenges Impact Analysis
| Challenge | (~) % CAGR Friction Drag | Geographic Relevance | Mitigation Horizon |
|---|---|---|---|
| Purification energy burden | -1.2% | EU manufacturing hubs, U.S., China | Medium term (2-4 years) |
| Conversion yield variability | -1.0% | Global production base | Medium term (2-4 years) |
| Hazard-process management | -0.9% | EU, U.S., India, China | Long term (≥ 4 years) |
| Freight route instability | -0.8% | Europe-Asia corridors, India, Turkey | Short term (≤ 2 years) |
| Dermatology access gaps | -0.9% | U.S., Latin America, MEA, emerging APAC | Long term (≥ 4 years) |
| Grade and claim fragmentation | -0.7% | North America, EU, Japan, South Korea | Medium term (2-4 years) |
Geopolitical Impact Analysis
Geopolitical Realignment and Supply Chain Fragmentation Reshaping Azelaic Acid Manufacturing.
The current Russia-Ukraine war has resulted in the disruption of the global supply chains involving oleo chemical products including synthetic azelaic acid production. According to government statistics provided by the United States Bureau of the Census and international organizations such as UN Comtrade, the current disruptions in the sea-trade between Eastern countries through Black Sea channels have reduced the availability of sunflower and other vegetable oils essential in the production of oleic acid for the manufacturing of azelaic acid.
The supply restrictions have increased the level of cost fluctuations. According to the producer price index provided by the U.S. Bureau of Labor Statistics, the rising energy prices and high feedstock prices, due to the conflict, have created upward pressures on the prices of the derivatives including azelaic acid.
Regional Analysis
Asia Pacific Held the Largest Share of the Azelaic Acid Market.
Asia Pacific commands 46.6% of the global azelaic acid market nearly double its nearest rival and the structural reasons are difficult to ignore. The region is home to the world’s two largest pharmaceutical manufacturing ecosystems: India, the third-largest producer of medicines by volume globally supplying nearly one-fifth of the world’s generic medicines, and China, whose pharmaceutical manufacturing industry employs approximately 716,920 people as of 2025.
North America remains the most commercially mature market. The U.S. accounts for 22% of FDA-registered API manufacturing sites globally as of 2025, underpinning consistent pharmaceutical-grade azelaic acid demand, while growing consumer preference for dermatologist-recommended skincare continues driving premium formulation uptake across the region.
Key Regions and Countries Covered
- North America
- The US
- Canada
- Europe
- Germany
- France
- The UK
- Spain
- Italy
- Russia & CIS
- Rest of Europe
- APAC
- China
- Japan
- South Korea
- India
- ASEAN
- Rest of APAC
- Latin America
- Brazil
- Mexico
- Rest of Latin America
- Middle East & Africa
- GCC
- South Africa
- Rest of MEA
Key Players Analysis
The azelaic acid market participants place great emphasis on enhancing production grade differentiation, supply chain resilience, and regulatory compliance positioning to remain competitive within an ever-changing international marketplace. One of the critical strategic areas for investment remains in the development of bio-based production technologies, which include the latest advances in enzymatic synthesis routes, high-purity pharmaceutical-grade processing, and sustainable feedstock sourcing in order to increase yield efficiency and decrease dependency on petrochemical-derived inputs.
The vertical integration strategy adopted by leading producers into specialty oleochemical supply chains and coating-grade formulation processes is also designed to facilitate material availability and decrease turnaround times amid supply chain risks posed by geopolitical developments particularly given Asia Pacific’s dominant 46.6% market share and the region’s complex supplier interdependencies.
The Major Players In The Industry
- Emery Oleochemicals
- BASF
- Jiangsu Senxuan
- Swadesh India Chemical Pvt Ltd
- Nikunj Chemicals
- Vizag Chemicals
- Anant Pharmaceuticals Pvt. Ltd.
- CEFA-CILINAS BIOTICS PVT. LTD.
- Cefa-Cilinas Biotics Pvt. Ltd.
- Scimplify
- Easychem
- Medisca Inc.
- Glenmark Pharmaceuticals
- Teva Pharmaceuticals USA, Inc.
- Bulk Naturals
- Other Key Players
Key Development
- December 2025 Emery Oleochemicals recorded company-wide revenue of USD 478.2 million and a workforce of 491 employees, although these figures represented the 2024 reporting year. Under investment and expansion, Emery started operating a solar system at its Loxstedt, Germany, facility in July 2025, with expected electricity generation of 115,000 kWh per year.
- ASF purchased the remaining 49% stake in Alsachimie on July 1, 2025, gaining 100% ownership of the French production business; however, this deal was linked to polyamide raw materials rather than azelaic acid. BASF’s Nutrition & Care segment, which includes pharmaceutical ingredients, generated sales of €6.509 billion and EBITDA before special items of €649 million in 2025.
Report Scope
| Report Features | Description |
|---|---|
| Market Value (2025) | USD 262.2 Mn |
| Forecast Revenue (2035) | USD 542.0 Mn |
| CAGR (2026-2035) | 7.5% |
| Base Year for Estimation | 2025 |
| Historic Period | 2020-2024 |
| Forecast Period | 2026-2035 |
| Report Coverage | Revenue Forecast, Market Dynamics, Competitive Landscape, Recent Developments |
| Segments Covered | By Product Type (Natural Azelaic Acid, Synthetic Azelaic Acid), By Grade (Pharmaceutical Grade, Cosmetic Grade, Industrial Grade), Polypropylene (PP), Ceramic, and Others), By Application (Pharmaceuticals (Acne Treatment, Rosacea Treatment, Others), Cosmetics & Personal Care (Skincare Creams, Serums, Anti-aging Products, Others), Plastics& Polymers (Lubricants, Plasticizers, Polyesters, Others), Adhesives & Sealants, Chemical Intermediates, Others) |
| Regional Analysis | North America – The US & Canada; Europe – Germany, France, The UK, Spain, Italy, Russia & CIS, Rest of Europe; APAC– China, Japan, South Korea, India, ASEAN & Rest of APAC; Latin America– Brazil, Mexico & Rest of Latin America; Middle East & Africa– GCC, South Africa, & Rest of MEA |
| Competitive Landscape | Emery Oleochemicals, BASF, Jiangsu Senxuan, Swadesh India Chemical Pvt Ltd, Nikunj Chemicals, Vizag Chemicals, Anant Pharmaceuticals Pvt. Ltd., CEFA-CILINAS BIOTICS PVT. LTD., Cefa-Cilinas Biotics Pvt. Ltd., Scimplify, Easychem, Medisca Inc., Glenmark Pharmaceuticals, Teva Pharmaceuticals USA, Inc., Bulk Naturals, Other Key Players |
| Customization Scope | Customization for segments, region/country-level will be provided. Moreover, additional customization can be done based on the requirements. |
| Purchase Options | We have three licenses to opt for: Single User License, Multi-User License (Up to 5 Users), Corporate Use License (Unlimited Users and Printable PDF) |


