


Report Overview
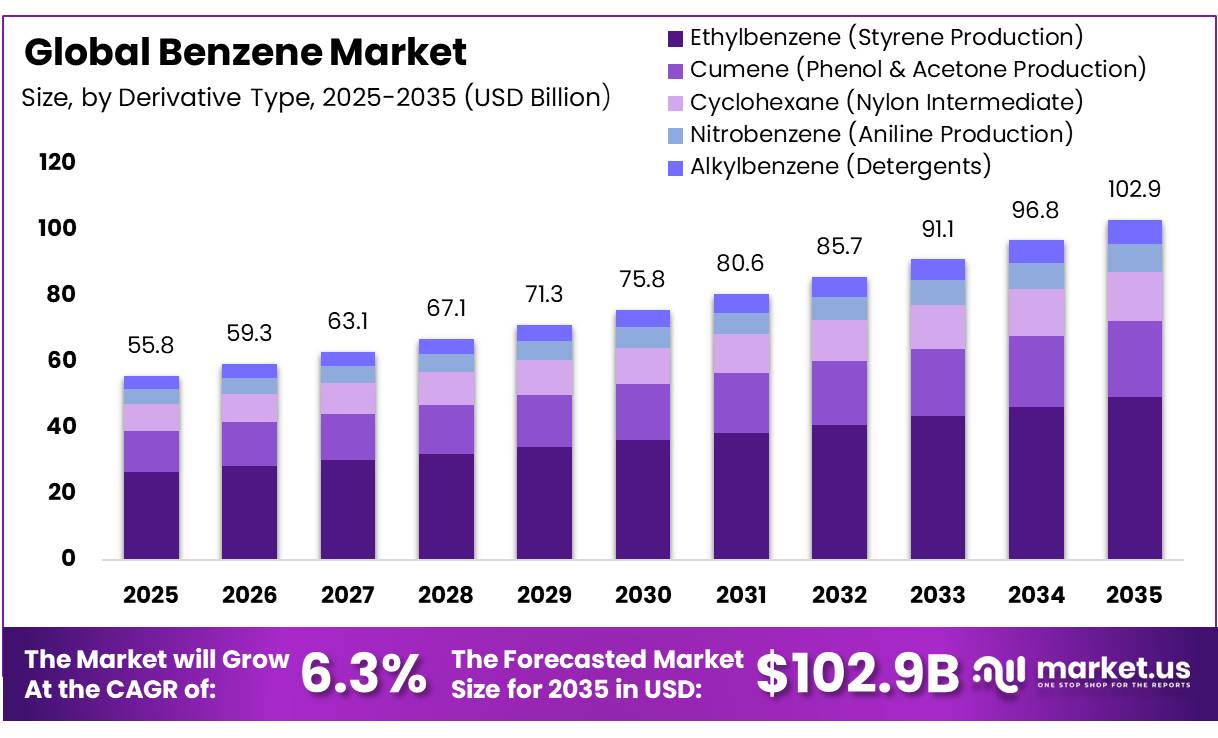
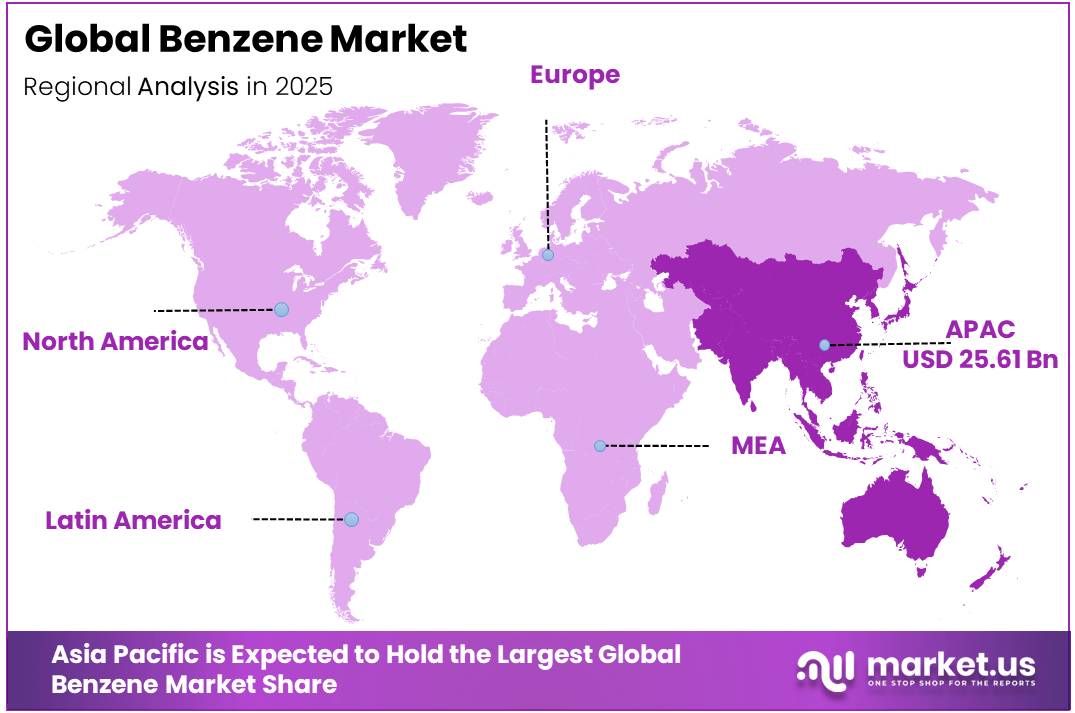
In 2025, the Global Benzene Market was valued at US$55.8 billion, and between 2026 and 2035, this market is estimated to register a CAGR of 6.3%, reaching about US$102.9 billion by 2035. Asia Pacific held a dominant market position, capturing more than a 45.9% share, holding USD 25.61 billion in revenue.
Benzene is a core petrochemical feedstock within the aromatic chemicals chain, used mainly to make ethylbenzene, cumene, cyclohexane, nitrobenzene, alkylbenzene and other intermediates. In 2025, the market remained closely linked with refinery reforming, steam cracking recovery and integrated petrochemical sites. Its industrial relevance comes from its role in styrene, phenol, acetone, nylon, detergents, solvents and polymer value chains rather than direct consumer consumption.
- Eurostat reported that European Union sold production of chemicals and related products reached €830 billion in 2024, while chemical exports increased by 0% and imports decreased by 1.1%. The European Union chemical trade surplus also grew by €40 billion in 2024, showing that chemical intermediates remained important to export-oriented production networks.
Key Takeaways
- The global Benzene Market was valued at USD 55.8 Billion in 2025.
- The global Market is projected to grow at a CAGR of 6.3% and is estimated to reach USD 102.9 Billion by 2035.
- Ethylbenzene (Styrene Production) dominated the benzene market, constituting 47.80% of the total market share.
- Styrene Production (Polystyrene, ABS, SBR) dominated the benzene market, with a market share of around 49.60%.
- Plastics & Polymers led the benzene market, comprising 52.30% of the total market.
- Petrochemical Grade Benzene held a major share in the benzene market, accounting for 78.10% of the market share.
- Catalytic Reforming was the most considerable within the market, accounting for around 61.40% of the revenue.
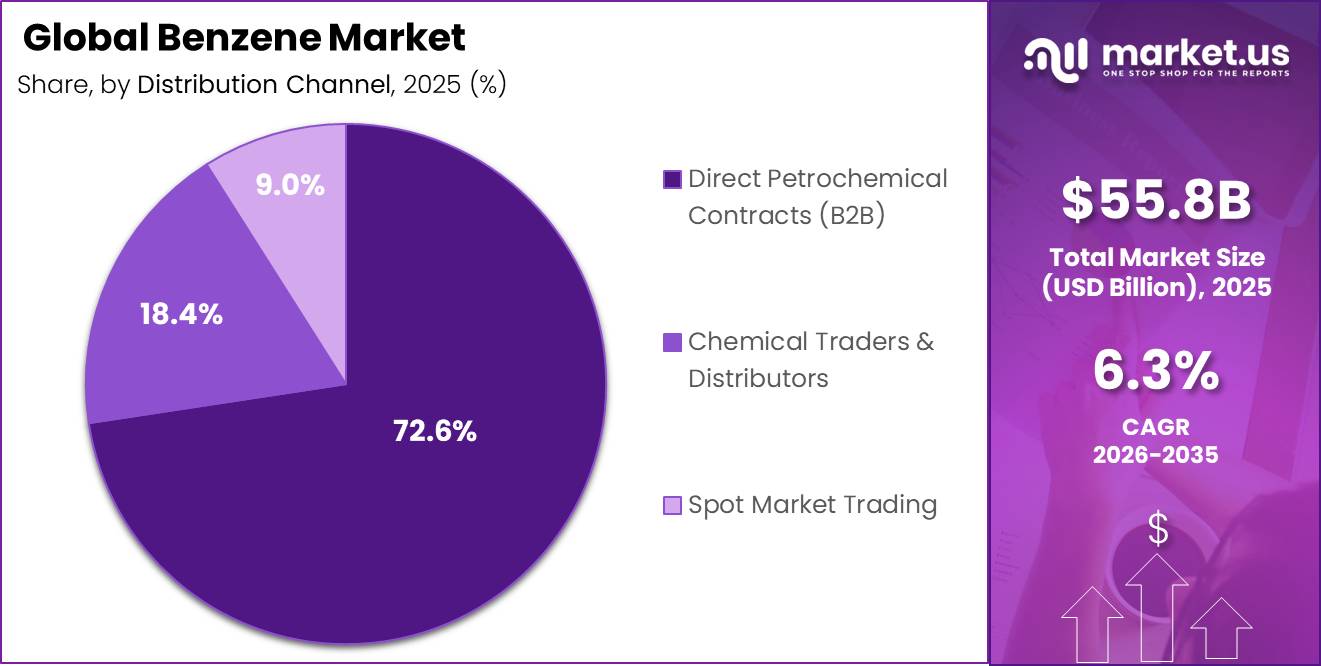
- Direct Petrochemical Contracts (B2B) dominated the benzene market, accounting for 72.60% of the total market share.
- Bulk Storage (Tank Farms) led the benzene market, comprising 66.20% of the total market.
- In 2025, Asia-Pacific was the most dominant region in the benzene market, accounting for 45.90% of the total market share.
Growth drivers come from plastics, synthetic rubber, resins, surfactants and nylon intermediates, where benzene-based derivatives support packaging, automotive parts, construction materials, textiles and consumer goods. The United States Environmental Protection Agency released preliminary 2024 Toxics Release Inventory data on August 5, 2025, covering more than 21,000 industrial and federal facilities, which highlights the scale of regulated chemical handling and the need for better tracking, closed transfer systems and cleaner plant operations.
Government rules are creating growth opportunities in safer storage, vapor recovery, compliant distribution and low-emission process upgrades. Under Registration, Evaluation, Authorisation and Restriction of Chemicals, companies must register substances made or imported in the European Economic Area at 1 tonne per year and above. The European Union also restricts benzene in toys where free benzene exceeds 5 mg/kg, equal to 0.0005% by weight.
These rules support demand for high-purity grades, safer logistics, tank monitoring and documented business-to-business supply in 2026 across regulated petrochemical clusters, especially where buyers require verified safety records before long-term contracts and technical compliance certificates from suppliers globally.
Derivative Type Analysis
Ethylbenzene (Styrene Production) dominates with 47.80% due to its strong role in polymer production
In 2025, Ethylbenzene (Styrene Production) held a dominant market position, capturing more than a 47.80% share of the Benzene Market. The segment remained leading in December 2025 because ethylbenzene is a major benzene derivative used for styrene production, which further supports polystyrene, acrylonitrile butadiene styrene, and styrene-butadiene rubber applications. Its strong demand came from plastics, packaging, automotive components, insulation materials, consumer goods, and construction-related polymer use.
Cumene (Phenol & Acetone Production) emerged as the fastest growing segment in 2026, supported by rising demand for phenol and acetone in resins, bisphenol A, coatings, adhesives, plastics, and industrial intermediates. Its growth improved as manufacturers looked for reliable benzene-based routes serving durable goods and specialty chemical applications.
Application Analysis
Styrene Production leads as benzene remains a key feedstock for major polymer applications
In 2025, Styrene Production (Polystyrene, ABS, SBR) held a dominant market position, capturing more than a 49.60% share of the Benzene Market. The segment remained leading in December 2025 because benzene is heavily used to produce ethylbenzene, which is further converted into styrene for polystyrene, acrylonitrile butadiene styrene, and styrene-butadiene rubber. Its demand was supported by packaging, automotive parts, consumer goods, insulation materials, appliances, and construction-related plastic products.
Phenol Production (Resins, Bisphenol A) emerged as the fastest growing segment in 2026, supported by higher use in resins, bisphenol A, coatings, adhesives, engineering plastics, and industrial intermediates. Its growth improved as downstream manufacturers continued to prefer benzene-based routes for durable and performance-focused chemical products.
End-Use Industry Analysis
Plastics & Polymers dominate with 52.30% as benzene supports large-volume material production
In 2025, Plastics & Polymers held a dominant market position, capturing more than a 52.30% share of the Benzene Market. The segment remained leading in December 2025 because benzene is a key feedstock for major polymer chains, especially through styrene, phenol, and other downstream intermediates. Its use remained strong in packaging materials, insulation products, appliance components, construction materials, consumer goods, and industrial plastic parts. Manufacturers continued to depend on benzene-based derivatives because they support durability, flexibility, lightweight design, and large-scale production efficiency.
Automotive emerged as the fastest growing segment in 2026, supported by rising use of benzene-derived plastics, synthetic rubber, resins, coatings, and lightweight components. Its growth improved as vehicle manufacturers focused on durability, weight reduction, interior materials, and performance-based polymer applications.
Form Type / Grade Analysis
Petrochemical Grade Benzene dominates with 78.10% due to strong use in large-scale chemical production
In 2025, Petrochemical Grade Benzene held a dominant market position, capturing more than a 78.10% share of the Benzene Market. The segment remained leading in December 2025 because it is widely used as a core feedstock in large petrochemical plants for producing ethylbenzene, cumene, cyclohexane, nitrobenzene, and other downstream intermediates. Its strong position was supported by steady demand from plastics, polymers, resins, synthetic rubber, detergents, and nylon-related production.
Industrial Grade Benzene emerged as the fastest growing segment in 2026, supported by its use in solvents, chemical intermediates, processing applications, and general industrial formulations. Its growth improved as manufacturers looked for cost-effective benzene grades for non-specialty applications.
Production Process Analysis
Catalytic Reforming dominates with 61.40% due to its strong role in refinery-linked benzene production
In 2025, Catalytic Reforming held a dominant market position, capturing more than a 61.40% share of the Benzene Market. The segment remained leading in December 2025 because catalytic reforming is a major refinery-based route for producing aromatic compounds, including benzene. Its strong position was supported by established refinery infrastructure, steady feedstock availability, and close integration with petrochemical units. Producers preferred this process because it supports large-volume output, consistent product quality, and efficient conversion within existing fuel and chemical production networks.
Steam Cracking Byproduct Recovery emerged as the fastest growing segment in 2026, supported by rising recovery of benzene from cracker streams used in petrochemical production. Its growth improved as producers focused on maximizing byproduct value, improving plant efficiency, and strengthening aromatic feedstock availability for downstream chemical manufacturing.
Distribution Channel Analysis
Direct Petrochemical Contracts lead with 72.60% due to stable bulk supply agreements
In 2025, Direct Petrochemical Contracts (B2B) held a dominant market position, capturing more than a 72.60% share of the Benzene Market. The segment remained leading in December 2025 because benzene is mainly traded in bulk between refineries, petrochemical producers, polymer manufacturers, and chemical processors. Direct business-to-business contracts helped buyers secure steady supply, fixed specifications, reliable logistics, and better price visibility.
Chemical Traders & Distributors emerged as the fastest growing segment in 2026, supported by rising demand from mid-sized chemical users that need flexible sourcing, regional availability, smaller contract volumes, and faster access to benzene for industrial processing and intermediate production.
Storage & Handling Analysis
Bulk Storage (Tank Farms) dominates with 66.20% due to safer handling of large-volume benzene supply
In 2025, Bulk Storage (Tank Farms) held a dominant market position, capturing more than a 66.20% share of the Benzene Market. The segment remained leading in December 2025 because benzene is mainly handled in large industrial volumes by refineries, petrochemical producers, chemical processors, and polymer manufacturers. Tank farms supported safer storage, steady bulk availability, controlled transfer, and better inventory management for continuous production needs.
Cylinder/Small Packaging emerged as the fastest growing segment in 2026, supported by rising demand from laboratories, specialty chemical users, and small-volume industrial buyers that need controlled quantities, easier handling, and flexible procurement.
Key Market Segments
By Derivative Type
- Ethylbenzene (Styrene Production)
- Cumene (Phenol & Acetone Production)
- Cyclohexane (Nylon Intermediate)
- Nitrobenzene (Aniline Production)
- Alkylbenzene (Detergents)
By Application
- Styrene Production (Polystyrene, ABS, SBR)
- Phenol Production (Resins, Bisphenol A)
- Cyclohexane for Nylon (Caprolactam, Adipic Acid)
- Detergents & Surfactants
- Solvents & Chemical Intermediates
By End-Use Industry
- Plastics & Polymers
- Automotive
- Construction Materials
- Consumer Goods
- Textiles (Nylon Production)
- Pharmaceuticals
By Form Type / Grade
- Petrochemical Grade Benzene
- Industrial Grade Benzene
- High-Purity Benzene
By Production Process
- Catalytic Reforming
- Steam Cracking Byproduct Recovery
- Toluene Hydrodealkylation (HDA)
- Coal Tar Distillation
By Distribution Channel
- Direct Petrochemical Contracts (B2B)
- Chemical Traders & Distributors
- Spot Market Trading
By Storage & Handling
- Bulk Storage (Tank Farms)
- Cylinder/Small Packaging
- Pipeline Transport
Driver Analysis
Refinery-utilization and fuels-to-chemicals optimization
Official environmental enforcement and industrial energy documentation indicate refineries are under pressure to run cleaner, monitor flaring more tightly, and improve process efficiency, but those same investments often increase the attractiveness of extracting higher-value petrochemical streams from integrated complexes rather than relying only on transport-fuel margins. EPA refinery enforcement materials show hard quantitative operating disciplines such as 98% combustion efficiency expectations, rolling flare limits, and instrumented monitoring requirements, which push operators to modernize process control and recover value from hydrocarbons more systematically.
In a world where fuel demand growth is less reliable than chemical demand growth, this supports benzene through refinery-petrochemical integration and aromatics optimization, adding about +0.6 percentage points to CAGR in the U.S., China, Korea, and the Middle East over the medium term.
Drivers Impact Analysis
| Driver | (~) % Impact on CAGR Forecast | Geographic Relevance | Impact Timeline |
|---|---|---|---|
| Styrene-chain pull from packaging, appliances, and durable goods | +1.2% | APAC core, North America core, EU selective | Short term (≤ 2 years) |
| Reformate and steam-cracker feedstock rebalancing | +0.9% | Northeast Asia, U.S. Gulf Coast, Middle East export corridors | Medium term (2-4 years) |
| Hazardous-air and chemical compliance tightening raises replacement demand for cleaner units | +0.7% | North America core, EU core, advanced APAC | Short term (≤ 2 years) |
| Asia-linked downstream detergents and intermediates demand support | +0.8% | India, China, Southeast Asia, MENA spill-over | Medium term (2-4 years) |
| Refinery-utilization and fuels-to-chemicals optimization | +0.6% | U.S., China, Korea, Middle East | Medium term (2-4 years) |
| Trade-security and domestic chemical resilience policies | +0.5% | India, EU, North America, selected ASEAN | Long term (≥ 4 years) |
Restraint Analysis
Feedstock tightness
Benzene supply remains structurally exposed to refinery and steam-cracker operating rates because it is co-produced from reformate and pyrolysis gasoline streams, and that matters more in 2026 because U.S. refinery capacity data show a flat 18.4 million barrels per calendar day on January 1, 2025 with no major expansion wave, limiting the system’s ability to absorb demand rebounds through incremental aromatics output.
In practical terms, when crude runs or cracker severity soften by even 2–4%, merchant benzene availability can contract materially faster than derivative demand because extraction units draw from already committed aromatic pools, creating spot tightness, wider contract-to-spot spreads, and working-capital inflation for styrenics, cumene, and cyclohexane chains.
This translates into a modeled CAGR deduction of about 1.4 percentage points because downstream buyers react by lowering operating rates, deferring inventory rebuilds, and prioritizing formula-based pass-through contracts rather than volume expansion, especially across North America, Europe, and Northeast Asia where mature assets have less flexibility than greenfield petrochemical systems.
Restraint Impact Analysis
| Restraint | (~) % Impact on CAGR Forecast | Geographic Relevance | Impact Timeline |
|---|---|---|---|
| Feedstock tightness | -1.4% | North America core, EU, NE Asia | Short term (≤ 2 years) |
| Toxicity compliance cost | -1.1% | North America core, EU, Japan, Korea | Medium term (2-4 years) |
| Consumer-use restrictions | -0.8% | EU core, UK-aligned, premium export chains | Medium term (2-4 years) |
| Refinery outage risk | -1.0% | U.S. Gulf, Europe, East Asia corridors | Short term (≤ 2 years) |
| Decarbonization CapEx drag | -0.9% | EU, North America, advanced APAC | Long term (≥ 4 years) |
| Derivative demand substitution | -0.7% | EU, North America, China export chains | Medium term (2-4 years) |
Opportunity Analysis
Benzene-to-battery materials chain
The IEA’s continued expectation for primary chemical expansion and the broader reallocation of oil demand toward petrochemical feedstocks create a structural rationale for using benzene as a platform molecule for battery-adjacent chemistries; commercially, integrated producers that shift 3% to 5% of benzene-equivalent output into battery-chain derivative portfolios could expand realized gross margin per tonne by 15% to 30%, reduce cyclicality exposure by 10% to 15%, and address a new downstream revenue pool on the order of $800 million to $1.4 billion by the early 2030s in East Asia, Europe, and the U.S., yielding a modeled +1.6 percentage-point CAGR upside if capacity alignment is executed before regional battery localization fully matures.
Opportunity Impact Analysis
| Opportunity | (~) % Potential CAGR Upside | Geographic Relevance | Execution Window |
|---|---|---|---|
| Circular aromatics from waste routes | +2.1% | North America core, EU, Japan, Korea | Medium term (2-4 years) |
| Benzene-to-battery materials chain | +1.6% | China, Korea, Japan, EU, U.S. | Medium term (2-4 years) |
| Specialty derivative mix upgrade | +1.4% | EU, U.S., Japan | Short term (≤ 2 years) |
| Import-substitution via regional hubs | +1.9% | India, Southeast Asia, Africa | Medium term (2-4 years) |
| Carbon-advantaged certified benzene | +1.2% | EU, North America core | Short term (≤ 2 years) |
| Aromatics consolidation and asset roll-up | +2.4% | North America, EU, Northeast Asia | Long term (≥ 4 years) |
Challenges Analysis
Refinery feedstock volatility
Benzene remains structurally exposed to refinery and steam-cracker co-product economics because reformate and pygas availability move with gasoline blending needs, refinery utilization, and downstream olefins operating rates rather than with benzene demand alone, creating a recurring mismatch between nominal aromatic capacity and merchant benzene availability; the U.S. EIA’s 2026 refinery capacity reporting confirms that benzene-relevant upstream units sit inside a refinery system whose crude distillation and downstream process availability are continuously surveyed because capacity changes and operating status matter to product supply formation, while EPA identifies reformate and pyrolysis gasoline among the high-benzene streams most operationally sensitive at refinery sites.
In 2026 terms, that translates into a modeled 3% to 5% swing in spot merchant benzene availability during seasonal gasoline optimization windows, 2 to 4 percentage-point utilization variance across extraction units tied to turnaround timing, and 6 to 12 days of additional scheduling lag when refinery planners prioritize gasoline pool value over aromatics extraction, which collectively imposes about -1.2 percentage points of CAGR friction drag versus a smoother feedstock regime.
Challenges Impact Analysis
| Challenge | (~) % CAGR Friction Drag | Geographic Relevance | Mitigation Horizon |
|---|---|---|---|
| Refinery feedstock volatility | -1.2% | North America core, EU refinery belt, Northeast Asia aromatics hubs | Medium term (2-4 years) |
| Emissions compliance retrofit burden | -1.0% | U.S. Gulf Coast, EU regulatory hubs, East Asia petrochemical clusters | Medium term (2-4 years) |
| Marine logistics cycle delays | -0.8% | APAC logistics corridors, Atlantic Basin trade lanes, India import gateways | Short term (≤ 2 years) |
| Aging asset reliability strain | -0.9% | U.S. refinery corridors, Western Europe legacy sites, Japan-Korea mature complexes | Long term (≥ 4 years) |
| Process talent replacement gap | -0.7% | North America core, Western Europe, Northeast Asia specialty operations | Long term (≥ 4 years) |
| Trade rebalancing inventory risk | -0.6% | China-linked trade networks, India import markets, transshipment hubs | Medium term (2-4 years) |
Geopolitical Impact Analysis
Geopolitical Realignment and Feedstock Security Reshaping Benzene Supply Chains
Current geopolitical tensions are reshaping the benzene market through crude oil volatility, refinery feedstock disruption, sanctions, and higher dependence on secure petrochemical trade routes. Benzene production is closely linked with refinery reforming and steam-cracking streams, so instability in crude oil, naphtha, and refined product flows directly affects aromatics availability and pricing. The U.S. Energy Information Administration reported that oil flows through the Strait of Hormuz averaged 20 million barrels per day in 2024, equal to about 20% of global petroleum liquids consumption, making this route highly important for Asian petrochemical producers.
Demand-side pressure is also becoming more regionally concentrated. The International Energy Agency stated that global oil demand growth in 2025 was expected to average just over 1 million barrels per day, while Asian countries would account for almost 60% of the gains. It also noted that China’s growth would be driven entirely by petrochemical feedstocks, showing how benzene-linked value chains remain exposed to Asia-centered feedstock and refinery movements.
In parallel, sanctions and trade realignment are changing supply routes for petroleum-based chemical inputs. The European Commission stated that the European Union prohibited imports of seaborne crude oil and refined petroleum products from Russia, after importing €71 billion worth of Russian oil in 2021. These shifts are encouraging benzene producers and buyers to diversify sourcing, strengthen storage planning, secure long-term petrochemical contracts, and improve logistics resilience across regulated chemical markets.
Regional Analysis
Asia-Pacific dominates with 45.90% and USD 25.61 Bn due to strong petrochemical demand
In 2025, Asia-Pacific held a dominant market position in the Benzene Market, capturing more than a 45.90% share and reaching USD 25.61 Bn. The region remained the leading market in December 2025 because benzene demand was strongly connected with large petrochemical conversion, styrene production, phenol chains, nylon intermediates, detergents, solvents, and polymer manufacturing across China, Japan, South Korea, and Southeast Asia.
China remained a key regional benzene hub, as the National Bureau of Statistics listed Pure Benzene (Petroleum Benzene, Industrial Grade) at 5,294.3 yuan per ton during January 1 to 10, 2026. The same official monitoring covered nearly 2,000 wholesalers, agents, and dealers across more than 300 trading markets in 31 provinces, showing strong chemical circulation depth. Asia-Pacific is expected to retain dominance as producers focus on stable feedstock access, bulk storage, direct petrochemical contracts, and reliable supply to large downstream chemical users.
Key Regions and Countries Covered
- North America
- The US
- Canada
- Europe
- Germany
- France
- The UK
- Spain
- Italy
- Russia & CIS
- Rest of Europe
- APAC
- China
- Japan
- South Korea
- India
- ASEAN
- Rest of APAC
- Latin America
- Brazil
- Mexico
- Rest of Latin America
- Middle East & Africa
- GCC
- South Africa
- Rest of MEA
Key Players Analysis
Benzene producers focus on strengthening feedstock access, refinery integration, product purity, and long-term petrochemical supply contracts to maintain competitiveness. A key priority is stable production through catalytic reforming, steam cracking byproduct recovery, and other integrated aromatics routes that support consistent benzene availability for downstream users. Companies also emphasize quality control, storage safety, and reliable bulk handling, as benzene buyers in styrene, phenol, nylon intermediates, detergents, solvents, and polymer chains require steady specifications and secure delivery.
Integrated petrochemical companies hold a stronger position because they can manage crude oil, naphtha, aromatics extraction, and downstream derivative production within connected value chains. This helps reduce supply uncertainty and improves cost control during feedstock price changes. Key players also focus on tank farm capacity, pipeline connectivity, vapor-control systems, and direct business-to-business contracts to support large industrial customers. At the same time, chemical traders and distributors help serve regional and mid-sized buyers, keeping the market competitive across flexible sourcing and short-term supply needs
Market Key Players
- ExxonMobil Corporation
- Royal Dutch Shell plc
- BP plc
- Chevron Phillips Chemical Company
- Saudi Aramco
- China Petroleum & Chemical Corporation (Sinopec)
- PetroChina Company Limited
- LyondellBasell Industries N.V.
- TotalEnergies SE
- INEOS Group Holdings S.A.
- Reliance Industries Limited
- Formosa Petrochemical Corporation
- Mitsubishi Chemical Group Corporation
- SABIC
- LG Chem Ltd.
Key Development
- In January 2026, SABIC signed two strategic transactions to divest its European Petrochemicals business to AEQUITA and its Engineering Thermoplastics business in the Americas and Europe to MUTARES. The combined enterprise value stood at USD 950 million, supporting SABIC’s portfolio optimization and sharper focus on higher-return chemical businesses.
- In May 2026, Saudi Aramco and PETRONAS signed an agreement to transfer Aramco’s equity stakes in Pengerang Refining Company and Pengerang Petrochemical Company to PETRONAS. The move will make PRefChem fully owned by PETRONAS and supports Aramco’s downstream portfolio optimization strategy.
- In March 2026, Mitsubishi Chemical Corporation announced organizational changes effective April 2026, including the creation of a new Green Chemicals Business Development Department under the direct supervision of the President. The step is aimed at speeding up early commercialization in the green chemicals area.
Report Scope
| Report Features | Description |
|---|---|
| Market Value (2025) | USD 55.8 Bn |
| Forecast Revenue (2035) | USD 102.9 Bn |
| CAGR (2026-2035) | 6.3% |
| Base Year for Estimation | 2025 |
| Historic Period | 2020-2024 |
| Forecast Period | 2026-2035 |
| Report Coverage | Revenue Forecast, Market Dynamics, Competitive Landscape, Recent Developments |
| Segments Covered | By Derivative Type (Ethylbenzene (Styrene Production), Cumene (Phenol & Acetone Production), Cyclohexane (Nylon Intermediate), Nitrobenzene (Aniline Production), and Alkylbenzene (Detergents)), By Application (Styrene Production (Polystyrene, ABS, SBR), Phenol Production (Resins, Bisphenol A), Cyclohexane for Nylon (Caprolactam, Adipic Acid), Detergents & Surfactants, and Solvents & Chemical Intermediates), By End-Use Industry (Plastics & Polymers, Automotive, Construction Materials, Consumer Goods, Textiles (Nylon Production), and Pharmaceuticals), By Form Type / Grade (Petrochemical Grade Benzene, Industrial Grade Benzene, and High-Purity Benzene), By Production Process (Catalytic Reforming, Steam Cracking Byproduct Recovery, Toluene Hydrodealkylation (HDA), and Coal Tar Distillation), By Distribution Channel (Direct Petrochemical Contracts (B2B), Chemical Traders & Distributors, and Spot Market Trading), By Storage & Handling (Bulk Storage (Tank Farms), Cylinder/Small Packaging, and Pipeline Transport) |
| Regional Analysis | North America – The US & Canada; Europe – Germany, France, The UK, Spain, Italy, Russia & CIS, Rest of Europe; APAC– China, Japan, South Korea, India, ASEAN & Rest of APAC; Latin America– Brazil, Mexico & Rest of Latin America; Middle East & Africa– GCC, South Africa, & Rest of MEA |
| Competitive Landscape | ExxonMobil Corporation, Royal Dutch Shell plc, BP plc, Chevron Phillips Chemical Company, Saudi Aramco, China Petroleum & Chemical Corporation (Sinopec), PetroChina Company Limited, LyondellBasell Industries N.V., TotalEnergies SE, INEOS Group Holdings S.A., Reliance Industries Limited, Formosa Petrochemical Corporation, Mitsubishi Chemical Group Corporation, SABIC, and LG Chem Ltd. |
| Customization Scope | Customization for segments, region/country-level will be provided. Moreover, additional customization can be done based on the requirements. |
| Purchase Options | We have three licenses to opt for: Single User License, Multi-User License (Up to 5 Users), Corporate Use License (Unlimited Users and Printable PDF) |





































