


Report Overview
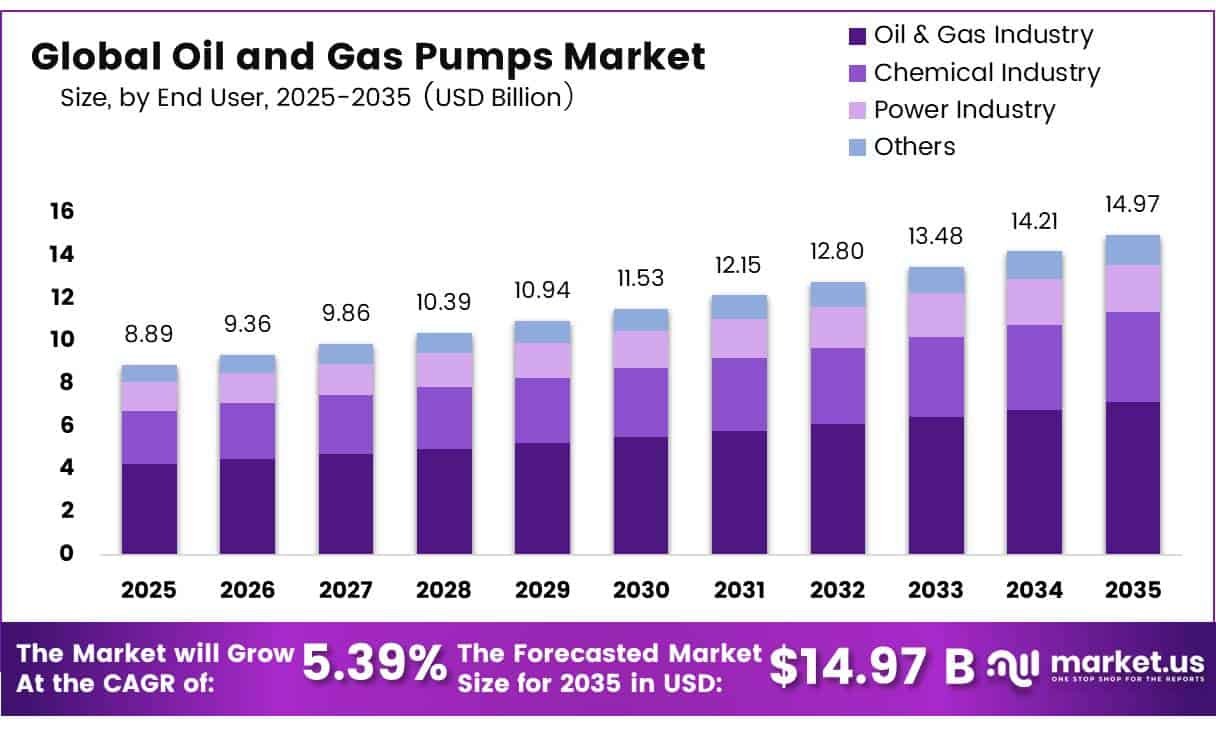
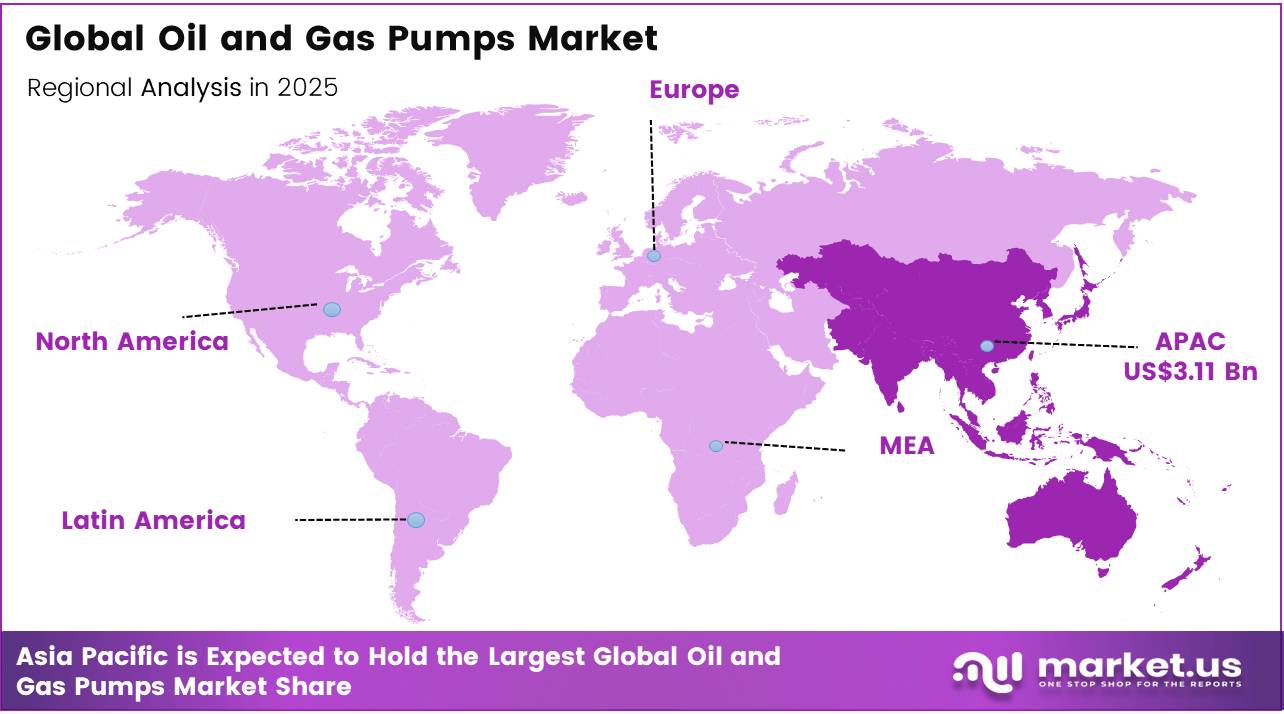
In 2025, the Global Oil and Gas Pumps Market was valued at USD 8.89 billion, and between 2026 and 2035, this market is estimated to register a CAGR of 5.39%, reaching about USD 14.97 billion by 2035. In 2025, Asia Pacific held a dominant market position, capturing more than a 35.0% share, holding USD 3.11 Billion revenue.
Oil and gas pumps are essential for moving crude oil, natural gas, produced water, and refined products across upstream, midstream, and downstream operations. Growing energy production, ageing oilfields, and the adoption of automated pumping systems are strengthening demand for efficient and reliable pump technologies.
- In 2025, U.S. crude output reached 13.6 million barrels per day, marketed gas production averaged 118.5 Bcf per day, and global oil demand increased by 0.65 million barrels per day. These volumes support demand for centrifugal, reciprocating, and multiphase pumping systems.
Growth is driven by mature-field pressure decline, longer transport distances, heavier feedstocks, and stricter reliability requirements. In 2025, the Permian Basin accounted for 48% of total U.S. crude oil production, while the Appalachia, Permian, and Haynesville regions collectively represented 67% of U.S. marketed natural gas production Operators are prioritizing high-pressure pumps, abrasion-resistant materials, variable-speed drives, and predictive maintenance to reduce downtime and energy losses.
Future opportunities are expanding in LNG, offshore processing, digital pumping, and carbon management. The IEA expects 345 billion cubic metres per year of LNG export capacity between 2025 and 2030. In January 2025, the U.S. Department of Energy awarded $101 million to five carbon-capture test-centre projects, supporting demand for CO2 compression, injection, and transport pumps. Smart seals, remote monitoring, and low-emission designs should gain adoption.
Key Takeaways
- The global Oil and Gas Pumps market was valued at USD 8.89 billion in 2025.
- The global market is projected to grow at a CAGR of 5.39% and is estimated to reach USD 14.97 billion by 2035.
- On the basis of Pump Type, the Centrifugal dominated the market, constituting 61.5% of the total market share.
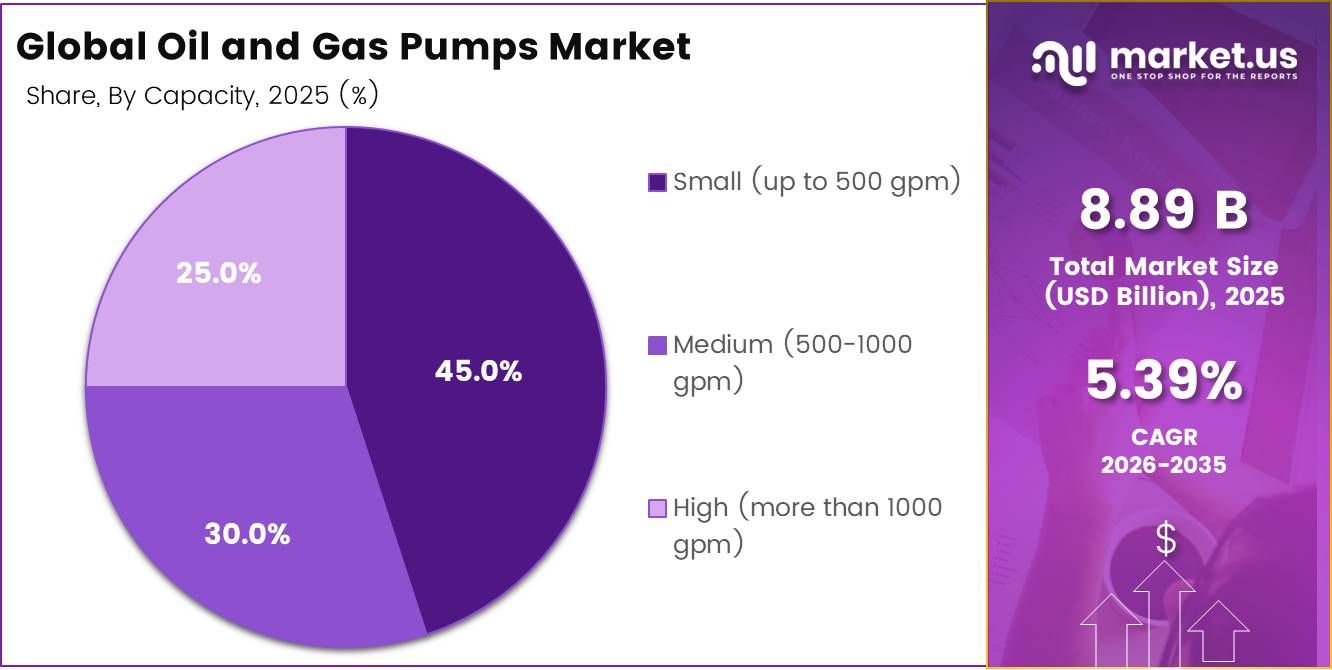
- Based on the capacity, the Small (up to 500 gpm) dominated the Oil and Gas Pumps market, with a substantial market share of around 45.0%.
- Based on the By Application, Midstream led the market, comprising 37.85% of the total market.
- Among the end-user, the Oil & Gas Industry held a major share in the Oil and Gas Pumps market, 47.80% of the market share.
- In 2025, the Asia Pacific was the most dominant region in the Oil and Gas Pumps market, accounting for 35.0% of the total global consumption.
Pump Type Analysis
Centrifugal represents dominant Segment in the Market.
Centrifugal pumps held a dominant market position, capturing more than a 61.55% share of the oil and gas pumps market. Their leading position is supported by continuous, high-volume applications across refineries, pipeline networks, water injection, crude transfer, and processing plants. The U.S. Energy Information Administration recorded refinery inputs of 16.709 million barrels per day in 2025, while refinery utilization reached 92.0%. Such intensive operating conditions favour centrifugal pumps because they offer steady flow, simple installation, energy efficiency, and dependable performance across large processing facilities.
Cryogenic pumps are the fastest-growing segment, driven by rising investment in LNG storage, liquefaction, transport, and regasification infrastructure. These pumps are specially designed to handle liquefied gases at extremely low temperatures, making reliability and material strength critical. The U.S. Pipeline and Hazardous Materials Safety Administration reported 186 LNG facilities in service during 2025, highlighting the expanding infrastructure base that requires specialised cryogenic transfer and circulation equipment.
Capacity Analysis
Small pumps a significant capacity.
Small pumps (up to 500 gpm) held a dominant market position, capturing more than a 45.00% share. These systems remain widely used for well-pad transfer, produced-water handling, chemical injection, drainage, and other localized operations where compact installation and controlled flow are important. The U.S. Energy Information Administration reported that wells drilled before 2025 produced 8.3 million barrels per day, while newly completed wells supplied 2.9 million barrels per day. This large base of established production sites supports continued demand for smaller, adaptable pumping units.
Medium-capacity pumps (500 to 1,000 gpm) are the fastest-growing segment, supported by rising throughput requirements at gathering stations, terminals, pipeline connections, and processing facilities. PHMSA recorded 227,457 miles of hazardous-liquid pipelines in 2025, including 65,067 miles carrying petroleum and refined products. This extensive transfer network creates opportunities for medium-sized pumps that provide higher flow without the energy use, footprint, and operating complexity associated with very large systems.
Application Analysis
Midstream Are the Most Widely Used Application.
Midstream held a dominant market position, capturing more than a 37.85% share of the oil and gas pumps market. Its leadership is supported by the extensive use of pumps across gathering systems, transmission pipelines, storage terminals, compressor stations, and export facilities. The U.S. Energy Information Administration reported that pipeline projects completed during 2025 added approximately 6.3 billion cubic feet per day of natural gas capacity, with 85% directed toward the South-Central region. This infrastructure expansion supports steady demand for reliable transfer, boosting, and circulation pumps designed for continuous operation.
Upstream is the fastest-growing segment, driven by new drilling approvals, well development, enhanced recovery, and produced-water management. The Bureau of Land Management approved 6,106 applications for permits to drill across federal and Indian lands in fiscal 2025, including 5,740 federal permits. Rising field activity increases the need for well-service, artificial-lift, injection, and multiphase pumps capable of handling difficult fluids and changing pressure conditions.
End User Analysis
Oil and gas industry Held a Major Share of the Oil and Gas Pumps Market.
In 2025, the oil and gas industry held a dominant market position, capturing more than a 47.80% share of the oil and gas pumps market. Its leadership reflects the continuous need for pumps in well production, offshore platforms, gathering systems, water injection, crude transfer, and processing operations. The Bureau of Ocean Energy Management reported that U.S. offshore oil production exceeded 714 million barrels in 2025. As of May 2026, 474 of 2,059 active offshore leases were producing oil and gas, creating steady demand for high-pressure, multiphase, transfer, and water-handling pumps.
The chemical industry is the fastest-growing end-user segment, supported by higher production activity and the need to move corrosive, hazardous, and temperature-sensitive fluids safely. Federal Reserve data showed that U.S. chemical manufacturing output grew at a 7.4% annual rate during the third quarter of 2025 and remained 1.2% higher year over year in November 2025. This expansion supports demand for sealed, corrosion-resistant, and precisely controlled pumping systems across chemical processing facilities.
Key Market Segments
By Pump Type
- Centrifugal
- Positive Displacement
- Cryogenic
By Capacity
- Small (up to 500 gpm)
- Medium (500-1000 gpm)
- High (more than 1000 gpm)
By Application
- Upstream
- Midstream
- Downstream
By End User
- Oil & Gas Industry
- Chemical Industry
- Power Industry
- Others
Driver Analysis
Expansion of midstream and downstream pipeline, LNG and refining infrastructure
The period 2024–2026 has seen intensified investment in midstream pipelines, LNG infrastructure and refining upgrades, as governments and operators seek to secure energy supply while rebalancing portfolio exposure to gas and liquids; North America’s share of global oil and gas pump demand is estimated at roughly one‑third in 2026, tracking its ~35% share of the overall oil and gas pumps market.
New crude and product pipelines typically require dozens to hundreds of mainline and booster pumps per corridor, while large LNG liquefaction trains deploy complex cryogenic pump systems for export volumes that can exceed 10 million tonnes per annum per facility.
Given that midstream and downstream projects typically have lead times of 3–5 years and political backing through energy security agendas, this infrastructure build‑out supports a long‑term uplift of around +1.9 percentage points to pumps market CAGR, with strong relevance across North America, EU, APAC and the Middle East through 2030 and beyond.
Drivers Impact Analysis
| Driver | (~) % Impact on CAGR Forecast | Geographic Relevance | Impact Timeline |
|---|---|---|---|
| Rising upstream E&P activity in conventional and unconventional basins | +2.3% | North America core, Middle East, APAC corridors | Medium term (2–4 years) |
| Expansion of midstream and downstream pipeline, LNG and refining infrastructure | +1.9% | North America, EU, APAC, Middle East | Long term (≥ 4 years) |
| Digitalization, IoT and energy-efficient pump technologies | +1.7% | North America, EU, APAC corridors | Medium term (2–4 years) |
| Environmental and safety regulations driving high-efficiency, low-emission pump upgrades | +1.4% | EU, North America, selective APAC | Long term (≥ 4 years) |
| Growth in gas distribution networks and city gas / CNG–LNG retail infrastructure | +1.6% | APAC corridors, Middle East, Latin America spill-over | Short to medium term (≤ 4 years) |
| Emerging CCS, hydrogen and extreme-environment pumping applications | +1.2% | North America core, EU, Middle East | Long term (≥ 4 years) |
Restraint Analysis
Oil price volatility and low-price bands
Oil price volatility remains one of the most material restraints on oil and gas pumps demand, with crude prices oscillating around a USD 70–80 per barrel band through 2025–2026 and regularly dipping below USD 65 during geopolitical or demand shocks, compressing upstream cash flows and forcing operators to defer non-essential capex.
In low-price windows, integrated majors and NOCs typically cut or re‑sequence drilling and brownfield enhancement projects, and empirical project data from recent cycles show that discretionary equipment orders especially upgrades of existing pump trains can fall by 20–30% when prices stay below USD 60 for more than two quarters, directly reducing pump shipment volumes.
For pump OEMs, the restraint shows up as order book volatility, idle manufacturing capacity, and weaker pricing power in downcycles, resulting in margin compression of 150–250 basis points in low‑price years versus high‑price years. Strategically, this pushes vendors to diversify into midstream, downstream and non‑oil applications and to prioritize aftermarket service revenues, but the net effect on the core oil and gas pumps CAGR is a modeled deduction of about -2.4 percentage points over the medium term, as recurring price shocks extend decision timelines and keep capex growth below what upstream resource potential alone would justify.
Restraint Impact Analysis
| Restraint | (~) % Impact on CAGR | Geographic Relevance | Impact Timeline |
|---|---|---|---|
| Oil price volatility and low-price bands | -2.4% | North America core, Middle East, APAC corridors | Medium term (2–4 years) |
| Trade tariffs, input cost inflation and supply chain delays | -2.1% | North America, EU, APAC | Short to medium term (≤ 4 years) |
| Energy transition and shift to renewables | -1.8% | EU, North America, selective APAC | Long term (≥ 4 years) |
| Stringent ESG and emissions regulations slowing project approvals | -1.5% | EU, North America, Indonesia/ASEAN | Long term (≥ 4 years) |
| Skilled labor shortages and execution constraints | -1.3% | North America core, EU, Middle East | Medium term (2–4 years) |
| Complex permitting and regulatory fragmentation in emerging markets | -1.2% | APAC corridors, India, Indonesia, Latin America | Long term (≥ 4 years) |
Opportunity Analysis
Performance-based pump-as-a-service and leasing
This is a future opportunity rather than a current driver because, despite rising interest in digitalization, most oil and gas pump revenues in 2026 still come from traditional capex equipment sales and time-and-materials maintenance, with only limited deployment of performance‑linked business models; pivoting to “pump‑as‑a‑service” would monetize uncaptured value in energy savings and reliability across a large installed base.
In oil and gas, a typical large asset may operate hundreds to thousands of pumps, consuming several megawatts of power and incurring annual maintenance costs in the millions of dollars; if vendors structure multi‑year contracts where they guarantee, say, 10–15% energy savings and 20–25% reduction in unplanned downtime via optimized assets and analytics, and charge annuity‑like fees capturing 30–40% of those savings, each site could yield incremental recurring revenues of USD 1–5 million per year above hardware sales, with EBITDA margins potentially 10–15 percentage points higher than legacy models.
Customer acquisition economics improve as capex is shifted to opex, reducing upfront budget hurdles and enabling projects that would otherwise stall under capital constraints. Adoption at scale is still untapped: if even 20–30% of the global oil and gas pump installed base transitions to performance-based contracts over the next 2–4 years, sector revenues could plausibly rise several billion dollars above baseline and smooth cyclicality. Because current forecasts largely assume conventional sales and standard services, systemic implementation of pump‑as‑a‑service and leasing anchored in North America, the EU and advanced APAC—could add approximately +2.4 percentage points of CAGR upside through both higher monetization per asset and deeper, stickier customer relationships.
Opportunity Impact Analysis
| Opportunity | (~) % Potential CAGR Upside | Geographic Relevance | Execution Window |
|---|---|---|---|
| SaaS-based pump monitoring and outcome-linked service models | +2.2% | North America core, EU, APAC emerging markets | Short to medium term (≤ 4 years) |
| Diversification into broader industrial pump adjacencies | +1.9% | APAC emerging, Middle East, Latin America | Medium term (2–4 years) |
| Integrated LNG, data center cooling and power sector solutions | +1.8% | North America, Middle East, APAC corridors | Medium term (2–4 years) |
| Consolidation and M&A roll-up of fragmented regional OEMs | +1.7% | APAC, Middle East, Latin America | Long term (≥ 4 years) |
| Leveraging energy efficiency regulations for premium “green” pump portfolios | +1.6% | EU, UK, Japan, North America core | Short to long term (≤ 4+ years) |
| Expansion into CCS, hydrogen and low-carbon infrastructure ecosystems | +1.5% | North America, EU, Middle East | Long term (≥ 4 years) |
Challenges Analysis
Aging workforce and skills pipeline deficit
An aging workforce combined with a weak pipeline of younger talent creates a systemic challenge that steadily erodes execution capacity in the oil and gas pumps value chain without fully halting projects. Industry analyses show that nearly half of the traditional energy workforce is now aged 45 and above, with many expecting to retire within the next decade, while surveys indicate that up to 62% of Gen Z and Millennials find a career in oil and gas unappealing, and only around one-third of hiring managers are actively recruiting graduates.
The immediate impact on pumps markets is slower design and commissioning cycles multi‑asset projects that could have been executed in 24–30 months creep toward 30–36 months and rising labor costs, as overtime and premium rates for scarce specialists lift total installed cost per pump set by several percentage points. Operational metrics deteriorate subtly: schedule adherence drops, rework rates increase, and the adoption of advanced digital and high‑efficiency pump technologies is delayed because few teams have both domain and digital skills.
Given education and perception cycles, this challenge will likely take beyond four years to materially normalize, and is modeled to drag achievable pumps CAGR by around -1.3 percentage points as it systematically reduces the sector’s capacity to convert investment intentions into efficiently executed, technologically advanced projects.
Challenges Impact Analysis
| Challenge | (~) % CAGR Friction Drag | Geographic Relevance | Mitigation Horizon |
|---|---|---|---|
| Aging workforce and skills pipeline deficit | -1.3% | North America core, EU regulatory hubs, Middle East industrial clusters | Long term (≥ 4 years) |
| Manual, multi-tier supply chains and extended lead times | -1.2% | North America, EU, APAC logistics corridors | Medium term (2–4 years) |
| Complex multi-standard compliance and aging asset base | -1.1% | EU regulatory hubs, APAC process clusters, Latin America | Long term (≥ 4 years) |
| Digital fragmentation and limited data interoperability | -1.0% | North America core, EU, APAC emerging markets | Medium term (2–4 years) |
| Policy volatility and multi-project portfolio risk management | -0.9% | North America core, EU, Indonesia/ASEAN | Long term (≥ 4 years) |
| Global competition for vendors and field capacity | -0.8% | North America, Middle East, APAC corridors | Medium term (2–4 years) |
Geopolitical Impact Analysis
Geopolitical Realignment and Supply Chain Fragmentation Reshaping Oil and Gas Pumps Manufacturing.
Geopolitical sanctions are changing the operating environment for oil and gas pump manufacturers and service providers. In July 2025, the European Union reduced the price cap on Russian crude oil from USD 60 to USD 47.60 per barrel and restricted port access for another 105 shadow-fleet vessels, bringing the total number of listed vessels to 444.
The package also imposed transaction restrictions on 22 additional Russian banks and export controls involving 26 entities linked to dual-use goods and technologies. These measures increase payment, insurance, logistics, and compliance risks for pump packages, replacement components, seals, motors, and control systems supplied to sanctioned energy operations. Operators may consequently extend equipment life, rebuild installed pumps, and source components from regional suppliers.
At the same time, Europe’s shift away from Russian pipeline energy is creating new demand around LNG terminals, storage sites, and interconnecting pipelines. EU gas imports reached 289 billion cubic metres in 2025, while LNG imports increased to 131 billion cubic metres and represented 45% of the region’s gas imports. Regasification capacity expanded by 8% during the year. EU LNG import capacity also reached 242 billion cubic metres per year, following an increase of 76 billion cubic metres between 2021 and 2025, with another 100 billion cubic metres expected during 2025–2030. This realignment supports demand for cryogenic, transfer, booster, circulation, and pipeline pumps across newly diversified energy routes.
Regional Analysis
Asia Pacific Held the Largest Share of the Global Oil and Gas Pumps Market.
Asia Pacific held a dominant market position, capturing more than a 35.00% share of the oil and gas pumps market. The region’s leadership is supported by its large refining base, expanding gas networks, offshore production, and continued investment in energy security.
- China’s National Bureau of Statistics reported that crude oil processing reached 737.59 million tonnes in 2025, increasing by 4.1% from the previous year. This operating scale creates steady demand for transfer, circulation, injection, and pipeline pumps capable of handling large volumes reliably.
The Middle East and Africa is the fastest-growing region, supported by upstream expansion, mature-field optimisation, and new gas-processing infrastructure. Saudi Arabia’s General Authority for Statistics reported that oil activities grew by 5.7% in 2025, while crude oil and natural gas activities expanded by 12.4% year over year during the fourth quarter. This momentum is increasing demand for high-pressure, multiphase, water-injection, and export-terminal pumping systems.
Key Regions and Countries Covered
- North America
- The US
- Canada
- Europe
- Germany
- France
- The UK
- Spain
- Italy
- Russia & CIS
- Rest of Europe
- APAC
- China
- Japan
- South Korea
- India
- ASEAN
- Rest of APAC
- Latin America
- Brazil
- Mexico
- Rest of Latin America
- Middle East & Africa
- GCC
- South Africa
- Rest of MEA
Key Players Analysis
Oil and gas pump manufacturers focus on improving equipment reliability, operating efficiency, and service integration to maintain competitiveness. A key priority is continuous engineering innovation, including the development of high-pressure, corrosion-resistant, and multiphase pumps that can handle abrasive fluids, variable flow conditions, and demanding offshore environments. Companies also invest in advanced sealing systems, smart sensors, and predictive maintenance platforms to reduce leakage, energy consumption, and unplanned downtime.
Vertical integration with motor, valve, and component suppliers helps strengthen material availability and control production costs during periods of supply disruption. Strategic manufacturing and service expansion near major oilfields, pipeline corridors, refineries, and LNG terminals enables faster maintenance support and closer alignment with customer requirements.
The Major Players In The Industry
- Flowserve Corporation
- Sulzer Ltd.
- KSB Group
- Grundfos
- Weir Group
- Ebara Corporation
- Baker Hughes
- Schlumberger
- NOV Inc.
- Xylem Inc.
- ITT Inc.
- Ruhrpumpen Group
- SPX FLOW
- Gardner Denver
- Pentair
- Ariel Corporation
- Kirloskar Brothers Limited
- Alfa Laval
- CAT Pumps
- DXP Enterprises
- SPP Pumps
- PCM
- NETZSCH
- Wastecorp Pumps
- National Pump and Energy
- Atlas Copco
- Halliburton
Key Development
- In July 2025, Sulzer opened a 2,600-square-metre rotating-equipment service centre in Ezeiza, Argentina, supporting pump and turbomachinery repairs for oil and gas customers. The expansion followed a 15% increase in local staffing and strengthened engineering capacity.
- In January 2025, Baker Hughes secured an order for six gas-compression trains and six propane compressors for the third expansion phase of Saudi Arabia’s Jafurah gas field, expanding its equipment role in gas processing.
Report Scope
| Report Features | Description |
|---|---|
| Market Value (2025) | USD 8.89 Bn |
| Forecast Revenue (2035) | USD 14.97 Bn |
| CAGR (2026-2035) | 5.39% |
| Base Year for Estimation | 2025 |
| Historic Period | 2020-2024 |
| Forecast Period | 2026-2035 |
| Report Coverage | Revenue Forecast, Market Dynamics, Competitive Landscape, Recent Developments |
| Segments Covered | By Pump Type (Centrifugal, Positive Displacement and Cryogenic), By Capacity (Small (up to 500 gpm), Medium (500-1000 gpm) and High (more than 1000 gpm)), By Application (Upstream, Midstream and Downstream), By End User (Oil & Gas Industry, Chemical Industry, Power Industry and Others) |
| Regional Analysis | North America – The US & Canada; Europe – Germany, France, The UK, Spain, Italy, Russia & CIS, Rest of Europe; APAC– China, Japan, South Korea, India, ASEAN & Rest of APAC; Latin America– Brazil, Mexico & Rest of Latin America; Middle East & Africa– GCC, South Africa, & Rest of MEA |
| Competitive Landscape | Flowserve Corporation, Sulzer Ltd., KSB Group, Grundfos, Weir Group, Ebara Corporation, Baker Hughes, Schlumberger, NOV Inc., Xylem Inc., ITT Inc., Ruhrpumpen Group, SPX FLOW, Gardner Denver, Pentair, Ariel Corporation, Kirloskar Brothers Limited, Alfa Laval, CAT Pumps, DXP Enterprises, SPP Pumps, PCM, NETZSCH, Wastecorp Pumps, National Pump and Energy, Atlas Copco, Halliburton. |
| Customization Scope | Customization for segments, region/country-level will be provided. Moreover, additional customization can be done based on the requirements. |
| Purchase Options | We have three licenses to opt for: Single User License, Multi-User License (Up to 5 Users), Corporate Use License (Unlimited Users and Printable PDF) |





































