


Report Overview
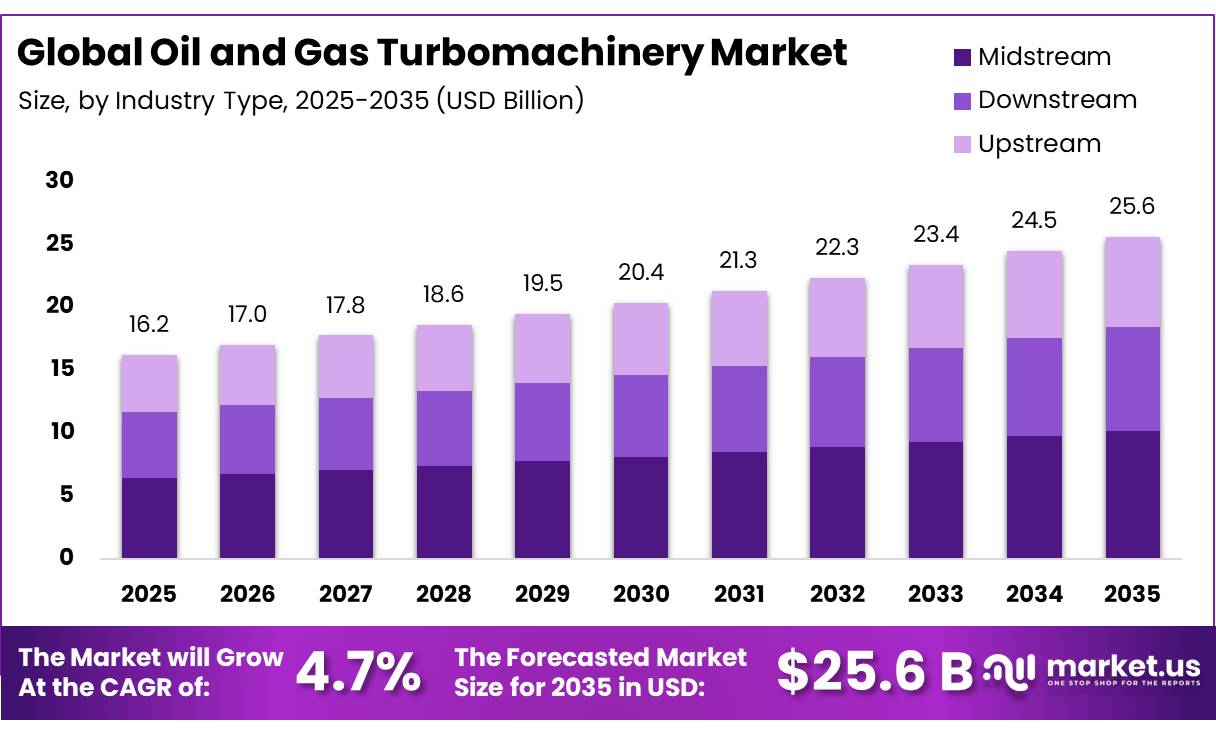
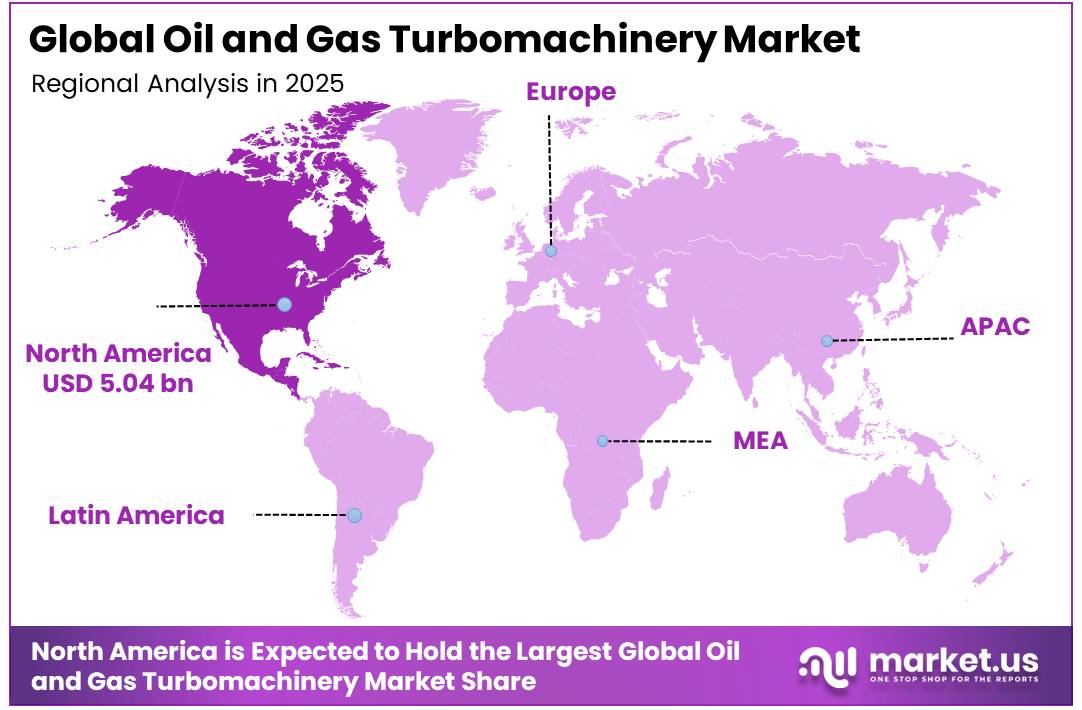
In 2025, the Global Oil and Gas Turbomachinery Market was valued at USD 16.2 billion, and between 2026 and 2035, this market is estimated to register a CAGR of 4.7%, reaching about USD 25.6 billion by 2035. North America held a dominant market position, capturing more than a 31.1% share, holding USD 5.04 billion in revenue.
The oil and gas turbomachinery market covers gas and steam turbines, compressors, pumps, expanders, and blowers used across production fields, pipelines, liquefied natural gas terminals, and refineries.
- In June 2025, the International Energy Agency estimated global upstream oil and gas investment at just under USD 570 billion, with 40% directed toward limiting output declines at existing fields. This spending supports replacement, uprating, and maintenance demand for rotating equipment operating under high pressure and continuous duty.
Key Takeaways
- The global Oil and Gas Turbo machinery Market was valued at USD 16.2 billion in 2025.
- The global Market is projected to grow at a CAGR of 4.7% and is estimated to reach USD 25.6 billion by 2035.
- On the basis of industry, the midstream segment dominated the market, constituting 39.8% of the total market share.
- Based on equipment type, gas and steam turbines dominated the oil and gas turbomachinery market, with a substantial market share of around 35.8%.
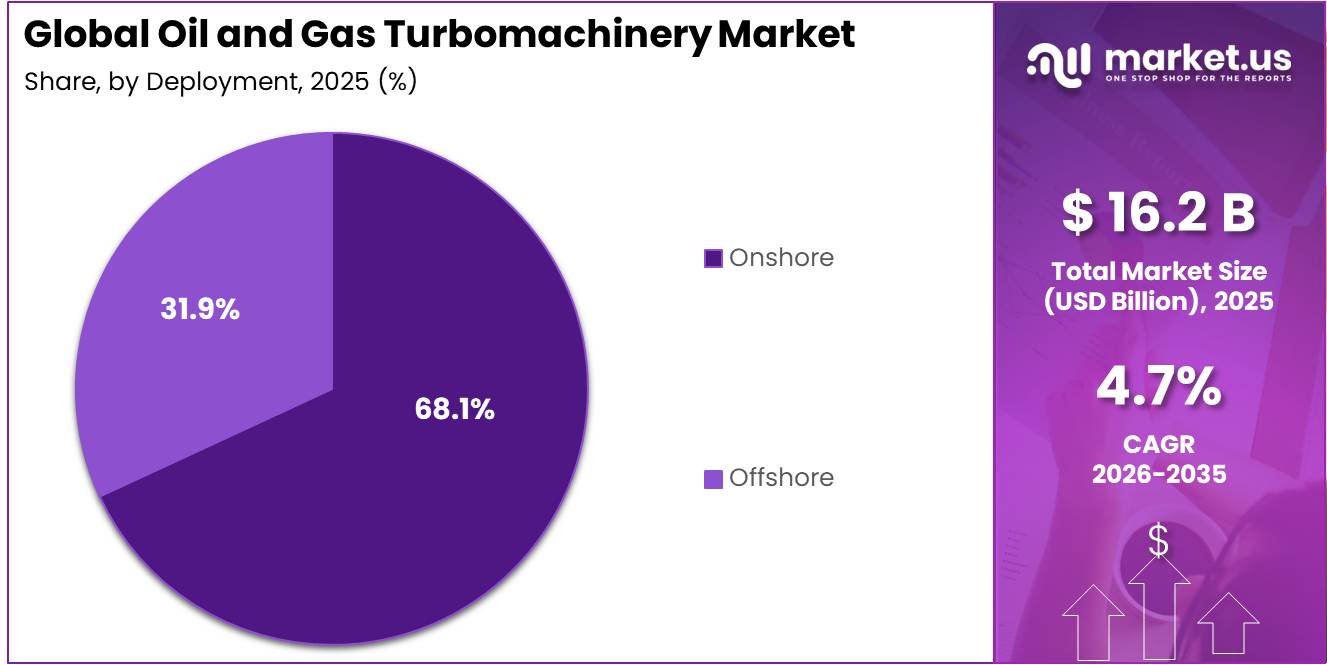
- Based on deployment, the onshore segment led the market, comprising 68.1% of the total market.
- In 2025, North America was the most dominant region in the oil and gas turbomachinery market, accounting for 31.1% of the total market share.
Industrial activity is increasingly tied to natural gas processing and export infrastructure. In October 2025, the United States Energy Information Administration projected North American liquefied natural gas export capacity to rise from 11.4 billion cubic feet per day at the beginning of 2024 to 28.7 billion cubic feet per day in 2029. New liquefaction trains, pipelines, and storage sites require compressor trains, turbine drives, cryogenic pumps, and dependable service support.
Demand is driven by ageing assets, offshore developments, refinery upgrades, and the need to reduce unplanned shutdowns. In March 2025, the United States Department of Energy authorized the CP2 liquefied natural gas project to export up to 3.96 billion cubic feet per day. The decision strengthens the project pipeline for high capacity compression and pumping systems, while digital monitoring, predictive maintenance, and modular equipment are helping operators improve availability and control lifecycle costs.
Growth opportunities are expanding around lower emission machinery, electrified compression, carbon capture, and fuel flexible turbines. In February 2026, Siemens Energy announced a USD 1 billion United States manufacturing expansion that includes gas turbine equipment and more than 1,500 skilled jobs. European methane rules are also raising demand for leak detection, compressor retrofits, and reduced venting systems. Suppliers that combine efficient equipment, remote diagnostics, aftermarket services, and emissions compliance can secure positions in onshore and offshore projects over the next investment cycle.
By Industry Analysis
Midstream leads with 39.8% as Downstream modernization accelerates
In 2025, Midstream held a dominant market position, capturing more than a 39.8% share. Pipeline transportation, gas processing, storage, and liquefied natural gas infrastructure depend on compressors, turbine drives, and pumps to maintain continuous flow. In February 2026, the United States Energy Information Administration reported that pipeline projects completed during 2025 added approximately 6.3 billion cubic feet per day of natural gas capacity, strengthening demand for dependable compression equipment.
- For instance, in April 2026, according to Baker Hughes, the company secured an order to supply three NovaLT16 gas turbines, three centrifugal compressors, and related services for an Argentine pipeline project supporting future liquefied natural gas exports.
Downstream is the fastest-growing segment as refineries, petrochemical plants, and fuel-processing facilities modernize ageing rotating equipment. Operators are adopting efficient compressor trains, process pumps, steam turbines, digital monitoring, and emission-control systems to improve plant availability and manage changing feedstocks. Expansion in cleaner fuels, hydrogen processing, and refinery conversion projects is also creating opportunities for equipment upgrades and long-term maintenance services.
By Equipment Type Analysis
Gas & steam turbines lead with 35.8% while gas compressors gain momentum
In 2025, Gas & steam turbines held a dominant market position, capturing more than a 35.8% share. Their leadership was supported by broad use in liquefied natural gas plants, refineries, pipeline stations, offshore platforms, and gas-processing facilities. These machines provide reliable mechanical drive and onsite power while handling continuous operating loads. Fuel flexibility, compact installation, quick start-up, and established maintenance networks also support their selection for new projects and equipment upgrades.
- For instance, in September 2025, according to Baker Hughes, the company secured an order from Bechtel to supply Frame 7 gas turbines, centrifugal compressors, and related services for the Rio Grande liquefied natural gas expansion in Texas.
Gas compressors are the growing segment because they are essential for pipeline transmission, gas gathering, storage, processing, reinjection, and liquefaction. Rising natural gas movement and plant modernization are encouraging operators to adopt efficient centrifugal and reciprocating systems. Digital condition monitoring, improved seals, modular packages, and lower-emission drive technologies are further strengthening replacement and aftermarket demand.
By Deployment
Onshore deployment dominates with 68.1% while Offshore demand gains momentum
In 2025, Onshores held a dominant market position, capturing more than a 68.1% share. Onshore fields, pipeline stations, gas-processing plants, storage facilities, and refineries require turbines, compressors, and pumps for continuous production and transportation. The segment remains preferred because equipment installation, inspection, repair, and replacement are generally easier at land-based sites. Established transport links and service networks also help operators limit downtime and manage operating costs.
- For instance, in October 2025, according to GE Vernova, the company opened an aeroderivative gas turbine repair centre in Argentina to strengthen outage support and component servicing for its regional turbine fleet.
Offshore is the growing segment as operators develop deepwater fields and upgrade floating production facilities. These projects require compact and durable turbomachinery for gas compression, water injection, power generation, and hydrocarbon transfer. Subsea processing, remote monitoring, equipment electrification, and maintenance systems designed for harsh marine conditions are further supporting adoption.
Key Market Segments
By Industry
- Midstream
- Downstream
- Upstream
By Equipment Type
- Gas & steam turbines
- Gas compressors
- Pumps
- Others (expanders, blowers, etc.)
By Deployment
- Onshore
- Offshore
Driver Analysis
LNG export buildout lifting large-train compression demand
Natural-gas investment is projected to rise to about USD 330 billion in 2026, while LNG investment is expected to more than double versus 2025 as more than 230 bcm of projects move toward peak construction, creating a direct pull for refrigeration compressors, mechanical-drive turbines, helper motors, and associated controls packages. In the U.S. alone, EIA expects LNG gross exports to rise 19% to 14.2 Bcf/d in 2025 and another 15% to 16.4 Bcf/d in 2026, and notes that three new U.S. facilities together add 5.3 Bcf/d nominal capacity, or almost 50% over existing export capacity once fully operational.
That matters structurally because each liquefaction train start-up compresses years of turbomachinery procurement into a narrow EPC window: procurement shifts toward fewer but larger, high-availability compressor strings, suppliers gain pricing power on rotors, dry-gas seals, and long-lead castings, and aftermarket revenue begins almost immediately after commissioning through service agreements, condition monitoring, and performance optimization.
Drivers Impact Analysis
| Driver | (~) % Impact on CAGR Forecast | Geographic Relevance | Impact Timeline |
|---|---|---|---|
| LNG export buildout lifting large-train compression demand | +1.4% | North America core, Qatar/GCC core, APAC import-linked spill-over | Short term (≤ 2 years) |
| Methane compliance accelerating compressor replacement and seal upgrades | +0.9% | EU core, North America core, Middle East export corridors | Short term (≤ 2 years) |
| Brownfield efficiency retrofits improving fuel burn and availability economics | +0.8% | North America, EU, Middle East, mature APAC assets | Medium term (2-4 years) |
| Gas-processing and pipeline debottlenecking tied to rising gas flows | +1.0% | U.S. Gulf Coast, Latin America, Africa, Central Asia | Medium term (2-4 years) |
| Carbon capture, reinjection, and low-carbon gas projects expanding high-pressure duty | +0.7% | North America core, EU, Middle East hubs | Medium term (2-4 years) |
| Alternative-fuel readiness and digital service models reshaping package selection | +0.5% | EU, Japan/Korea, North America, selective GCC projects | Long term (≥ 4 years) |
Restraint Analysis
OEM turbine and compressor capacity bottlenecks
Internal modeling for 2026 assumes that a typical heavy‑duty turbine or large compressor string lead time has stretched by 6–9 months relative to pre‑pandemic norms, with effective calendar availability constrained by castings, forgings, control electronics, and qualified supplier capacity; this pushes EPC timelines beyond internal hurdle windows, forces developers to re‑sequence mechanical completion, and increases IDC by low‑single‑digit percentages on multi‑billion‑dollar projects, wiping out portions of the net present value that would otherwise justify marginal trains or brownfield expansions.
Strategically, OEM capacity bottlenecks compress margins because vendors face penalty exposure under delay clauses while simultaneously absorbing higher overtime, premium freight, and inventory carrying costs; at the same time operators respond by downsizing or deferring smaller projects that lack political or contractual priority, which justifies a roughly 1.5–1.7 percentage‑point drag on otherwise attainable market CAGR over the 2026–2028 window in North America, Europe, and key APAC manufacturing hubs.
Restraint Impact Analysis
| Restraint | (~) % Impact on CAGR | Geographic Relevance | Impact Timeline |
|---|---|---|---|
| OEM turbine and compressor capacity bottlenecks | -1.6% | North America core, EU, APAC major OEM hubs | Short term (≤ 2 years) |
| Permitting, regulatory and policy uncertainty | -1.4% | North America core, EU, selected APAC | Medium term (2-4 years) |
| Hydrocarbon price and demand volatility | -1.2% | Global upstream and LNG corridors | Medium term (2-4 years) |
| Skilled workforce and field-service shortages | -0.9% | North America, EU, Middle East, APAC | Short term (≤ 2 years) |
| Upstream reserve maturity and cautious CapEx | -1.3% | Asia (Indonesia, SE Asia), Africa, LatAm | Long term (≥ 4 years) |
| Capital discipline and OEM backlog concentration | -1.0% | Global IOCs, NOCs, and EPCs | Medium term (2-4 years) |
Opportunity Analysis
Oil-free and contamination-free turbomachinery platforms
The white space lies in targeting gas‑processing, petrochemical, and high‑purity industrial users with compressor and turbine packages that eliminate oil from the flow path and drastically reduce maintenance: if oil‑free systems can credibly cut lube‑related maintenance costs by 30–40%, lower unplanned downtime by a few dozen hours per unit annually, and avoid product loss or contamination incidents, then OEMs can justify premium ASPs and service margins while winning share from incumbent designs.
Internal TAM modeling suggests that only a small single‑digit percentage of installed gas compression capacity in oil‑and‑gas‑adjacent sectors is currently oil‑free, leaving a multi‑billion‑dollar retrofit and replacement pool by 2035 as operators refresh assets under tightening ESG and quality requirements; capturing even 20–30% of that pool via dedicated platforms could add around 1 percentage point of CAGR above baseline for participating vendors, especially in North America, Europe, and APAC industrial corridors where contamination regulation and product purity standards are most stringent.
Opportunity Impact Analysis
| Opportunity | (~) % Potential CAGR Upside | Geographic Relevance | Execution Window |
|---|---|---|---|
| Oil-free and contamination-free turbomachinery platforms | +1.2% | North America, EU, APAC industrial hubs | Medium term (2-4 years) |
| Methane abatement turnkey packages for developing producers | +1.5% | Africa, LatAm, Middle East, APAC emerging | Medium term (2-4 years) |
| Digital performance and emissions optimization SaaS | +1.0% | Global LNG and pipeline corridors | Short term (≤ 2 years) |
| Hydrogen-ready and compressorless turbine solutions | +1.3% | EU, North America, Japan/Korea | Long term (≥ 4 years) |
| Marine and small-scale LNG turbomachinery expansion | +0.8% | Global shipping hubs, APAC, EU | Medium term (2-4 years) |
| M&A roll-up of regional service shops into global networks | +0.7% | Africa, Middle East, APAC, LatAm | Medium term (2-4 years) |
Challenges Analysis
Volatile component and logistics chains
For turbomachinery specifically, complex castings, forgings, advanced alloys, power electronics, and control modules are sourced through multi‑tier global chains exposed to trade tensions, export controls, and transportation bottlenecks; internal modeling suggests that average transit times for critical components have lengthened by 20–30% compared with pre‑pandemic baselines, with high variance, while spot freight and logistics costs have seen mid‑teens percentage increases in volatile periods.
Strategically, the industry must invest in diversified supplier bases, localized manufacturing where feasible, and robotics and automation for warehousing and materials handling to build resilience; until such efforts are fully implemented, component and logistics volatility plausibly subtracts around 1.0–1.2 percentage points from peak attainable CAGR, particularly in North America, Europe, and APAC logistics corridors heavily exposed to global trade routes.
Challenges Impact Analysis
| Challenge | (~) % CAGR Friction Drag | Geographic Relevance | Mitigation Horizon |
|---|---|---|---|
| Complex multi-layer environmental compliance | -1.3% | EU regulatory hubs, North America core, OECD APAC | Long term (≥ 4 years) |
| Volatile component and logistics chains | -1.1% | North America, EU, APAC logistics corridors | Medium term (2-4 years) |
| Control-system reliability and integration gaps | -0.9% | Global large-project EPC corridors | Medium term (2-4 years) |
| Fuel-quality variability and operational instability | -0.8% | Emerging markets, remote upstream and midstream | Short term (≤ 2 years) |
| Data, diagnostics, and skilled talent scarcity | -1.0% | Global OEMs and service networks | Long term (≥ 4 years) |
| Gear unit and mechanical wear uncertainty | -0.7% | Mature asset fleets in North America, EU, Middle East | Medium term (2-4 years) |
Geopolitical Impact Analysis
Trade Barriers and Energy Realignment Reshaping Turbomachinery Supply Chains
Geopolitical competition is reshaping the oil and gas turbomachinery market through metal tariffs, changing energy trade routes, sanctions, and higher logistics risks. Turbines, compressors, and pumps depend on specialized steel, aluminium, precision components, and international service networks. As governments prioritize energy security and domestic manufacturing, suppliers are reconsidering sourcing locations, inventories, and regional production strategies.
- In June 2025, the White House increased United States tariffs on imported steel and aluminium from 25% to 50%, effective June 4. This measure can raise input costs for turbine casings, compressor skids, pump assemblies, shafts, and supporting structures when imported metals are used. It also encourages manufacturers to qualify domestic suppliers, although switching sources may extend testing and procurement periods.
Energy realignment is also changing equipment demand across Europe. In February 2026, the European Commission reported that the share of Russian gas in European Union imports had fallen from 45% in 2022 to 12% in 2025. The shift toward alternative pipeline and liquefied natural gas supplies supports compressor-station modifications, terminal upgrades, and flow-reversal projects, while reducing service opportunities connected with Russian infrastructure.
Shipping instability adds another layer of risk. In September 2025, United Nations Trade and Development projected seaborne trade growth of only 0.5% for the year, while geopolitical rerouting had produced nearly 6% growth in ton-miles during 2024. Longer voyages and volatile freight rates can delay heavy turbomachinery deliveries, increase project costs, and encourage regional assembly, dual sourcing, and larger spare-parts inventories.
Regional Analysis
North America Leads with 31.1% and US$5.04 Billion
In 2025, North America held a dominant position in the oil and gas turbomachinery market, capturing a 31.1% share valued at USD 5.04 billion. Regional leadership was supported by upstream production, pipeline networks, processing plants, liquefied natural gas facilities, and refinery operations requiring turbines, compressors, and pumps.
- In March 2026, the United States Energy Information Administration reported that United States crude oil production reached a record 13.6 million barrels per day in 2025.
Canada strengthened equipment demand, as the Canada Energy Regulator stated in May 2026 that natural gas production averaged about 19.0 billion cubic feet per day during 2025. Asia Pacific is developing as a growth region, supported by gas production, refining additions, offshore projects, and industrial energy demand. In January 2026, China’s National Bureau of Statistics reported natural gas output of 261.9 billion cubic metres for 2025, supporting opportunities for compression, pumping, processing, and maintenance systems across regional facilities.
Key Regions and Countries Covered
- North America
- The US
- Canada
- Europe
- Germany
- France
- The UK
- Spain
- Italy
- Russia & CIS
- Rest of Europe
- APAC
- China
- Japan
- South Korea
- India
- ASEAN
- Rest of APAC
- Latin America
- Brazil
- Mexico
- Rest of Latin America
- Middle East & Africa
- GCC
- South Africa
- Rest of MEA
Key Players Analysis
Competition in the oil and gas turbomachinery market is shaped by equipment specialization, project execution capability, and long-term service coverage rather than product availability alone. Baker Hughes holds a strong competitive position in liquefied natural gas and pipeline applications through its integrated gas turbine and centrifugal compressor packages.
Siemens Energy competes through industrial and aeroderivative turbines, turbo and reciprocating compressors, electrification systems, remote diagnostics, and predictive maintenance solutions for onshore and offshore operations.
MAN Energy Solutions strengthens its position through customized compressor, turbine, expander, and machinery-train packages for refineries, pipelines, and floating production facilities. Sulzer is more specialized in high-pressure water-injection, main oil-line, multiphase, and pipeline pumps, supported by repair and rotating-equipment services. Atlas Copco focuses on centrifugal compressors, oil-free gas screw compressors, and turboexpanders used in gas processing and refinery applications.
Market Key Players
- General Electric (GE Vernova)
- Siemens Energy AG
- Mitsubishi Power
- MAN Energy Solutions SE
- Solar Turbines Incorporated
- Ansaldo Energia S.p.A.
- Kawasaki Heavy Industries, Ltd.
- Sulzer Ltd
- Elliott Group
- Atlas Copco AB
- Baker Hughes Company
- Rolls‑Royce Holdings
- Air Products & Chemicals, Inc.
- Kobe Steel, Ltd.
- Harbin Electric Corporation
- Others
Key Development
- In 2025, General Electric invested in expanding turbine production capacity and service infrastructure, including upgrades at major manufacturing locations in the United States and Europe. GE Vernova also announced plans to invest approximately USD 600 million in U.S. manufacturing facilities and workforce development, supporting production expansion for energy equipment and strengthening domestic supply chains.
- In 2025, Siemens Energy highlighted its compression technology portfolio, including solutions for different gases such as natural gas, hydrogen, and carbon dioxide, supporting both traditional oil and gas operations and emerging low-carbon applications. Its Transformation of Industry business reported EUR 5.7 billion in revenue in 2025, with compression solutions contributing to industrial and energy sector applications.
- In September 2025, Mitsubishi Power secured a major contract with Taiwan Power Company for the Tung Hsiao Power Plant project, supplying five JAC gas turbines as part of a 2,800 MW gas turbine combined cycle (GTCC) project. The total turnkey engineering, procurement, and construction contract was valued at approximately JPY 760 billion (around USD 5.2 billion), highlighting Mitsubishi Power’s strong position in large-scale turbomachinery projects.
- Solar Turbines Incorporated mid-sized industrial gas turbines ranging from 1 MW to 39 MW and has installed more than 17,000 turbine units across over 100 countries, generating more than 3 billion operating hours globally. These technologies are widely used by oil and gas operators for mechanical drive applications, gas compression, and distributed power generation, where reliability and lower operational downtime are important factors.
Report Scope
| Report Features | Description |
|---|---|
| Market Value (2025) | USD 16.2 Bn |
| Forecast Revenue (2035) | USD 25.6 Bn |
| CAGR (2026-2035) | 4.7% |
| Base Year for Estimation | 2025 |
| Historic Period | 2020-2024 |
| Forecast Period | 2026-2035 |
| Report Coverage | Revenue Forecast, Market Dynamics, Competitive Landscape, Recent Developments |
| Segments Covered | By Industry (Midstream, Downstream, and Upstream), By Equipment Type (Gas & Steam Turbines, Gas Compressors, Pumps, and Others), By Deployment (Onshore and Offshore) |
| Regional Analysis | North America – The US & Canada; Europe – Germany, France, The UK, Spain, Italy, Russia & CIS, Rest of Europe; APAC- China, Japan, South Korea, India, ASEAN & Rest of APAC; Latin America- Brazil, Mexico & Rest of Latin America; Middle East & Africa- GCC, South Africa, & Rest of MEA |
| Competitive Landscape | General Electric (GE Vernova), Siemens Energy AG, Mitsubishi Power, MAN Energy Solutions SE, Solar Turbines Incorporated, Ansaldo Energia S.p.A., Kawasaki Heavy Industries, Ltd., Sulzer Ltd, Elliott Group, Atlas Copco AB, Baker Hughes Company, Rolls-Royce Holdings, Air Products & Chemicals, Inc., Kobe Steel, Ltd., Harbin Electric Corporation, and others. |
| Customization Scope | Customization for segments, region/country-level will be provided. Moreover, additional customization can be done based on the requirements. |
| Purchase Options | We have three licenses to opt for: Single User License, Multi-User License (Up to 5 Users), Corporate Use License (Unlimited Users and Printable PDF) |





































