


Report Overview
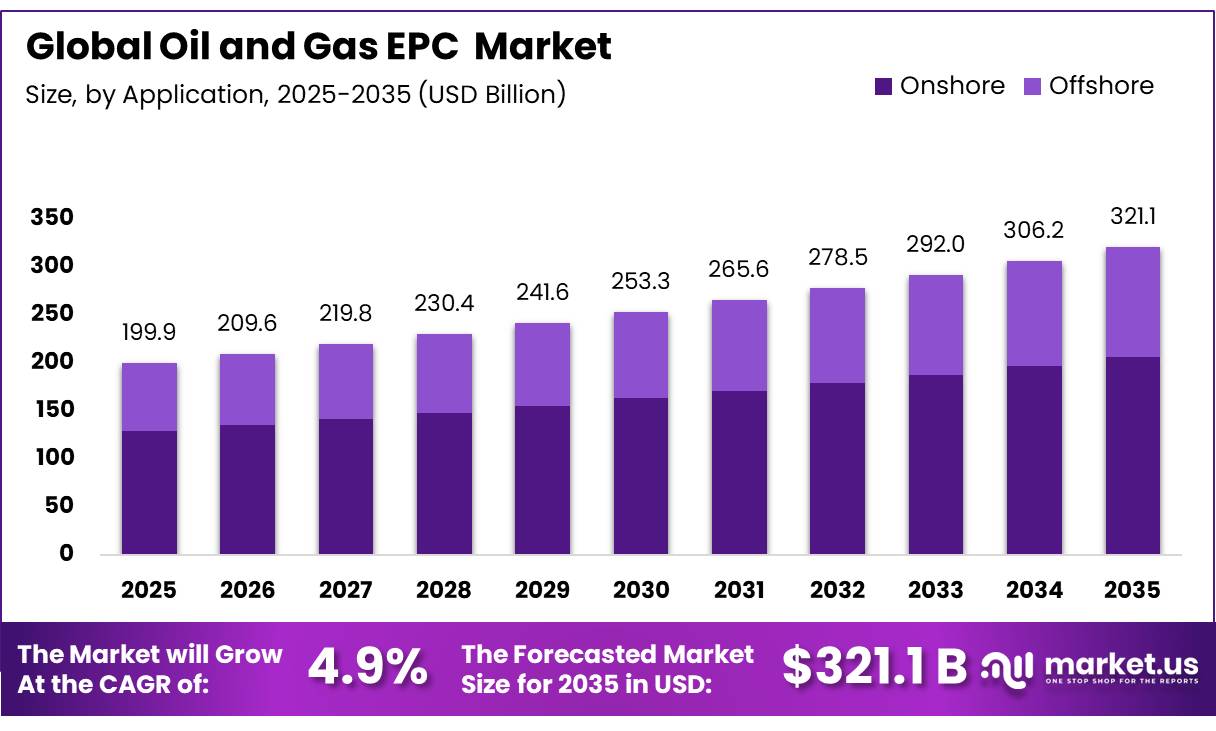
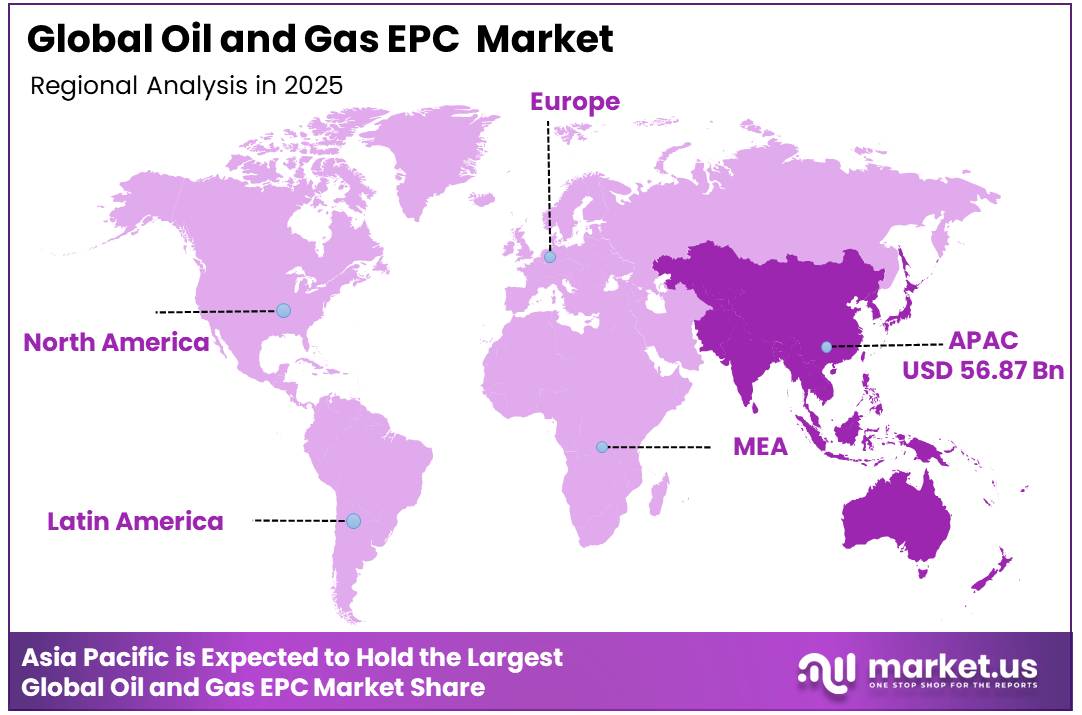
In 2025, the Global Oil and Gas EPC Market was valued at USD 199.9 billion, and between 2026 and 2035, this market is estimated to register a CAGR of 4.9%, reaching about USD 321.1 billion by 2035. Asia-Pacific held a dominant market position, capturing more than 28.5% share and generating USD 56.87 billion in revenue.
The oil and gas EPC market is the global industry built around companies that are hired to design, source, and build the physical infrastructure that the world’s energy systems depend on. When an oil company discovers a new field and needs to build a production facility, or when a government wants to construct a new LNG terminal to import gas, or when a refinery needs to be upgraded to meet new environmental standards they do not do it themselves. They hire an EPC contractor.
- In October 2025, according to the U.S. Energy Information Administration, North American LNG export capacity was projected to rise from 11.4 billion cubic feet per day in early 2024 to 28.7 billion cubic feet per day by 2029, supported by projects already under construction.
Key Takeaways
- The global oil and gas EPC market was valued at USD 199.9 billion in 2025.
- The market is projected to grow at a CAGR of 4.9% and is estimated to reach USD 321.1 billion by 2035.
- On the basis of service type, construction dominated the market, constituting 35.3% of the total market share.
- Based on the sector, upstream dominated the oil and gas EPC market, with a substantial market share of around 45.8%.
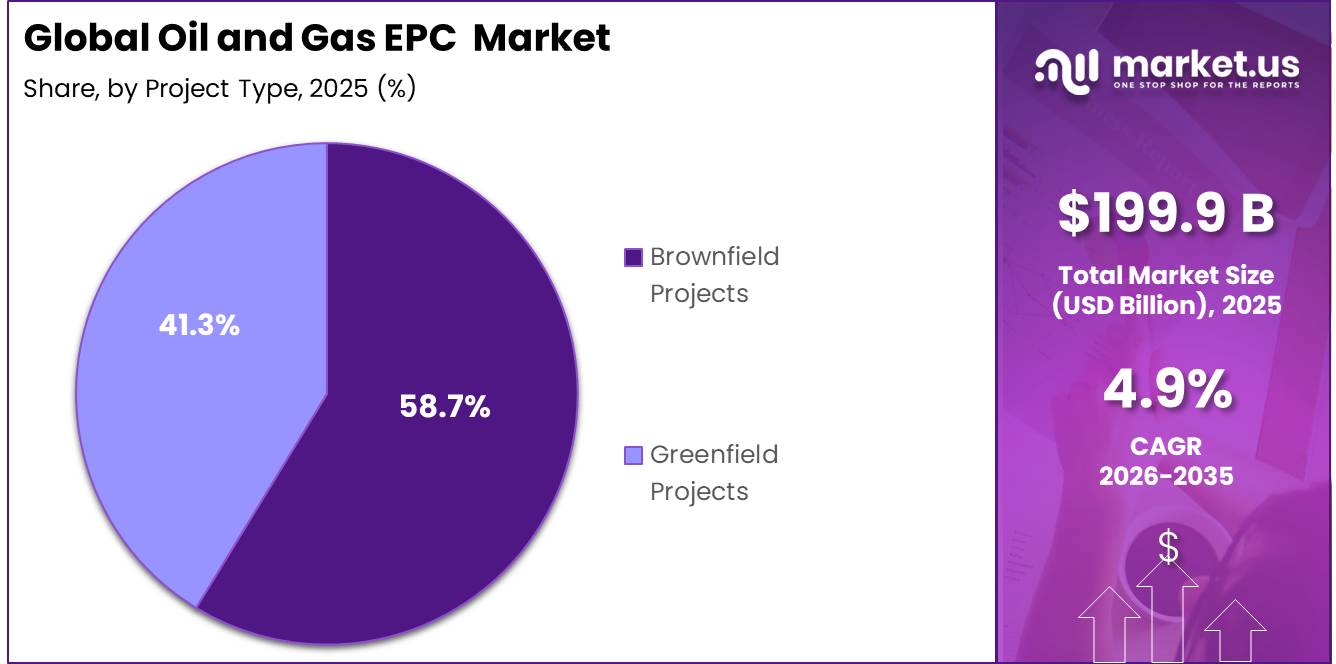
- Based on the project type, brownfield projects led the market, comprising 58.7% of the total market.
- Based on the application, onshore held a major share in the oil and gas EPC market, accounting for 64.4% of the market share.
- Among the end-users, national oil companies are the most considerable within the market, accounting for around 48.9% of the revenue.
- In 2025, Asia-Pacific was the most dominant region in the oil and gas EPC market, accounting for 28.5% of the total global consumption.
The word EPC literally describes exactly what these companies do Engineer, Procure, Construct and the oil and gas industry relies on them for virtually every major piece of energy infrastructure built anywhere in the world. Without EPC contractors, there would be no new refineries, no new pipelines, no new offshore platforms, and no new LNG terminals which means no new energy supply for a world that needs more of it every single year. The reason this market keeps growing is straightforward the world still runs on oil and gas, and the infrastructure needed to produce, transport, and process these resources requires constant investment, expansion, and modernisation.
- In July 2026, according to the U.S. Energy Information Administration, U.S. crude oil production averaged a record 13.6 million barrels per day in 2025, exceeding the previous record of 13.2 million barrels per day in 2024.
Global energy demand continues to rise driven by population growth, urbanisation, and industrial expansion across Asia, Africa, and the Middle East and governments and energy companies alike are responding with significant new project pipelines across upstream exploration, midstream pipeline and LNG infrastructure, and downstream refining capacity.
- In 2025, according to the U.S. Energy Information Administration, global petroleum and other liquid-fuel supply averaged approximately 104.4 million barrels per day during the first half of the year, of which 79.8 million barrels per day, or nearly 76%, moved through seaborne trade.
At the same time, the energy transition is creating its own EPC opportunity as operators invest in decarbonising their existing facilities, integrating carbon capture systems, and building out the LNG infrastructure that serves as the bridge fuel between today’s hydrocarbon economy and tomorrow’s clean energy future. Digital transformation is also reshaping how EPC projects are delivered with AI, digital twins, and advanced project management systems improving execution efficiency, reducing cost overruns, and making complex multi-billion dollar projects more manageable than they have ever been before.
Service Type Analysis
Construction Represents the Dominant Segment in the Market.
Construction leads the oil and gas EPC service type segment with 35.3% share and its dominance reflects the sheer physical scale and capital intensity of the projects this industry delivers. Building an oil refinery, an LNG terminal, an offshore platform, or a cross-country pipeline involves an extraordinary volume of civil, structural, mechanical, electrical, and instrumentation work that must be executed simultaneously, safely, and precisely in often challenging and remote environments.
Construction is where the largest portion of EPC project budgets is spent, where the majority of on-site workforce is deployed, and where project schedule performance is most directly determined. For EPC contractors, construction execution capability encompassing skilled labour management, heavy lift and installation expertise, modular construction capability, and rigorous safety management is the most fundamental competitive differentiator in winning and successfully delivering major oil and gas projects globally.
- For instance, in December 2024, Woodside Energy signed a revised lump-sum turnkey EPC contract with Bechtel for the construction of Louisiana LNG’s three-train foundation development, with a combined production capacity of 16.5 million tonnes per annum.
Sector Analysis
Upstream Represents the Dominant Sector in the Market.
Upstream accounts for 45.8% of total oil and gas EPC demand the largest sector share because exploration and production is where the fundamental investment in finding, accessing, and extracting oil and gas resources takes place. Every new field development, whether onshore or offshore, requires significant EPC services to design and build the wells, processing facilities, gathering systems, and export infrastructure needed to bring production to market.
The upstream sector’s EPC demand is directly driven by global oil and gas prices when prices are high and operators are cash-generative, upstream capital expenditure expands and EPC project pipelines grow accordingly. The current environment of sustained energy prices and strong operator cash flows has created one of the most active upstream EPC project pipelines in recent years, with major developments advancing simultaneously across the Middle East, West Africa, North America, and Southeast Asia.
Midstream EPC is fastest growing segment growth is driven by the unprecedented global investment in LNG liquefaction and regasification infrastructure as countries across Europe, Asia, and the Americas invest in the pipeline and terminal infrastructure needed to trade liquefied natural gas across the world’s energy markets.
- For instance, in September 2024, Saipem was awarded an offshore EPC contract in Qatar worth approximately USD 4 billion, reinforcing strong upstream oil and gas investment activity and highlighting continued project momentum in large-scale offshore developments within the global upstream engineering, procurement and construction market driven by sustained energy demand and expansion.
Project Type Analysis
Brownfield Projects Represent the Dominant Segment in the Market.
Brownfield projects account for 58.7% of total oil and gas EPC demand the dominant project type share because the majority of the world’s oil and gas production comes from existing fields and facilities that require continuous investment to maintain output, extend operational life, improve efficiency, and meet evolving safety and environmental standards. Brownfield EPC work encompasses a broad spectrum of activity from debottlenecking and capacity expansion to full facility modernisation, equipment replacement, and the integration of new technologies into operating assets.
Greenfield projects represent the most capital-intensive and technically ambitious segment of oil and gas EPC activity involving the design and construction of entirely new facilities in previously undeveloped locations. While more cyclical in nature than brownfield work, greenfield EPC is seeing strong growth driven by major new field developments in Guyana, Mozambique, Namibia, and the deepwater basins of West Africa as well as the wave of new LNG liquefaction projects being sanctioned across the United States, Qatar, and East Africa to meet growing global gas demand.
Application Analysis
Onshore Represents the Dominant Application Segment in the Market.
Onshore applications account for 64.4% of total oil and gas EPC demand the largest share because the majority of the world’s oil and gas production infrastructure, including refineries, gas processing plants, pipelines, and storage facilities, is land-based. Onshore EPC projects generally offer more accessible working environments, more established logistics and supply chains, and more predictable execution conditions than offshore work making them faster to deliver, less costly to execute, and easier to staff and manage at scale.
- In March 2026, according to the U.S. Energy Information Administration, shale and tight formations within the onshore Permian Basin produced 6.0 million barrels of crude oil per day in December 2025, accounting for 44% of total U.S. oil production. The wider Permian region produced 6.7 million barrels per day during the same month, showing the large scale of land-based production infrastructure requiring drilling facilities, gathering networks, pipelines and processing systems.
Offshore applications represent the most technically challenging, most capital-intensive, and in many ways the most strategically important segment of the oil and gas EPC market. Offshore projects including fixed platforms, floating production systems, subsea installations, and deepwater developments require specialist engineering capabilities, heavy marine construction assets, and rigorous project management systems that only a small number of global EPC contractors possess.
End-User Analysis
National Oil Companies Represent the Dominant End-User Segment in the Market.
National oil companies account for 48.9% of total oil and gas EPC demand the largest end-user share and this reflects the fundamental reality that the world’s largest oil and gas reserves are owned and developed by state-controlled energy entities. Saudi Aramco, ADNOC, QatarEnergy, Petrobras, NIOC, and CNPC collectively control a staggering proportion of the world’s proven hydrocarbon reserves and are among the largest capital spenders in the entire global energy sector.
- In March 2026, Saudi Aramco reported upstream capital expenditure of USD 37.77 billion for 2025, reflecting its continued focus on expanding gas production, maintaining crude oil capacity, developing new fields, upgrading processing facilities, and strengthening pipelines and related infrastructure.
Key Market Segments
By Service Type
- Construction
- Engineering
- Procurement
- Project Management
- Commissioning
- Others
By Sector
- Upstream
- Midstream
- Downstream
By Project Type
- Brownfield Projects
- Greenfield Projects
By Application
- Onshore
- Offshore
By End-User
- National Oil Companies
- International Oil Companies
- Independent Oil Companies
- Others
Driver Analysis
LNG export buildout and gas monetization wave
The clearest 2026 EPC growth engine is the post-FID LNG construction cycle. The IEA’s LNG tracker shows nearly 295 bcm/year of new LNG export capacity scheduled to come online between 2025 and 2030 from projects already sanctioned or under construction, with annual post-FID additions rising from around 33 bcm/year in 2025 to about 70 bcm/year in 2027, which mechanically enlarges EPC order books for liquefaction trains, storage tanks, marine loading, gas pretreatment, pipelines, and utility packages.
The IEA also indicates global upstream investment rises only marginally in 2026, while natural-gas-oriented spending is the stronger pocket of activity; Reuters’ summary of the IEA report notes gas investment is set to increase by more than 10% to about $330 billion in 2026, the highest in a decade, while oil supply investment remains below $500 billion.
Drivers Impact Analysis
| Driver | (~) % Impact on CAGR Forecast | Geographic Relevance | Impact Timeline |
|---|---|---|---|
| LNG export buildout and gas monetization wave | +2.4% | North America core, Middle East, East Africa, APAC import corridors | Medium term (2-4 years) |
| Methane compliance and low-emission retrofit EPC | +1.6% | EU-linked supply chains, North America, Middle East exporters, selected Africa LNG corridors | Short term (≤ 2 years) |
| Brownfield debottlenecking and late-life asset extension | +1.3% | Middle East core, North America, Latin America, offshore Africa | Short term (≤ 2 years) |
| Refining and petrochemical upgrade spending for margin defense | +1.1% | Asia-Pacific core, Middle East, U.S. Gulf Coast, South America spill-over | Medium term (2-4 years) |
| Energy security diversification after supply route disruption | +1.5% | Europe-linked import system, East Mediterranean, Africa, India, Southeast Asia | Medium term (2-4 years) |
| Cost inflation, labor scarcity, and modular execution shift | +0.9% | North America core, Australia, Middle East megaproject zones, selected EU industrial clusters | Long term (≥ 4 years) |
Restraint Analysis
Cost inflation in EPC inputs
Persistent input-cost inflation remains a primary restraint because oil and gas EPC contracts are still exposed to steel, pipe, valve, compressor, freight, and site-services repricing faster than owners can fully rebase budgets, especially on lump-sum turnkey structures; in Europe, Eurostat’s producer-price index for steel tubes, pipes and related fittings moved from 113.2 in July 2025 to 115.9 by April 2026, indicating renewed equipment-chain firmness rather than full normalization, while in the U.S. construction and extraction occupations carried a 2025 annual mean wage of $65,360 and core construction trades such as carpenters averaged $66,470, embedding labor-cost escalation into fabrication-yard and field-installation economics.
The commercial effect is that even a mid-single-digit rise in bulk materials or labor can compress EPC EBIT margins by 100 to 250 basis points on fixed-price packages where change-order recovery lags, forcing sponsors to split awards, delay FIDs, or narrow scope on brownfield revamps, and this is most acute in import-dependent APAC and EU corridors where pipe, fittings, and rotating equipment cost pass-through remains uneven.
Restraint Impact Analysis
| Restraint | (~) % Impact on CAGR Forecast | Geographic Relevance | Impact Timeline |
|---|---|---|---|
| Cost inflation in EPC inputs | -1.4% | North America core, EU, APAC import corridors | Short term (≤ 2 years) |
| Skilled labor scarcity | -1.1% | U.S., Canada, North Sea, GCC, Australia | Medium term (2-4 years) |
| Methane and emissions compliance | -0.9% | U.S. core, UK, EU linked assets | Medium term (2-4 years) |
| Decommissioning liability overhang | -0.8% | U.S. offshore, North Sea mature basins | Long term (≥ 4 years) |
| Price volatility and CapEx deferral | -1.6% | Global upstream hubs | Short term (≤ 2 years) |
| Permit and policy uncertainty | -0.7% | U.S. offshore, India, selected EU basins | Medium term (2-4 years) |
Opportunity Analysis
LNG megaproject modularization
This is an opportunity rather than a current driver because the baseline market already captures ordinary upstream and gas-processing EPC spend, whereas the incremental upside comes from EPC firms repositioning into factory-built, repeatable LNG train modules, electrified compression packages, and owner-side schedule-risk transfer models that can monetize the coming capacity wave more efficiently than conventional project delivery.
The IEA states that nearly 295 bcm/year of new LNG export capacity is expected online between 2025 and 2030 from projects already under construction or post-FID, while the EIA indicates U.S. LNG exports rose to about 15 bcf/d in 2025 and are expected to exceed 18.1 bcf/d in 2027, creating a dense queue of execution demand that favors standardized engineering libraries, procurement aggregation, and module-yard utilization over bespoke EPC contracts.
For leading EPC players, the white space is to convert that wave into annuity-like monetization through modular FEED-to-EPC conversion, package replication across 3 to 5 train blocks, and digital commissioning services that can plausibly cut on-site labor hours by 15% to 25%, reduce schedule slippage by 4 to 8 months on large liquefaction trains, lift EPC gross margins by 150 to 300 basis points, and expand serviceable LNG-related EPC TAM by roughly $35 billion to $55 billion cumulatively through 2030 beyond what traditional reimbursable contracting would capture.
Opportunity Impact Analysis
| Opportunity | (~) % Potential CAGR Upside | Geographic Relevance | Execution Window |
|---|---|---|---|
| LNG megaproject modularization | +2.2% | North America core, Qatar, East Africa | Short term (≤ 2 years) |
| Decommissioning EPC scale-up | +1.6% | U.S. Gulf core, North Sea | Short term (≤ 2 years) |
| CO2 storage EPC platforms | +1.9% | EU core, U.K., North America | Medium term (2-4 years) |
| Hydrogen corridor balance-of-plant | +1.4% | U.S., Middle East, EU | Medium term (2-4 years) |
| Brownfield digital revamp bundles | +1.2% | Middle East, Latin America, Asia | Short term (≤ 2 years) |
| Offshore energy conversion reuse | +1.0% | Gulf of Mexico, North Sea, SE Asia | Long term (≥ 4 years) |
Challenges Analysis
Complex regulatory & ESG compliance
Government documentation across energy and environmental portfolios illustrates the proliferation of reporting and compliance requirements for example, annual environmental reports for strategic petroleum storage, detailed emissions monitoring, and multi‑layer permitting processes that extend pre‑construction phases by 6–12 months and introduce multi‑agency review sequences, raising pre‑FID overheads and legal expenditure.
For oil and gas EPC projects, this often translates into 10–20% increases in compliance‑related costs and a measurable uptick in schedule risk: permitting delays can add 3–6 months to project timelines, while ESG due diligence requirements, community consultations, and climate‑risk scenario modeling can add another 3–4 months, materially increasing the variance of start‑of‑construction dates.
The friction manifests as lower portfolio velocity; if a large EPC contractor manages a pipeline of 20–30 major projects, and average permitting and ESG compliance adds 6–9 months per asset, the effective annual throughput of new project starts can drop by 10–15%, contributing an estimated 0.8 percentage point drag on sector CAGR even though projects eventually proceed.
Strategically, mitigation over a ≥4‑year horizon requires institutionalizing compliance as an integrated design parameter rather than a parallel process: building internal regulatory intelligence units, deploying standardized ESG data platforms across projects, designing modular environmental baseline templates that cut study times by 20–30%, and engaging early with regulators to move from sequential to partially parallel review models, thereby lowering schedule dispersion and smoothing growth without diluting compliance standards.
Challenges Impact Analysis
| Challenge | (~) % CAGR Friction Drag | Geographic Relevance | Mitigation Horizon |
|---|---|---|---|
| Persistent schedule overruns | -1.6% | Middle East & Asia core, North America upstream | Medium term (2-4 years) |
| Cost inflation & contract risk | -1.2% | Global EPC hubs, North America, EU | Medium term (2-4 years) |
| Skilled workforce deficit | -0.9% | Global, especially MENA, APAC, Sub-Saharan Africa | Long term (≥ 4 years) |
| Complex regulatory & ESG compliance | -0.8% | EU regulatory hubs, North America core, selected Latin America | Long term (≥ 4 years) |
| Supply chain & logistics bottlenecks | -1.1% | APAC logistics corridors, Middle East megaproject clusters | Medium term (2-4 years) |
| Digital integration & cyber-operational risk | -0.7% | Global majors and NOCs adopting advanced EPC tech | Long term (≥ 4 years) |
Geopolitical Impact Analysis
Energy Security Imperatives and Trade Disruptions Are Reshaping Global Oil and Gas EPC Project Pipelines
The oil and gas EPC market is one of the most directly and immediately affected industrial markets by geopolitical developments because energy security is a national strategic priority for virtually every government in the world, and the investment decisions that drive EPC project pipelines are fundamentally shaped by how governments and energy companies read the geopolitical environment.
The Russia-Ukraine conflict was the single most consequential geopolitical event for global energy markets in recent decades forcing European nations to rapidly restructure their energy supply relationships away from Russian pipeline gas and toward LNG imports from the US, Qatar, Norway, and other suppliers. This structural shift in global gas trade flows has created an enormous wave of LNG infrastructure EPC investment across both the supply side and the demand side of the market building new export liquefaction capacity in the US and Qatar while simultaneously constructing new import regasification terminals across Germany, Italy, the Netherlands, and beyond.
US tariff measures introduced in 2025 have added supply chain cost and procurement complexity to international EPC projects particularly affecting the cost of steel, specialised equipment, and engineering components that cross international borders in the execution of major projects. The concentration of fabrication yard capacity in Asia primarily South Korea, China, and Singapore and the geopolitical sensitivity of these relationships creates a structural supply chain vulnerability for EPC projects that depend on competitive Asian fabrication for their large structural and process modules.
Middle East geopolitical tension adds another layer of risk to the region that simultaneously represents one of the largest and most active oil and gas EPC markets in the world requiring EPC contractors and their clients to build more robust contingency planning and supply chain redundancy into their project execution strategies than was considered necessary in more geopolitically stable times.
Regional Analysis
Asia Pacific Leads the Global Oil and Gas EPC Market.
In 2025, Asia Pacific dominated the global oil and gas EPC market, holding 28.5% of total global consumption a leadership position built on the region’s status as the world’s largest and fastest-growing energy consuming region, combined with its enormous and continuously expanding oil and gas infrastructure investment programme.
China drives the largest share of Asia Pacific EPC activity through its massive refinery expansion and petrochemical complex development programme, its growing LNG import terminal network, and its upstream domestic gas field development activity. Southeast Asia particularly Malaysia, Indonesia, Vietnam, and Thailand is generating a growing pipeline of upstream and midstream EPC work as regional NOCs invest in new field developments and gas infrastructure to meet domestic energy demand.
Key Regions and Countries Covered
- North America
- The US
- Canada
- Europe
- Germany
- France
- The UK
- Spain
- Italy
- Russia & CIS
- Rest of Europe
- APAC
- China
- Japan
- South Korea
- India
- ASEAN
- Rest of APAC
- Latin America
- Brazil
- Mexico
- Rest of Latin America
- Middle East & Africa
- GCC
- South Africa
- Rest of MEA
Key Players Analysis
The global oil and gas EPC market is dominated by a relatively small number of large, technically sophisticated, and globally experienced EPC contractors that have the engineering capability, financial strength, procurement infrastructure, and construction execution capacity to take on the world’s most complex and capital-intensive oil and gas projects.
These leading contractors including Saipem, TechnipFMC, Bechtel, Fluor, McDermott, Wood Group, and Samsung Engineering collectively hold the dominant share of major EPC contract awards globally, particularly in the offshore, LNG, and large downstream segments where project complexity and technical risk are highest. Their competitive moat is built on decades of project execution experience, proprietary engineering methodologies, established relationships with major NOC and IOC clients, and the financial capacity to provide performance guarantees on multi-billion dollar projects capabilities that new market entrants simply cannot replicate quickly regardless of how much capital they invest.
Key Development
- In June 2025, Bechtel Corporation strengthened its position in the oil and gas EPC market when NextDecade updated its lump-sum EPC agreement for Rio Grande LNG Train 4 to approximately USD 4.77 billion and awarded the company a further USD 4.32 billion contract for Train 5.
- In April 2026, Fluor Corporation was selected to design America First Refining’s new Brownsville refinery, which is expected to process more than 60 million barrels of domestic crude oil per year into gasoline, diesel and jet fuel.
The Major Players in The Industry
- Bechtel Corporation
- Fluor Corporation
- Saipem S.p.A.
- TechnipFMC plc
- McDermott International, Ltd.
- KBR, Inc.
- Samsung Engineering Co., Ltd.
- Hyundai Engineering & Construction Co., Ltd.
- Petrofac Limited
- Worley Limited
- Wood Group plc
- NPCC
- John Wood Group PLC
- Chiyoda Corporation
- JGC Holdings Corporation
- SNC-Lavalin (AtkinsRéalis)
- Kiewit Corporation
- Larsen & Toubro
- Others
Report Scope
| Report Features | Description |
|---|---|
| Market Value (2025) | USD 199.9 Bn |
| Forecast Revenue (2035) | USD 321.1 Bn |
| CAGR (2026-2035) | 4.9% |
| Base Year for Estimation | 2025 |
| Historic Period | 2020-2024 |
| Forecast Period | 2026-2035 |
| Report Coverage | Revenue Forecast, Market Dynamics, Competitive Landscape, Recent Developments |
| Segments Covered | By Service Type (Construction, Engineering, Procurement, Project Management, Commissioning, and Others), By Sector (Upstream, Midstream, and Downstream), By Project Type (Brownfield Projects and Greenfield Projects), By Application (Onshore and Offshore), By End-User (National Oil Companies, International Oil Companies, Independent Oil Companies, and Others), |
| Regional Analysis | North America – The US & Canada; Europe – Germany, France, The UK, Spain, Italy, Russia & CIS, Rest of Europe; APAC– China, Japan, South Korea, India, ASEAN & Rest of APAC; Latin America– Brazil, Mexico & Rest of Latin America; Middle East & Africa– GCC, South Africa, & Rest of MEA |
| Competitive Landscape | Bechtel Corporation, Fluor Corporation, Saipem S.p.A., TechnipFMC plc, McDermott International, Ltd., KBR, Inc., Samsung Engineering Co., Ltd., Hyundai Engineering & Construction Co., Ltd., Petrofac Limited, Worley Limited, Wood Group plc, NPCC (National Petroleum Construction Company), John Wood Group PLC, Chiyoda Corporation, JGC Holdings Corporation, SNC-Lavalin (AtkinsRéalis), Kiewit Corporation, Larsen & Toubro (L&T), and others. |
| Customization Scope | Customization for segments, region/country-level will be provided. Moreover, additional customization can be done based on the requirements. |
| Purchase Options | We have three licenses to opt for: Single User License, Multi-User License (Up to 5 Users), Corporate Use License (Unlimited Users and Printable PDF) |





































