
Quick Navigation
Report Overview
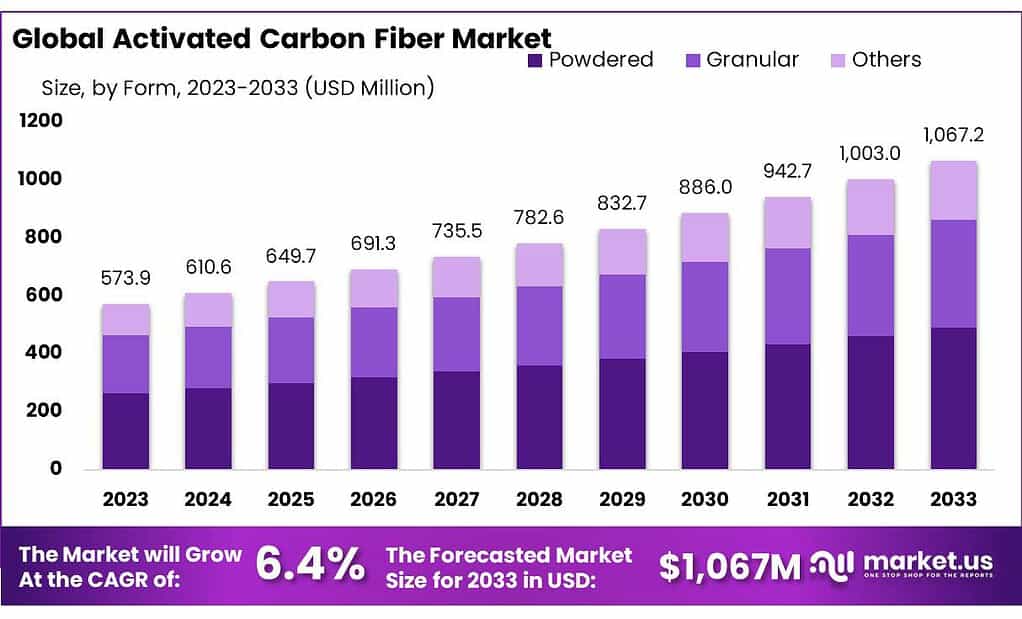
The global Activated Carbon Fiber Market size is expected to be worth around USD 1067.2 Million by 2033, from USD 573.9 Million in 2023, growing at a CAGR of 6.4% during the forecast period from 2023 to 2033.
The activated carbon fiber (ACF) market encompasses the global production, distribution, and application of activated carbon fibers, a highly porous form of carbon that exhibits exceptional adsorption properties. ACF is made by carbonizing and activating organic materials, such as cellulose, coal, and petroleum pitches, which results in a fibrous material with a large surface area. This material is distinguished by its ability to adsorb a wide range of organic and inorganic substances, making it highly valuable across various industries.
ACF is widely used for purification and filtration purposes, finding applications in air purification, water treatment, chemical recovery, and protection against toxic gases. Its high surface area, pore distribution, and adsorption capacity, combined with the ease of handling provided by its fibrous nature, make it particularly effective in capturing pollutants and contaminants.
Additionally, the activated carbon fiber market is driven by growing environmental concerns and the increasing need for purification technologies in response to industrial pollution and water scarcity issues.
The versatility of ACF allows for its use in a range of specialized applications, including personal protective equipment (PPE), medical devices, and energy storage solutions. Innovations in the manufacturing process and the development of new raw materials for ACF production are further expanding its applications and contributing to the growth of the market.
The activated carbon fiber market is characterized by ongoing research aimed at enhancing the efficiency and functionality of ACF, making it a dynamic and rapidly evolving sector with significant potential for environmental and technological advancements.
Key Takeaways
- Projected Growth: The market expected to reach USD 1067.2 million by 2033, growing at 6.4% CAGR from 2023.
- Popular Forms: Powdered ACF dominates with a 64.3% market share in 2024, followed by granular and other forms.
- Leading Type: Pitch-based ACF will hold a 45.3% market share in 2024 due to its exceptional adsorption properties.
- Regional Dominance: Asia Pacific leads the ACF market, followed by North America and Europe, driven by environmental concerns and regulations.
- The typical pH range for optimal adsorption performance of activated carbon fiber can range from 6 to 8.
- Activated carbon fiber typically has a surface area ranging from 1000 to 3000 square meters per gram.
By Form
In 2024, Powdered form held a dominant market position, capturing more than a 64.3% share. This predominance is attributed to its wide applicability in water treatment, air purification, and industrial processes, where its fine particles ensure a high contact surface area for adsorption. The powdered form’s versatility and efficiency in removing contaminants make it a preferred choice for both municipal and industrial settings, driving its significant market share.
Granular form followed, favored for its reusability and durability in fixed-bed applications, such as gas phase filtration and water purification systems. Its larger particle size reduces pressure drop in filtration systems, making it efficient for continuous use in heavy-duty applications. The granular form is appreciated for its ease of handling and is often selected for applications where longer contact times are necessary, underscoring its importance in the market.
The ‘Others’ category encompasses various forms of activated carbon fiber, including cloth and woven fabrics, which are used in specialized applications such as protective clothing, medical devices, and certain air purification systems. This segment caters to niche markets that require specific properties of ACF, such as flexibility and patterned adsorption capabilities, highlighting the adaptability and innovation within the activated carbon fiber market.
Overall, the activated carbon fiber market in 2024 is characterized by a diverse range of product forms designed to meet the specific needs of different applications. From the high adsorption efficiency of powdered ACF to the durability of granular forms and the innovative uses of other ACF types, each segment plays a crucial role in addressing environmental challenges and purification needs across various industries.
By Type
In 2024, Pitch-Based Activated Carbon Fiber held a dominant market position, capturing more than a 45.3% share. Its prominence in the market is largely due to its exceptional adsorption properties and structural strength, making it ideal for demanding applications such as air purification, water treatment, and chemical recovery. Pitch-based ACF’s versatility and effectiveness in removing a wide range of contaminants have solidified its leading position in the market.
Following closely is Polyacrylonitrile (PAN) Based Activated Carbon Fiber, favored for its excellent chemical resistance and thermal stability. This type of ACF is particularly useful in applications requiring exposure to high temperatures or corrosive materials, such as protective clothing and filtration systems in industrial processes. Its unique properties have ensured a strong market presence.
Viscose Staple-Based Activated Carbon Fiber also holds a significant share of the market, appreciated for its ability to be easily processed into various forms, including textiles and non-woven fabrics. This flexibility makes it suitable for a broad array of applications, from air and water filtration to protective garments and odor control solutions, contributing to its popularity in the market.
The ‘Others’ category encompasses a variety of emerging and specialty types of activated carbon fiber, including those derived from new organic precursors or modified for specific functionalities. These innovative ACF types cater to niche applications that require targeted adsorption characteristics or physical properties, highlighting the ongoing innovation and adaptation within the activated carbon fiber market.
In 2024, the activated carbon fiber market is characterized by the diverse capabilities and applications of its product types. From the robust and versatile pitch-based ACF to the specialized uses of PAN and viscose staple-based fibers, and the innovative potential of other ACF types, each segment contributes to the market’s growth. This diversity reflects the expanding range of applications for activated carbon fiber and the industry’s response to evolving environmental and technological challenges.
By Application
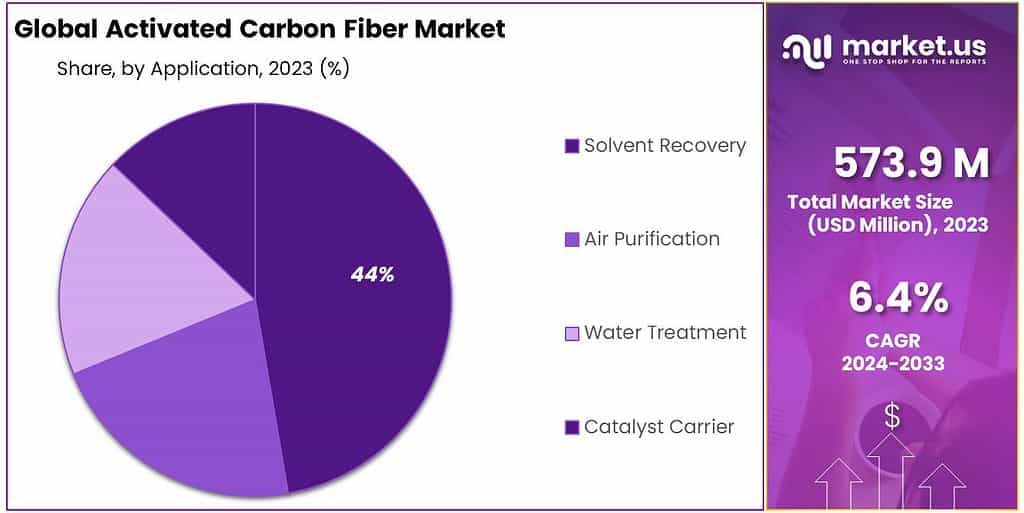
In 2024, Solvent Recovery held a dominant market position, capturing more than a 43.4% share. This leading status stems from the growing industrial emphasis on sustainability and regulatory compliance, driving the need for efficient recovery systems. Activated carbon fiber, with its high adsorption capacity, proves to be highly effective in capturing and recovering solvents from industrial processes, making it invaluable in reducing emissions and recycling valuable chemicals.
Air Purification followed as a significant application, underlined by increasing concerns over air quality and health. Activated carbon fiber’s ability to adsorb pollutants, odors, and volatile organic compounds from indoor and outdoor environments makes it a key component in air purification systems, including HVAC filters and personal respiratory masks.
Water Treatment also commands a substantial segment of the market, reflecting the critical need for clean water in residential, commercial, and industrial sectors. ACF’s effectiveness in removing contaminants, such as chlorine, sediments, and organic compounds, from water supplies, positions it as an essential material in filtration systems, contributing to safer drinking water and environmental preservation.
Catalyst Carrier is another important application, where the unique properties of activated carbon fiber are utilized to support catalysts in chemical reactions. This application leverages ACF’s large surface area and porous structure, enhancing the efficiency and selectivity of catalysts in various industrial and environmental processes.
In 2024, the activated carbon fiber market is characterized by its diverse applications, each addressing pivotal environmental and industrial needs. From the crucial role of solvent recovery in promoting circular economies to the contributions of ACF in purifying air and water, and its use as a catalyst carrier, these segments collectively drive the market’s expansion. This diversity not only highlights the adaptability of activated carbon fiber across different domains but also underscores the growing demand for sustainable and efficient material solutions.
Key Market Segments
By Form
- Powdered
- Granular
- Others
By Type
- Pitch Based Activated Carbon Fiber
- Polyacrylonitrile (PAN) Based Activated Carbon Fiber
- Viscose Staple Based Activated Carbon Fiber
- Others
By Application
- Solvent Recovery
- Air Purification
- Water Treatment
- Catalyst Carrier
Drivers
Increasing Environmental Regulations and Sustainability Initiatives
A major driver propelling the growth of the Activated Carbon Fiber (ACF) market is the stringent environmental regulations and the global push towards sustainability initiatives. As governments around the world implement stricter laws to protect the environment and ensure public health, industries are compelled to adopt cleaner and more sustainable processes. This regulatory pressure, combined with a growing societal emphasis on environmental responsibility, has significantly increased the demand for effective pollution control and purification technologies, where ACF plays a pivotal role.
Activated carbon fiber, with its exceptional adsorption capabilities, is highly effective in capturing pollutants, including volatile organic compounds (VOCs), sulfur oxides (SOx), nitrogen oxides (NOx), and particulate matter from industrial emissions. It is also instrumental in water treatment processes, removing contaminants such as heavy metals, pesticides, and pharmaceutical residues, thereby ensuring the safety and cleanliness of water bodies and drinking water supplies. The versatility of ACF makes it an ideal choice for a wide range of applications, from air and water purification systems to solvent recovery and personal protective equipment.
The shift towards sustainability has not only been regulatory-driven but also market-driven, as consumers increasingly prefer products and services that are environmentally friendly. This shift in consumer preferences further fuels the demand for green technologies and materials, including ACF. Industries that once relied on traditional filtration and purification methods are now turning to ACF for its efficiency, effectiveness, and minimal environmental impact.
Moreover, the advancement in manufacturing technologies has made the production of ACF more cost-effective and efficient, allowing for its broader application across various sectors. Innovations in ACF production aim to enhance its adsorption capacity, selectivity, and regeneration ability, making it an even more attractive option for industries looking to improve their environmental footprint.
Restraints
High Production Costs and Availability of Alternative Materials
A major restraint facing the Activated Carbon Fiber (ACF) market is the high production costs associated with its manufacturing process, coupled with the availability of alternative materials. The production of ACF involves several complex steps, including the stabilization, carbonization, and activation of organic precursors, which are resource-intensive and require significant energy input.
These processes necessitate specialized equipment and high temperatures, leading to substantial operational costs. As a result, the price of ACF tends to be higher than other adsorbent materials, such as granular activated carbon (GAC) or zeolites, which can perform similar functions in certain applications.
The high cost of ACF not only affects its competitiveness in the market but also limits its adoption in industries where cost efficiency is a critical factor. While ACF offers superior performance in terms of adsorption capacity and speed compared to other materials, the cost-benefit analysis may not always justify its use, especially in large-scale applications or in industries operating under tight budget constraints. This scenario is particularly relevant in developing economies, where the adoption of advanced environmental technologies is often hindered by cost considerations.
Furthermore, the availability of alternative adsorbent materials that are cheaper to produce and offer reasonable efficiency poses a significant challenge to the ACF market. These materials, while not as effective as ACF in certain applications, provide a viable option for industries looking to reduce pollutants and comply with environmental regulations without incurring high costs. Innovations in the development of alternative materials are continuously improving their performance, narrowing the gap with ACF and making the market more competitive.
Additionally, the raw materials required for ACF production, such as certain types of pitch and acrylic fibers, can be subject to price volatility and supply chain disruptions, further complicating production planning and cost management. The reliance on these materials may also pose sustainability concerns, driving the search for more environmentally friendly and cost-effective alternatives.
Opportunity
Expansion into Emerging Markets and Applications
A significant opportunity for the Activated Carbon Fiber (ACF) market lies in its expansion into emerging markets and applications, particularly in regions experiencing rapid industrialization and urbanization. These areas are confronting increasing environmental challenges, such as air and water pollution, which are compounded by growing populations and economic activities. The demand for effective purification and filtration solutions in these contexts provides a fertile ground for the adoption of ACF technologies. ACF’s superior adsorption capabilities make it an ideal candidate for addressing a wide array of environmental pollutants, offering substantial growth prospects for producers.
Emerging markets in Asia, Africa, and Latin America, with their fast-paced development, represent untapped potential for ACF utilization. As these economies grow, so does their commitment to environmental sustainability, driven both by internal policy shifts and international environmental agreements. This alignment creates a conducive environment for ACF market penetration, supported by investments in water treatment facilities, air purification systems, and waste management solutions that incorporate advanced materials like ACF.
Moreover, the versatility of ACF opens up opportunities in novel applications beyond traditional environmental use cases. Its potential in energy storage, particularly in supercapacitors and batteries, aligns with the global shift towards renewable energy and electric vehicles. The unique properties of ACF, including its high surface area and electrical conductivity, can significantly improve the performance and efficiency of energy storage devices, offering a new frontier for market expansion.
The healthcare sector also presents opportunities for ACF, especially in developing innovative medical devices and protective gear that leverage its adsorption properties. For instance, ACF can be used in creating more effective air-purifying respirators or in developing wound dressings that can adsorb toxins and promote healing. As health and safety concerns continue to rise globally, the demand for such advanced solutions is expected to grow, providing a lucrative avenue for ACF applications.
Trends
Increasing Integration of Sustainable and Circular Economy Principles
A major trend shaping the Activated Carbon Fiber (ACF) market is the increasing integration of sustainable and circular economy principles into its production and application processes. As environmental sustainability becomes a paramount concern globally, industries are seeking ways to minimize their ecological footprint and embrace more eco-friendly practices. This shift is driving innovation in the ACF market, where producers are exploring more sustainable raw materials, energy-efficient manufacturing processes, and ways to recycle and reuse ACF, aligning with the principles of the circular economy.
The move towards using renewable or waste-derived precursors for ACF production is gaining momentum. Manufacturers are investigating the use of biomass, such as coconut shells, wood, and other plant-based materials, as sustainable sources for carbon fiber. These resources not only reduce reliance on non-renewable raw materials but also offer a way to valorize agricultural and forestry waste, turning potential environmental burdens into valuable products.
Energy efficiency in the production of ACF is another focal point, with advancements aimed at reducing the carbon footprint of manufacturing operations. Techniques such as microwave and plasma activation are being studied for their potential to lower energy consumption and processing time compared to conventional activation methods. These innovations not only make ACF production more sustainable but can also reduce costs, enhancing the market competitiveness of ACF.
Furthermore, the trend towards the recyclability and reusability of ACF is gaining traction. Research into the regeneration of spent ACF offers pathways to extend the lifecycle of the material, reducing waste and the need for fresh raw materials. This approach is particularly relevant in applications where ACF is used for pollutant capture and can be saturated quickly, such as in water treatment and air purification. Developing effective regeneration methods can transform ACF into a truly circular material, aligning with global sustainability goals.
Geopolitical Impact Analysis
Geopolitical tensions significantly impact the Activated Carbon Fiber (ACF) market, especially concerning production and supply chain activities. The complex relationship between international trade policies, regional conflicts, and strategic global alliances plays a critical role in shaping the dynamics, investment flows, and supply configurations within this industry.
Key among these tensions are the escalating trade disputes between major world powers, such as the United States and China, which have direct repercussions on the ACF market. Tariffs, trade barriers, and restrictions on the exchange of technology perturb the cost structures and reliability of supply chains for ACF. Given China’s crucial role in the ACF supply chain, as both a major producer and consumer of ACF, along with its significant reserves of precursor materials like pitch and acrylic fibers, these geopolitical shifts are particularly poignant.
Additionally, the increasing global focus on environmental sustainability and the adoption of green technologies fuel the demand for ACF, used in applications ranging from air and water purification to energy storage. This surge in demand places a spotlight on the strategic importance of securing access to essential materials and technologies involved in ACF production. Consequently, nations and corporations are formulating strategies to ensure supply chain resilience, aiming to diminish dependence on regions fraught with geopolitical tensions.
Geopolitical developments, including regional conflicts and economic sanctions, further expose the fragility of the global ACF supply chain. Situations such as political instability in countries that supply critical raw materials or sanctions that affect the trade of these inputs underline the necessity for a secure and diversified supply chain.
In summary, geopolitical tensions wield a profound influence on the Activated Carbon Fiber market by affecting production, trade, and the integrity of supply chains. As the geopolitical landscape continues to evolve, industry participants are challenged to adjust their strategies to mitigate risks and capitalize on opportunities for sustainable development in an increasingly interconnected world.
Regional Analysis
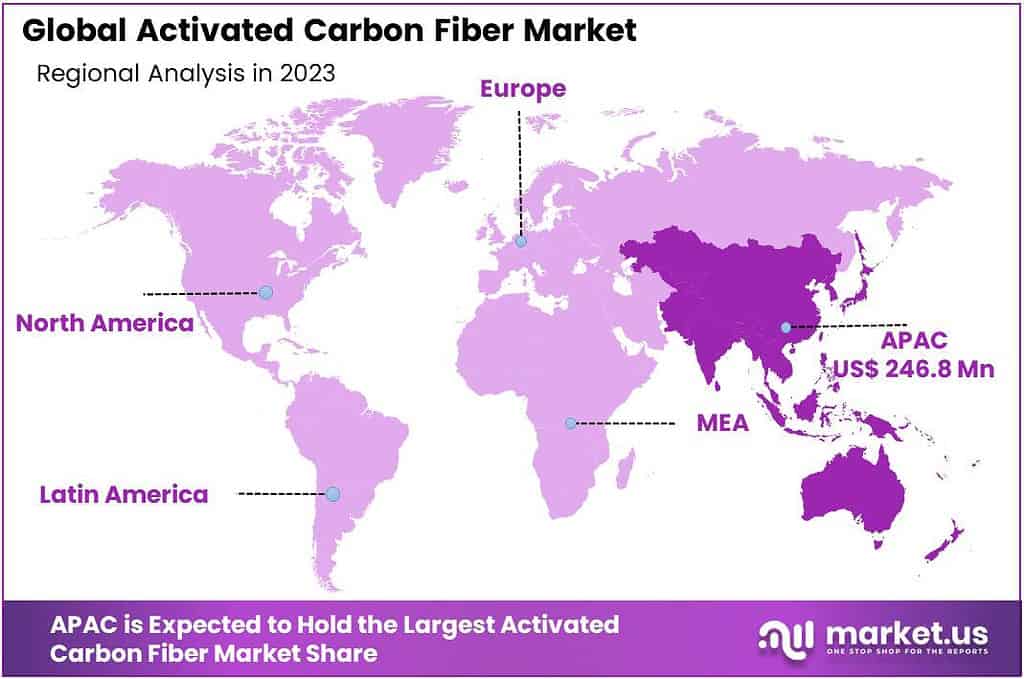
The Asia Pacific region is anticipated to dominate the global Activated Carbon Fiber (ACF) market, holding a commanding market share of 43%. This growth is primarily driven by the increasing application of ACF in sectors such as air and water purification, industrial processes, and protective gear manufacturing.
The rise in ACF production in countries like China, India, and Southeast Asian nations, including Korea, Thailand, Malaysia, and Vietnam, is expected to spearhead market expansion in this region over the forecast period. These countries are focusing on enhancing their manufacturing capabilities and are leveraging the growing demand for environmental sustainability solutions.
In North America, economic growth, alongside the expansion of industries that require pollution control measures and efficient filtration systems, is likely to boost the demand for ACF. The region’s focus on improving air quality and water purity further bolsters this demand, positioning North America as a significant market for ACF.
Europe is also set to experience notable growth in the ACF market, propelled by increasing environmental regulations and the demand for sustainable and effective purification technologies. The strong emphasis on reducing industrial emissions and ensuring clean water supplies aligns with the growing application areas for ACF, from automotive emissions control to chemical processing.
This trend towards the adoption of ACF underscores global movements towards pollution control, environmental protection, and sustainable industrial practices, reflecting similar growth dynamics observed in other markets but within the context of advanced material applications like Activated Carbon Fiber.
Key Regions and Countries
- North America
- The US
- Canada
- Europe
- Germany
- France
- The UK
- Spain
- Italy
- Russia & CIS
- Rest of Europe
- APAC
- China
- Japan
- South Korea
- India
- ASEAN
- Rest of APAC
- Latin America
- Brazil
- Mexico
- Rest of Latin America
- Middle East & Africa
- GCC
- South Africa
- Rest of MEA
Key Players Analysis
The Activated Carbon Fiber (ACF) market features a diverse array of key players, each contributing to the sector’s growth and innovation. These companies range from established chemical and materials manufacturing giants to specialized firms focusing exclusively on advanced carbon materials.
A central figure in this landscape is Kuraray Co., Ltd., a Japanese corporation known for its pioneering work in synthetic fibers, including ACF. Kuraray’s extensive research and development efforts have positioned it as a leader in producing high-quality ACF used in various applications, from air and water purification to protective clothing.
Market Key Players
- Anshan Sinocarb Carbon Fibers Co., Ltd.
- Awa Paper Mfg. Co., Ltd.
- Cabot Corporation
- Hayleys Group
- Kuraray Co., Ltd.
- Kureha Corporation
- Mitsubishi Chemical Corporation
- Murata Manufacturing Co., Ltd.
- Nantong Senyou Fiber Products Co., Ltd.
- Neenah Gessner GmbH
- Nippon Kynol, Inc.
- Osaka Gas Chemicals Group
- SGL Carbon SE
- Solvay S.A.
- Spintek Filtration Inc.
- Takeda Pharmaceutical Company Limited
- Teijin Limited
- Toyobo Co., Ltd.
- Unitika Ltd.
- Wacker Chemie AG
Recent Development
2024 Awa Paper Mfg. Co., Ltd: Might introduce a new line of ACF products designed for enhanced performance in water filtration systems, showcasing innovation in environmental solutions.
2024 Hayleys Group: Could expand its ACF segment into new markets, focusing on regions with increasing demand for purification technologies, underpinned by global expansion strategies.
2024 Kureha Corporation: Expected to invest in research and development for biodegradable ACF alternatives, aligning with global trends towards sustainable materials.
Report Scope
| Report Features | Description |
|---|---|
| Market Value (2023) | USD 573.9 Mn |
| Forecast Revenue (2033) | USD 1067.2 Mn |
| CAGR (2024-2033) | 6.4% |
| Base Year for Estimation | 2023 |
| Historic Period | 2020-2023 |
| Forecast Period | 2024-2033 |
| Report Coverage | Revenue Forecast, Market Dynamics, COVID-19 Impact, Competitive Landscape, Recent Developments |
| Segments Covered | By Form(Powdered, Granular, Others), By Type(Pitch Based Activated Carbon Fiber, Polyacrylonitrile (PAN) Based Activated Carbon Fiber, Viscose Staple Based Activated Carbon Fiber, Others), By Application(Solvent Recovery, Air Purification, Water Treatment, Catalyst Carrier) |
| Regional Analysis | North America – The US & Canada; Europe – Germany, France, The UK, Spain, Italy, Russia & CIS, Rest of Europe; APAC– China, Japan, South Korea, India, ASEAN & Rest of APAC; Latin America– Brazil, Mexico & Rest of Latin America; Middle East & Africa– GCC, South Africa, & Rest of MEA |
| Competitive Landscape | Anshan Sinocarb Carbon Fibers Co., Ltd., Awa Paper Mfg. Co., Ltd., Cabot Corporation, Hayleys Group, Kuraray Co., Ltd., Kureha Corporation, Mitsubishi Chemical Corporation, Murata Manufacturing Co., Ltd., Nantong Senyou Fiber Products Co., Ltd., Neenah Gessner GmbH, Nippon Kynol, Inc., Osaka Gas Chemicals Group, SGL Carbon SE, Solvay S.A., Spintek Filtration Inc., Takeda Pharmaceutical Company Limited, Teijin Limited, Toyobo Co., Ltd., Unitika Ltd., Wacker Chemie AG |
| Customization Scope | Customization for segments, region/country-level will be provided. Moreover, additional customization can be done based on the requirements. |
| Purchase Options | We have three licenses to opt for: Single User License, Multi-User License (Up to 5 Users), Corporate Use License (Unlimited User and Printable PDF) |
Frequently Asked Questions (FAQ)
Activated Carbon Fiber Market size is expected to be worth around USD 1067.2 Million by 2033, from USD 573.9 Million in 2023
Anshan Sinocarb Carbon Fibers Co., Ltd., Awa Paper Mfg. Co., Ltd., Cabot Corporation, Hayleys Group, Kuraray Co., Ltd., Kureha Corporation, Mitsubishi Chemical Corporation, Murata Manufacturing Co., Ltd., Nantong Senyou Fiber Products Co., Ltd., Neenah Gessner GmbH, Nippon Kynol, Inc., Osaka Gas Chemicals Group, SGL Carbon SE, Solvay S.A., Spintek Filtration Inc., Takeda Pharmaceutical Company Limited, Teijin Limited, Toyobo Co., Ltd., Unitika Ltd., Wacker Chemie AG


