
Quick Navigation
Report Overview
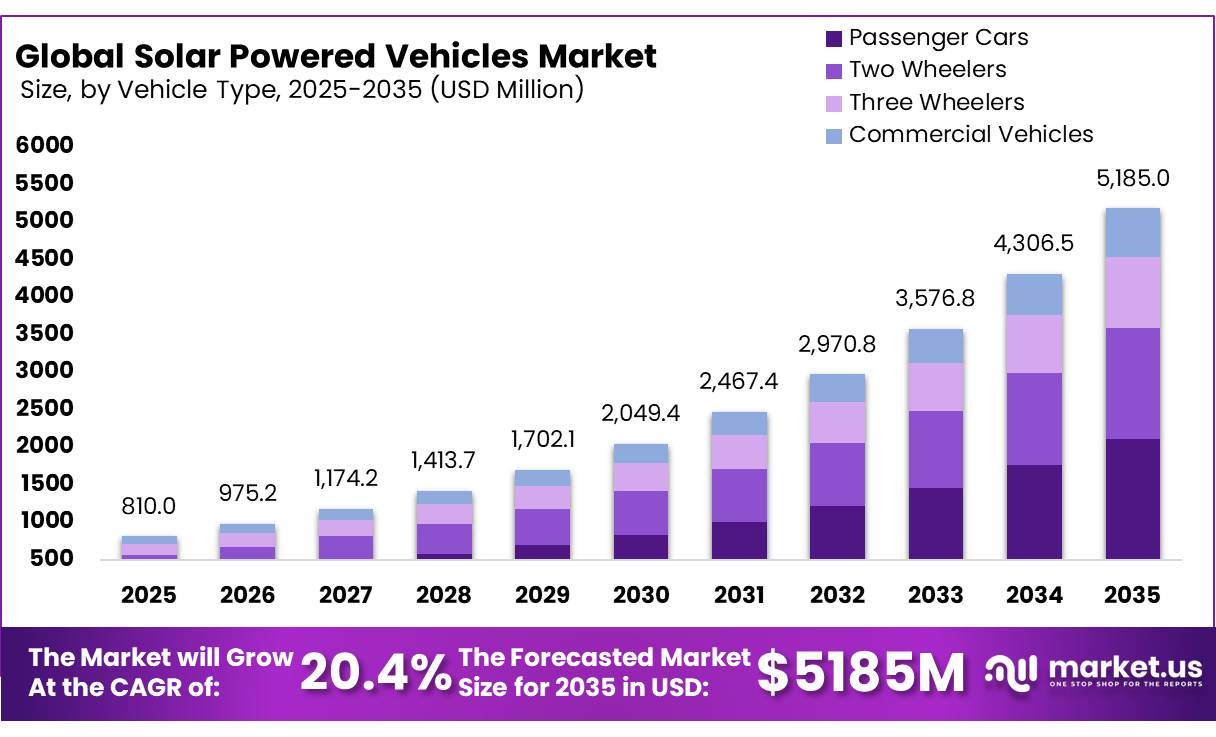
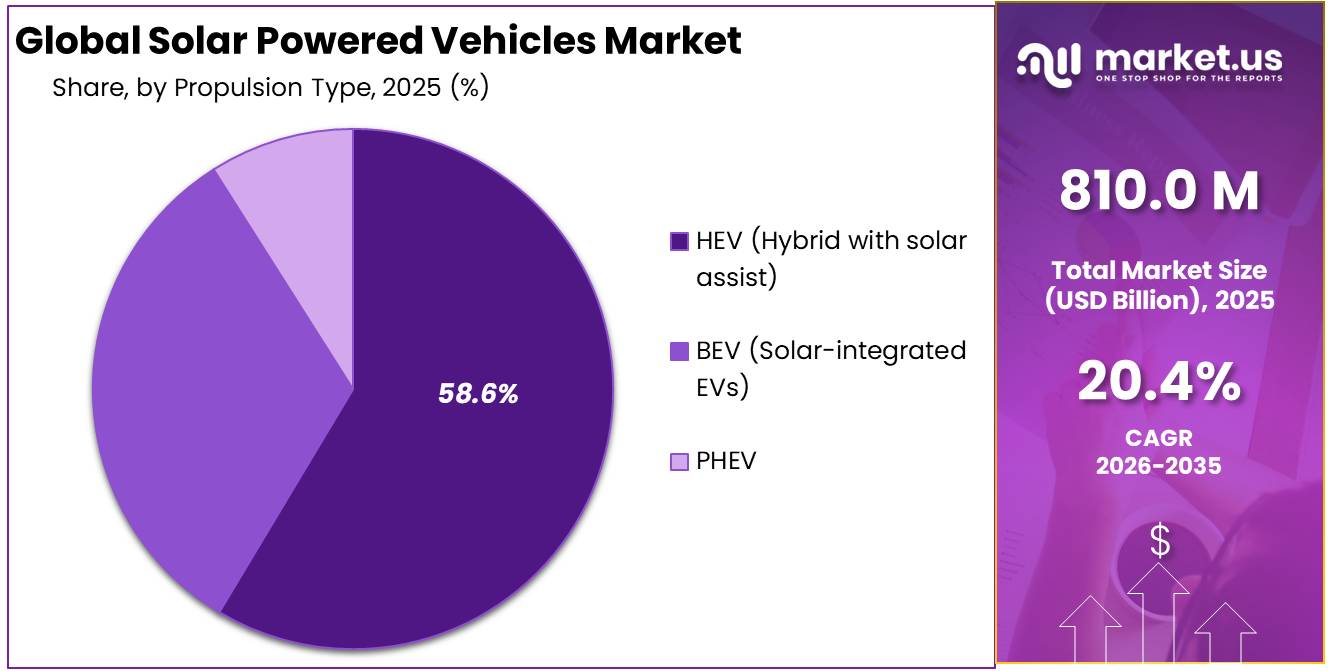
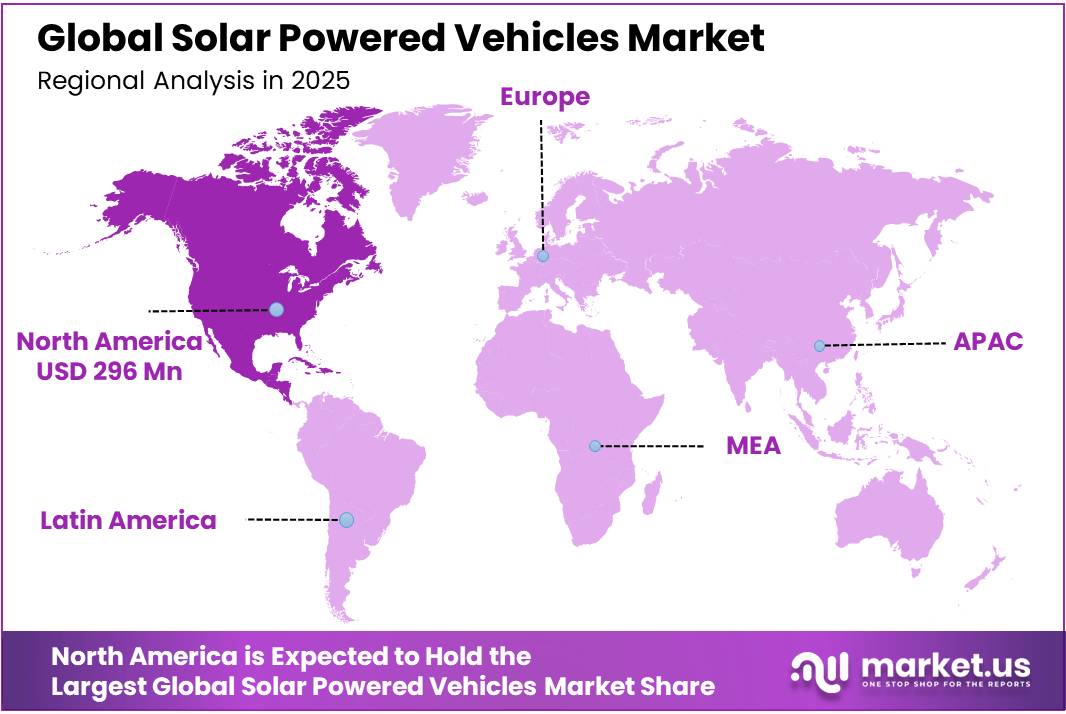
The Global Solar Powered Vehicles Market size is expected to be worth around USD 5,185.0 Million by 2035, from USD 810.0 Million in 2025, growing at a CAGR of 20.4% during the forecast period from 2026 to 2035. In 2025, North America held a dominant market position, capturing more than a 36.5% share, holding USD 0.4 Billion revenue.
Key Takeaways
- The Global Solar Powered Vehicles Market size was USD 810.0 Million in 2025.
- The Market is projected to grow to USD 5,185.0 Million by 2035.
- The Compound Annual Growth Rate (CAGR) of the market from 2026 to 2035 will be at 20.4%.
- Passenger Cars have the largest market share, accounting for 40.8% of the total vehicle type category.
- HEV (Hybrid with Solar Assist) dominated the propulsion type segment, accounting for 58.6% of total revenue.
- Monocrystalline has the highest revenue share in the solar panel type segment, accounting for 62.3% of the total.
- Lithium-Ion leads the battery type segment in terms of revenue, accounting for 71.5% of the total.
- Personal Mobility has the highest revenue share among application segments, accounting for 46% of total application revenue.
- Solar-Assisted Vehicles dominated the solar integration level segment, accounting for 76% of total sales.
- North America is the largest regional market, accounting for 36.5% of all global revenue.
- Asia Pacific is the fastest-growing region due to strong solar irradiation in important economies and aggressive EV adoption regulations.
This growth is largely supported by the rapid expansion of the global electric vehicle (EV) industry, which remains the primary application area for solar-powered vehicles. According to the International Energy Agency (IEA), global electric car sales reached 17 million units in 2024, representing more than 20% of all new vehicle sales worldwide. The agency further projects sales to exceed 23 million units by 2026, highlighting the increasing adoption of clean transportation technologies.
In parallel, the International Organization of Motor Vehicle Manufacturers (OICA) reported that global vehicle production increased from 92.7 million units in 2024 to 96.4 million units in 2025. As vehicle production and EV adoption continue to rise, automakers are increasingly integrating solar technologies that can provide an additional 1,000–1,300 km of annual driving range through onboard photovoltaic systems.
Another major factor supporting market growth is the significant decline in solar photovoltaic (PV) costs. According to the International Renewable Energy Agency (IRENA), the installed cost of utility-scale solar PV fell by 87% between 2010 and 2024, decreasing from US$ 5,283/kW to US$ 691/kW. During the same period, the levelized cost of solar electricity declined by 90% to US$ 0.043/kWh, making solar energy 41% cheaper than fossil fuel alternatives.
The IEA PVPS reported that global cumulative solar PV capacity surpassed 2,260 GW by the end of 2024, while annual additions reached a record 553–601 GW, reflecting a 29% year-over-year increase. Lower solar panel costs are making vehicle-integrated photovoltaic systems more affordable and commercially attractive.
Regionally, North America accounted for 36.5% of global market revenue in 2025, supported by strong government regulations. The U.S. EPA projects that nearly two-thirds of new vehicle sales will be zero-emission by 2032, while Canada aims for 100% zero-emission light-duty vehicle sales by 2035, with interim targets of 20% by 2026 and 60% by 2030. These policies are accelerating the adoption of solar-assisted vehicle technologies across the automotive industry.
Solar Powered Vehicles Market Segmentation
Vehicle Type Analysis
Passenger cars dominate the solar-powered vehicle market through high demand, mass adoption, and OEM investment.
Passenger Cars dominate the market share of vehicle type segments with a market share of 40.8%. This can be attributed to the fact that the passenger car is the most common base for the installation of solar panels due to its prevalence among automotive OEM products on offer from leading brands such as Hyundai, Toyota, and Volkswagen which have all integrated the solar roof panel installation as either a basic feature or an option for their passenger car product offerings.
- For instance, according to the annual report issued by Toyota Motor Corporation, its Prius Prime model having solar roofs sold an astounding 41 percent of its total vehicle sales in Japan, in the year 2024, and each unit with solar roof contributed an additional earning of $2,100 per vehicle, thereby validating the willingness-to-pay capacity of consumers.
- According to the International Organization of Motor Vehicle Manufacturers (OICA), global vehicle production reached 96.4 million units in 2025, with passenger cars accounting for nearly 73% of total vehicle output worldwide. Data from the European Automobile Manufacturers’ Association (ACEA) shows that global passenger car sales reached 74.6 million units in 2024, reflecting a 2.5% year-on-year increase. Asia remained the largest market, contributing more than 55% of total global car sales.
In 2025, the two-wheelers segment accounted for 28.5% of the global solar-powered vehicles market and emerged as the fastest-growing vehicle category. Growth is being driven by the rapid adoption of electric two-wheelers across India, China, and Southeast Asia, where high solar radiation levels and short daily commuting distances create favorable conditions for solar-assisted mobility solutions.
According to the International Council on Clean Transportation (ICCT), global two-wheeler sales reached approximately 55 million units in 2025, with India and China contributing nearly 28 million units, representing more than 50% of total global sales. China’s electric two-wheeler market recorded 6.9 million units in 2024, while India’s electric two-wheeler sales more than doubled between 2022 and 2024, reaching 1.14 million units and accounting for 59% of the country’s total EV sales.
Propulsion Type Analysis
HEV with solar assist dominates the propulsion segment through proven technology and strong OEM adoption.
HEV (Hybrid with Solar Assist) with solar assist emerged as the leading propulsion type, accounting for 58.6% of the market, supported by the strong global adoption of hybrid-electric vehicles and the ease of integrating solar technology into existing hybrid platforms. In the European Union, hybrid-electric vehicles represented 30.9% of all new car registrations in 2024, making them the second most popular powertrain after petrol vehicles and ahead of both diesel and battery electric vehicles. Hybrid adoption strengthened further in Q1 2026, with market share rising to 38.6%, highlighting growing consumer preference for hybrid mobility.
A similar trend is visible in Japan, where hybrid-electric vehicles accounted for approximately 35.6% of passenger car registrations in 2024. This large and established hybrid vehicle base creates a favorable environment for solar-assisted upgrades. From a technical perspective, hybrids already incorporate key components such as traction batteries, inverters, DC-DC converters, and energy management systems. As a result, solar panels can be added as an additional power source to support battery charging during parking or driving, without requiring major changes to the vehicle architecture.
- For instance, the introduction of solar roofs into Hyundai’s hybrid cars increased the number of customers who opted for hybrid variants from new car buyers in Europe by 23% during 2024. According to dealers’ reports, solar roof availability played a significant role in the purchasing decision of more than 38% of hybrid customers polled at the point of sale.
- According to the International Energy Agency (IEA), electric vehicles accounted for more than 22% of global new car sales in 2024, while EVs and plug-in hybrids together reached nearly 25% of new vehicle sales in 2025, equivalent to approximately 21 million units. At the same time, the International Renewable Energy Agency (IRENA) reported that global solar PV installations added around 452 GW of new capacity in 2024, increasing total installed solar capacity to approximately 1.87–2.25 TW and contributing over 77% of all newly added renewable energy capacity.
Solar Panel Type Analysis
Monocrystalline solar panels dominate due to high efficiency, durability, and alignment with automotive OEM standards.
Monocrystalline solar panels have the highest market share among other types of solar panels amounting to 62.3%. This can be attributed to monocrystalline panels’ higher energy conversion efficiency that is above 22-24% among all automotive solar panel types, higher efficiency during operation in poor lighting conditions, and compactness of the product that makes it easier to install on the roof and hood curves of vehicles. Moreover, the leading position of monocrystalline solar panels is further boosted by their qualification as automotive solar panels. This means that such solar panels passed special tests that include thermal cycling, vibrations resistance, UV radiation resistance, and impact resistance in accordance with the requirements set by IEC and the automotive industry.
- For instance, the automotive grade monocrystalline solar film modules produced by Hanergy that have achieved a conversion efficiency rate of more than 23 percent were used in 2024 by three OEMs from Asia to integrate them in their electric bus rooftop solar systems in more than 8,000 buses.
Battery Type Analysis
Lithium-ion batteries dominate the solar vehicle market with high energy, proven use, and strong supply chains.
The Lithium-Ion battery technology dominates the battery type segment with a 71.5% share in revenues owing to their superior energy density, well-entrenched supply chain catering to automotive industry requirements around the world, and the fact that they can be used in solar charge controllers to maximize the amount of energy collected and stored from photovoltaics at varying levels of irradiation. The overwhelming advantage enjoyed by these batteries is further enhanced by the large-scale investments currently being made in the setting up of lithium-ion gigafactories, such as those of Tesla (Nevada Gigafactory) and CATL, which are driving down the cost of cells to about $80-90/kWh.
- For instance, the CATL company announced that its LFP battery cells, which are highly desired due to their outstanding thermal stability while charging using solar power, were delivered to more than 40 vehicle Original Equipment Manufacturers worldwide in 2024, with a version of the solar-compatible Battery Management System being one of the fastest-growing product configurations requested by the automotive industry.
Application Analysis
Personal mobility dominates the solar-powered vehicle market through strong consumer adoption and OEM integration.
Personal Mobility is the leading market segment, accounting for about 46% of overall revenue, as consumer purchasers of solar-powered passenger cars and two-wheelers for daily urban and suburban travel find that short to medium daily driving distances complement their ability to augment solar power in their vehicles effectively. The dominance of this market segment stems from its unique selling point for consumers who use solar personal mobility. It enables them to reduce reliance on charging, save on fuel and energy, and be energy independent of any power grid infrastructure system.
- For instance, Aptera Motors announced that more than 40,000 people had already reserved their solar-powered three-wheeled electric car by early 2025, with the pre-order consumers having mentioned being able to harness solar energy independent of all others as their main reason for making the purchase, according to a survey response from the potential buyers.
Shared Mobility/Fleets is the fastest-growing application segment being propelled forward by ride-sharing companies, fleet managers, and transit agencies looking to cut down on energy costs per kilometer and reduce dependence on charging stations through solar-powered fleet electrification programs. Commercial Transport and Utility Vehicles round off the other application segments.
Solar Integration Level Analysis
Solar-assisted vehicles dominate through commercial viability, OEM adoption, and clear consumer cost and energy benefits.
Solar-Assisted Vehicles have the highest market share of 76%, since this is the most mature and scalable variant of solar vehicles that can be offered by established OEMs in commercial volumes due to the simple fact that in this variant, solar panels help but do not provide all the power required for the operation of the vehicle. Solar-assisted vehicles remove the problem of range restriction faced by fully powered solar vehicles while still providing an opportunity for saving on energy expenses as well as extending driving range. Such pragmatic solar integration is responsible for the success of Toyota, Hyundai, and Sono Motors in launching affordable solar variants of their products.
- For instance, more than 20,000 customers had placed advance orders for the solar-electric car Sion by Sono Motors that comes with 456 embedded solar cells providing a possible 112 km of weekly travel assisted by solar power in Europe prior to the company’s restructured project in 2023.
Fully Solar-Powered Vehicles at 24% exhibit the highest rate of adoption due to innovators such as Lightyear and Aptera Motors introducing vehicles that run entirely on solar energy and which have been designed specifically for early adopters in areas with ample sunlight.
Key Market Segments
By Vehicle Type
- Passenger Cars
- Two Wheelers
- Three Wheelers
- Commercial Vehicles
By Propulsion Type
- HEV (Hybrid with Solar Assist)
- BEV (Solar-Integrated EVs)
- PHEV
By Solar Panel Type
- Monocrystalline
- Polycrystalline
- Thin-Film
By Battery Type
- Lithium-Ion
- Lead-Acid
- Solid-State & Others
By Application
- Personal Mobility
- Shared Mobility/Fleets
- Commercial Transport
- Utility Vehicles
By Solar Integration Level
- Solar-Assisted Vehicles
- Fully Solar-Powered Vehicles
Drivers
EV ecosystem scale-up enabling solar-assisted vehicles
The rapid growth of the electric vehicle (EV) market is creating a strong demand foundation for solar-powered vehicles. According to the IEA, global EV sales exceeded 20 million units in 2025 and are projected to reach 23 million units in 2026, representing around 28% of total new car sales. This expanding EV base provides a larger platform for integrating solar roofs and solar-assisted charging systems.
Rather than powering vehicles entirely through solar energy, manufacturers are increasingly using solar technology to extend driving range, support battery efficiency, power auxiliary systems, and reduce charging frequency.
Drivers Impact Analysis
| Driver | (~) % Impact on CAGR | Geographic Relevance | Impact Timeline |
|---|---|---|---|
| EV ecosystem scale-up enabling solar-assisted vehicles | 2.40% | China core, Europe core, North America core, India emerging | Short term (≤ 2 years) |
| Vehicle-integrated PV efficiency gains improving energy yield | 2.10% | Southern Europe, Central Europe, China, Japan, South Korea | Medium term (2-4 years) |
| Charging-infrastructure regulation favoring range-extending solar use cases | 1.70% | EU core, UK adjacency, India corridors, North America metros | Short term (≤ 2 years) |
| Trade-in and clean-mobility subsidies lowering premium absorption risk | 1.50% | China core, India core, selected EU markets | Short term (≤ 2 years) |
| Fleet and commercial pilots validating unit economics | 1.30% | Benelux, Nordics, DACH, urban Asia logistics corridors | Medium term (2-4 years) |
| Solar-plus-mobility decentralization for grid and energy resilience | 1.10% | India, Southern Europe, island markets, remote commercial routes | Long term (≥ 4 years) |
Restraints
Low energy yield vs vehicle load
A key limitation of solar-powered vehicles is that onboard solar generation remains relatively small compared with overall vehicle energy demand. Fraunhofer ISE’s 2025 study found average rooftop solar exposure of 2.8 kWh/m²/day and side exposure of 1.3 kWh/m²/day across 18 vehicles and more than 1 million km of monitored driving. Under favorable conditions, solar systems could cover up to 50% of annual passenger-car energy demand in Southern Europe and around 35% in Central Europe, but performance varies significantly with weather, season, location, shading, and parking behavior. As a result, solar technology mainly acts as a range extender or auxiliary power source rather than a primary propulsion system, limiting widespread adoption.
Restraint Impact Analysis
| Restraint | (~) % Impact on CAGR | Geographic Relevance | Impact Timeline |
|---|---|---|---|
| High VIPV BOM cost | -2.60% | EU core, Japan, South Korea, North America core | Medium term (2-4 years) |
| Low energy yield vs vehicle load | -2.20% | Global, weaker in high-irradiance belts | Long term (≥ 4 years) |
| Tariffs and solar input trade friction | -1.90% | North America core, India, EU import channels | Short term (≤ 2 years) |
| Battery and compliance cost layering | -1.60% | EU core, UK adjacency, North America core | Medium term (2-4 years) |
| Charging dependence still dominates use case | -1.40% | North America suburbs, India emerging, EU secondary markets | Short term (≤ 2 years) |
| Fleet-scale proof and resale risk | -1.20% | Global commercial fleets, leasing markets | Medium term (2-4 years) |
Opportunity
Fleet energy bundle
The biggest future opportunity for solar-powered vehicles lies in offering integrated mobility and energy services rather than selling vehicles alone. According to Eurelectric’s 2026 analysis, fleet operators account for around 60% of new car sales in the EU and generate 71% of new-car CO₂ emissions, while electrification could deliver up to €246 billion in cumulative operating savings by 2030. By combining vehicles, charging, software, maintenance, and energy management into subscription-based contracts, providers could achieve 300–500 basis points higher EBITDA margins, creating a scalable recurring-revenue business model beyond traditional vehicle sales.
Opportunity Impact Analysis
| Opportunity | (~) % Potential CAGR | Geographic Relevance | Execution Window |
|---|---|---|---|
| Fleet energy bundles | 2.80% | EU core, China core, North America fleets | Short term (≤ 2 years) |
| Depot solar carport stacks | 2.30% | EU logistics belts, India metros, GCC, Australia | Medium term (2-4 years) |
| Commercial auxiliary-load retrofits | 2.00% | Europe vans, Asia buses, cold-chain fleets | Short term (≤ 2 years) |
| Battery passport and SoH monetization | 1.70% | EU core, UK adjacency, Japan, South Korea | Medium term (2-4 years) |
| Emerging-market light EV platforms | 1.50% | India, Southeast Asia, Africa urban corridors | Medium term (2-4 years) |
| Grid services via solar EV fleets | 1.30% | North America core, EU core, Australia | Long term (≥ 4 years) |
Challenge
Data, warranty, and performance uncertainty
Limited long-term real-world performance data remains a challenge for the solar-powered vehicle market. While European field studies covering more than 1 million km have demonstrated that vehicle-integrated photovoltaics (VIPV) can supply up to 35%–50% of annual vehicle energy demand under favorable conditions, data remains limited across different climates, vehicle types, and operating environments. This creates uncertainty for insurers, leasing companies, and fleet operators regarding degradation rates, hail damage, repair costs, warranty claims, and residual values. As a result, higher insurance premiums and conservative resale value assumptions increase total ownership costs, slowing large-scale fleet adoption until broader performance data and reliability records become available.
Challenges Impact Analysis
| Challenge | (~) % Potential CAGR | Geographic Relevance | Mitigation Horizon |
|---|---|---|---|
| VIPV design–manufacturing complexity | -1.60% | EU regulatory hubs, Japan, North America core | Medium term (2-4 years) |
| PV supply-chain traceability burden | -1.40% | US import routes, EU core, UK | Long term (≥ 4 years) |
| EV-systems and VIPV talent gap | -1.20% | North America core, India, EU tech clusters | Long term (≥ 4 years) |
| Charging–solar interoperability and standards | -1.10% | APAC logistics corridors, EU corridors, North America | Medium term (2-4 years) |
| OEM–Tier fragmentation and risk-sharing | -1.00% | Global automotive hubs, APAC manufacturing belts | Medium term (2-4 years) |
| Data, warranty, and performance uncertainty | -0.90% | Global fleets, leasing markets, insurers | Long term (≥ 4 years) |
Geopolitical Impact Analysis
Trade policies, critical minerals, and EV industrial strategies driving global solar vehicle market dynamics.
Geopolitical tensions are increasing supply chain risks and cost pressures across the solar-powered vehicles industry, particularly for batteries, power electronics, and photovoltaic (PV) modules that rely heavily on global trade routes and critical mineral supplies. According to the IMF, disruptions in the Red Sea and drought-related restrictions in the Panama Canal reduced Suez Canal trade by 50% and Panama Canal trade by 32% in early 2024. These disruptions extended Asia-Europe shipping times by more than 10 days, forcing manufacturers to reroute cargo shipments carrying EV batteries, solar panels, and vehicle components.
Rising transportation costs have further intensified the challenge. The OECD reported that average container shipping rates in 2024 were more than 2 times higher than in 2023 and remained only 25% below the record levels experienced during the 2021 global logistics crisis. Since solar-powered vehicles already carry higher production costs due to integrated solar modules and advanced battery systems, higher freight expenses directly increase vehicle prices and reduce dealer margins, particularly in Europe and North America.
Trade policies have also emerged as a major cost factor. In May 2024, the United States expanded Section 301 tariffs on Chinese clean-energy products, increasing duties on electric vehicles from 25% to 100%, EV batteries from 7.5% to 25%, and solar cells from 25% to 50%. Given China’s dominant position in global battery and solar PV manufacturing, these tariff increases significantly raise component costs for solar-powered vehicles entering the U.S. market. Similar regulatory scrutiny in Europe through anti-subsidy investigations on Chinese EVs has further increased policy uncertainty for manufacturers.
Regional Analysis
North America leads the global solar-powered vehicles market with 36.5% revenue share in 2025.
North America dominates the global solar powered cars market with its 36.5% share in revenues by 2025, owing to the leadership of the USA as the top market worldwide in terms of investment in and promotion of solar vehicle technology. This regional dominance is enabled by the Inflation Reduction Act’s tax credit of US$ 7,500 on electric vehicle purchases and US$ 3 billion in battery manufacturing grants, presence of the most solar vehicle startup companies in the world, including Aptera Motors, Lightyear North America, and Fisker, as well as Sun Belt climate with favorable sunlight exposure levels in California, Arizona, Texas, and Florida, which helps maximize solar energy utilization by solar cars.
- For instance, in 2024, General Motors unveiled a US$ 35 billion electric vehicle electrification plan until 2025 that involved conducting feasibility studies for integrating solar roofs into its Ultium platform cars, with pilot consumer trials taking place in both the California and Texas markets achieving an 18% decrease in daily grid charge needs for the solar-roof fitted trial cars.
Key Regions and Countries Covered
- North America
- The US
- Canada
- Europe
- Germany
- France
- The UK
- Spain
- Italy
- Russia & CIS
- Rest of Europe
- APAC
- China
- Japan
- South Korea
- India
- ASEAN
- Rest of APAC
- Latin America
- Brazil
- Mexico
- Rest of Latin America
- Middle East & Africa
- GCC
- South Africa
- Rest of MEA
Key Players Analysis
The suppliers operating within the worldwide solar-powered vehicles industry leverage their competitive edge by adopting advanced technologies related to solar panel technology, energy management system for batteries, and developing partnerships with OEMs. Some of the critical areas of focus for companies operating in the segment include designing more efficient automotive-grade monocrystalline and thin-film solar panels, artificial intelligence-based solar energy management systems, and integrating vehicle-to-grid capability.
Signing long-term supply deals with Tier-1 OEM automotive customers for solar panel supply, along with pre-order and reservation programs for consumers, will provide companies with a reliable income stream and reduce customer churn until 2035.
Market Key Players
- Lightyear
- Aptera Motors
- Sono Motors
- Tesla
- Hyundai Motor Company
- General Motors
- Ford Motor Company
- Toyota Motor Corporation
- Kandi Technologies
- Squad Mobility
- Fisker Inc.
- Mahindra & Mahindra
- Volkswagen Group
- Audi
- Hanergy
- Other Key Players
Key Development
- In February 2026, Hyundai Motor Company announced a next-generation solar roof system for its Ioniq 6 electric sedan featuring 25% efficient automotive-grade cells, increasing solar daily range contribution by 35% versus its previous generation solar panel system across European fleet pilot programs.
- In March 2026, Aptera Motors commenced limited production deliveries of its solar-integrated three-wheel electric vehicle to US pre-order customers in California and Arizona, with early buyer reports confirming 55–68 km average daily solar-only range under Southwest US summer irradiance conditions.
- In May 2026, Hanergy Holding Group secured a supply agreement with two Southeast Asian commercial electric bus manufacturers for automotive-grade thin-film solar rooftop panel systems, covering an initial order of 5,000 vehicle units across Indonesian and Vietnamese urban transit fleet electrification programs.
Report Scope
| Report Features | Description |
|---|---|
| Market Value (2025) | US$ 810.0 Million |
| Forecast Revenue (2035) | US$ 5,185.0 Million |
| CAGR (2026-2035) | 20.4% |
| Base Year for Estimation | 2025 |
| Historic Period | 2020-2024 |
| Forecast Period | 2026-2035 |
| Report Coverage | Revenue Forecast, Market Dynamics, Competitive Landscape, Recent Developments |
| Segments Covered | By Vehicle Type (Passenger Cars, Two Wheelers, Three Wheelers, Commercial Vehicles), By Propulsion Type (HEV – Hybrid with Solar Assist, BEV – Solar-Integrated EVs, PHEV), By Solar Panel Type (Monocrystalline, Polycrystalline, Thin-Film), By Battery Type (Lithium-Ion, Lead-Acid, Solid-State & Others), By Application (Personal Mobility, Shared Mobility/Fleets, Commercial Transport, Utility Vehicles), By Solar Integration Level (Solar-Assisted Vehicles, Fully Solar-Powered Vehicles) |
| Regional Analysis | North America – The US & Canada; Europe – Germany, France, The UK, Spain, Italy, Russia & CIS, Rest of Europe; APAC – China, Japan, South Korea, India, ASEAN & Rest of APAC; Latin America – Brazil, Mexico & Rest of Latin America; Middle East & Africa – GCC, South Africa & Rest of MEA |
| Competitive Landscape | Lightyear, Aptera Motors, Sono Motors, Tesla, Hyundai Motor Company, General Motors, Ford Motor Company, Toyota Motor Corporation, Kandi Technologies, Squad Mobility, Fisker Inc., Mahindra & Mahindra, Volkswagen Group, Audi, Hanergy, and Other Key Players |
| Customization Scope | Customization for segments, region/country-level will be provided. Moreover, additional customization can be done based on the requirements. |
| Purchase Options | We have three licenses to opt for: Single User License, Multi-User License (Up to 5 Users), Corporate Use License (Unlimited Users and Printable PDF) |


