
Quick Navigation
Report Overview
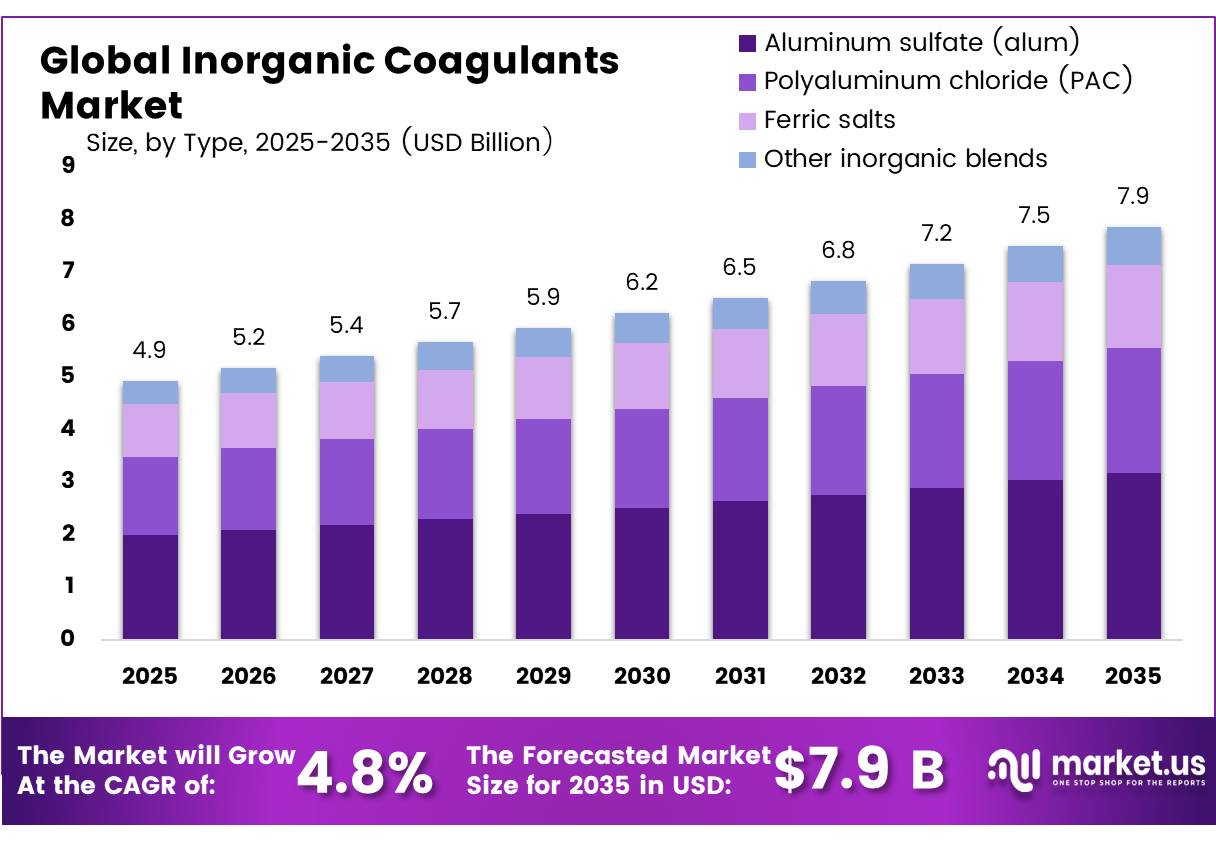
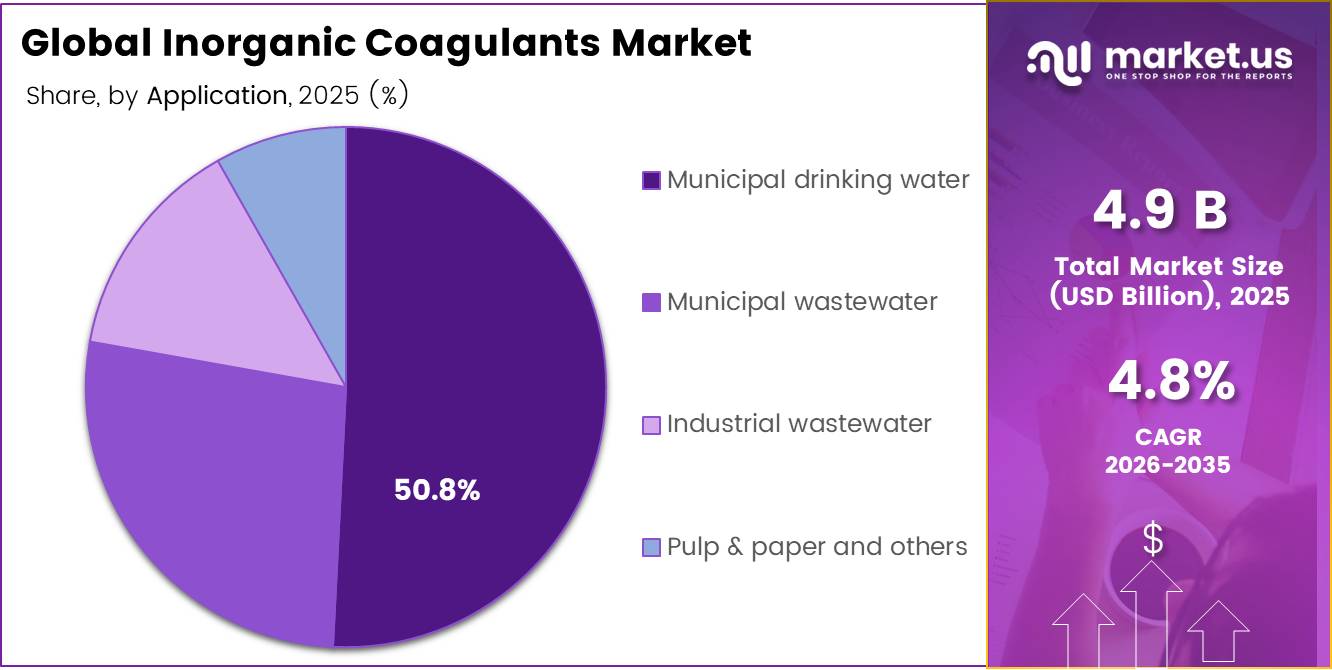
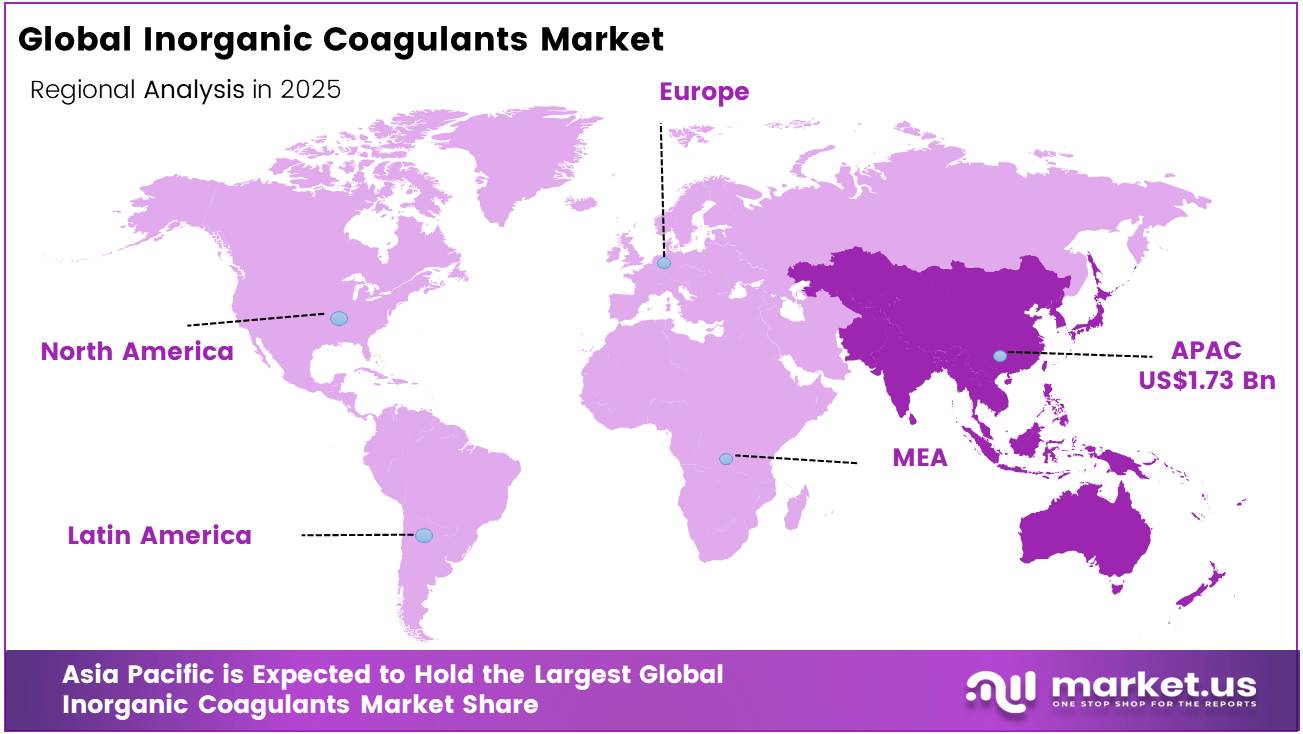
In 2025, the Global Inorganic Coagulants Market was valued at USD 4.9 billion, and between 2026 and 2035, this market is estimated to register a CAGR of 4.8%, reaching about USD 7.9 billion by 2035. Asia Pacific held a dominant market position, capturing more than a 35.1% share, holding USD 1.73 billion in revenue.
The global inorganic coagulants market occupies a foundational role in water and wastewater treatment infrastructure, where aluminum-based and iron-based compounds including aluminum sulfate, polyaluminum chloride, ferric chloride, and ferric sulfate are deployed to neutralize charged particles, aggregate suspended solids, and enable efficient separation across municipal and industrial treatment systems. Demand is structurally anchored to the scale of the global water access deficit and the inadequacy of existing treatment capacity.
- As of the latest WHO assessment, 2.1 billion people globally still lack access to safely managed drinking water, including 106 million who drink directly from untreated surface sources, while unsafe water, sanitation, and hygiene collectively drive at least 1.4 million preventable deaths each year.
Key Takeaways
- The global inorganic coagulants market was valued at US$4.9 billion in 2025.
- The global inorganic coagulants market is projected to grow at a CAGR of 4.8% and is estimated to reach US$7.9 billion by 2035.
- Based on the type, Aluminum sulfate (alum) dominated the inorganic coagulants market, with a substantial market share of around 40.5%.
- Based on the Application, Municipal drinking water led the market, comprising 50.8% of the total market.
- Among the end-uses, the Municipal utilities held a major share in the inorganic coagulants market, 50.7% of the market share.
- Among the By Form, Liquid form is the most considerable within the market, accounting for around 69.1% of the revenue.
- In 2025, the Asia Pacific was the most dominant region in the battery separator market, accounting for 35.1% of the total global consumption.
The U.S. EPA has formally identified ferric chloride, ferric sulfate, ferrous sulfate, and aluminum sulfate as core coagulation chemicals within drinking water and wastewater utility supply chains.
- According to UN Statistics Division data, in 2024 only 56 percent of global domestic wastewater generated totaling 332 billion cubic meters was safely treated, a figure largely unchanged since 2020, while data on industrial wastewater remains critically scarce, with only 22 countries currently reporting. This persistent treatment deficit sustains broad, sustained demand for coagulation chemistry as a frontline intervention in both primary and secondary treatment processes.
Production and consumption are concentrated in Asia Pacific, which accounts for the largest share of global water treatment chemical deployment, driven by rapid urbanization, expanding municipal infrastructure, and industrial effluent compliance pressures. The 2024 UN World Water Development Report confirms that global freshwater demand has been rising by approximately 1% per year since the 1980s, with agriculture accounting for roughly 70% of total freshwater withdrawals and industry contributing nearly 20% both sectors being primary end-users of inorganic coagulation treatment.
Inorganic Coagulants Market Segments
Type Analysis
Aluminum sulfate represents dominant Segment in the Market.
Aluminum sulfate (alum) leads the global inorganic coagulants market by type, commanding a 40.5% share on the back of its low cost, widespread availability, and deep institutional entrenchment across municipal and industrial treatment systems. The U.S. EPA classifies aluminum sulfate as one of the most widely used aluminum-based coagulants in water and wastewater treatment, with approximately 45% of total domestic consumption attributed directly to the water sector, spanning drinking water treatment, municipal wastewater treatment, industrial wastewater treatment, and source water clarification.
This dominance is reinforced by the sheer scale of the global treatment deficit with WHO confirming that unsafe water, sanitation, and hygiene drive at least 1.4 million preventable deaths annually sustaining persistent, cost-sensitive demand where alum remains the default coagulant of choice.
Polyaluminum chloride (PAC) is the fastest-growing type segment and gaining ground across both municipal and industrial applications where tighter effluent standards demand higher-performance coagulation chemistry. Its adoption is closely tied to the global wastewater treatment gap UN data confirms that in 2024, only 56% of global domestic wastewater was safely treated, with industrial wastewater reporting remaining critically incomplete across most countries driving investment in more effective alternatives to conventional alum, particularly across rapidly urbanizing Asia Pacific economies
Application Analysis
Municipal drinking water a significant type.
Municipal drinking water is the biggest chunk of the global inorganic coagulants market, taking up 50.8% of the total use. This section’s lead is backed by growing water treatment plants and tougher rules on water quality. In 2024, the WHO and UNICEF say 74% of folks had access to safe drinking water, an increase from 68% in 2015. That means nearly one billion more people are getting safe water. Still, 2.1 billion people in 2024 couldn’t get safe drinking water when they need it, showing a big need for coagulants like aluminum sulfate and polyaluminum chloride.
- In the US, the EPA says public water systems serve around 90% of Americans, drawing from over 148,000 sources. This just shows how vital the municipal sector is for inorganic coagulants.
The fastest growing segment is that of industrial wastewater treatment. Around 80% of the total wastewater produced globally gets discharged without proper treatment. Industrial sites are installing zero-liquid discharge (ZLD) systems, necessitating superior coagulation technology.
Form Analysis
Liquid Form Are the Most Widely Used.
The most predominant market form is the liquid inorganic coagulant segment, accounting for 69.1% of total market value. The highest market share can be attributed to the benefits offered by the use of liquid forms such as ease of handling, accurate dose delivery, and no need for dissolving as done in case of solid coagulants. Higher concentration of liquids provides the benefit of lower transportation volume along with precise dose delivery in automatic plants.
The powdered form of inorganic coagulants is the fastest growing segment in the market. They are highly favored because of their extended shelf life and easy storage. The powdered varieties can be used in areas that are difficult to access, and offer an economic benefit regarding logistics.
End Use Analysis
Inorganic coagulant Are Mostly Utilized in the Municipal utilities.
Municipal utilities lead the global inorganic coagulants market with a big 50.7% share, mainly because they use lots of aluminum and iron-based coagulants for treating drinking water and wastewater. They get a boost from steady government funding for water projects, rules on water quality, and building more city water networks. In 2024, WHO and UNICEF noted that 5.8 billion folks had access to proper sanitation, highlighting just how huge municipal treatment systems really are.
Industrial facilities is the fastest growing end user of the inorganic coagulants. Industries are getting better at water recycling and handling waste more rigorously, leading to increased use of treatment tech, like processes with inorganic coagulants. The United Nations stated that industries and energy plants together take about 19% of fresh water, which drives companies to invest more in advanced treatment techniques.
Key Market Segments
By Type
- Aluminum sulfate (alum)
- Polyaluminum chloride (PAC)
- Ferric salts
- Other inorganic blends
By Application
- Municipal drinking water
- Municipal wastewater
- Industrial wastewater
- Pulp & paper and others
By Form
- Liquid
- Powder / solid
- Blended formulations
By End Use
- Municipal utilities
- Industrial facilities
- Pulp & paper
- Oil & gas and power
Driver Analysis
EPA requires public water systems to comply with key Lead and Copper Rule Revisions obligations from October 16, 2024, including initial service-line inventories, public notification, and associated reporting, while the broader Lead and Copper Rule framework still anchors action thresholds at 15 ppb for lead and 1.3 ppm for copper at customer taps.
That matters for inorganic coagulants because once utilities intensify corrosion control and distribution-risk management, they typically also tighten upstream raw-water clarification and residual metals management to stabilize finished-water quality, especially where alum- or iron-based treatment interfaces with pH, alkalinity, and sludge handling economics; in practice this lifts optimization spending, lab testing frequency, and chemical switching activity rather than only tonnage consumption.
Drivers Impact Analysis
| Driver | (~) % Impact on CAGR Forecast | Geographic Relevance | Impact Timeline |
|---|---|---|---|
| Lead-service-line compliance and corrosion-control optimization lifting potable treatment chemical intensity | +1.6% | North America core, selective OECD spill-over | Short term (≤ 2 years) |
| Water reuse scale-up raising tertiary clarification and polishing demand | +2.1% | APAC corridors, Middle East, North America, Latin America urban clusters | Medium term (2-4 years) |
| Stricter phosphorus-removal mandates increasing ferric/alum dosing in wastewater plants | +1.8% | EU core, North America regulated basins | Short term (≤ 2 years) |
| Water-stress exposure pushing utilities toward source-flexibility and higher coagulant usage | +1.3% | Western U.S., MENA, India, northern China, Australia | Medium term (2-4 years) |
| Aesthetic and residual-quality pressure sustaining aluminum and iron salt use in drinking water polishing | +0.9% | North America, Europe, developed APAC | Short term (≤ 2 years) |
| Programmatic public funding improving plant upgrade conversion into chemical offtake | +1.4% | North America core, Latin America, emerging Asia | Medium term (2-4 years) |
Restraint Analysis
Inorganic coagulants are manufactured in energy-sensitive chemical chains, so even though EIA expects Henry Hub prices to remain relatively moderate, the market still faces budgeting uncertainty because the agency reported May 2026 spot gas at $2.94/MMBtu, forecasts about $3.34/MMBtu in 2H26 and $3.46/MMBtu in 2027, and also highlights demand growth tied to summer power generation, which keeps industrial electricity and steam costs exposed to weather and grid conditions rather than fully stable.
For aluminum- and iron-based coagulants, that matters because sulfuric acid, chlor-alkali, drying, concentration, and storage operations carry fixed energy loads, so even a mid-single-digit utility inflation swing can erase a meaningful share of producer EBITDA when annual supply contracts are reset only quarterly or semiannually; the result is margin compression, more surcharge negotiations, and occasional underbidding restraint in public tenders where customers resist rapid repricing despite volatile conversion costs
Restraint Impact Analysis
| Restraint | (~) % Impact on CAGR Forecast | Geographic Relevance | Impact Timeline |
|---|---|---|---|
| Utility-cost volatility | -1.5% | North America core, EU, energy-importing APAC | Short term (≤ 2 years) |
| Freight-heavy distribution | -1.2% | North America interior, Latin America, APAC corridors | Short term (≤ 2 years) |
| Municipal capex lag | -1.7% | North America, EU, emerging Asia | Medium term (2-4 years) |
| Hazardous handling burden | -1.0% | North America core, EU, developed APAC | Medium term (2-4 years) |
| Sludge disposal drag | -1.3% | EU core, U.S. regulated basins, advanced APAC | Medium term (2-4 years) |
| Input-price pass-through limits | -1.4% | Global, strongest in tender-led markets | Short term (≤ 2 years) |
Opportunity Analysis
This is an untapped opportunity rather than a current driver because the World Bank shows reuse is still underpenetrated despite strong structural logic: potable and industrial reuse could grow 8-fold by 2040 to 430 million cubic meters per day, yet potable and industrial reuse today represents only 3 percent of municipal freshwater withdrawals, and total reuse across all applications is only 12 percent, leaving a large unconverted design-and-operations market where inorganic coagulant suppliers can standardize pretreatment skids, dosing recipes, and sludge-handling packages for repeatable deployment instead of waiting for one-off municipal tenders.
The value-creation logic is compelling because the World Bank also estimates up to US$340 billion of potential investment by 2040, and standardization can let coagulant vendors move from commodity tonnage sales into higher-margin specification capture, design assistance, and lifecycle chemical contracts, lifting gross margin by an estimated 200 to 400 basis points and shortening customer acquisition cycles by 15 to 25 percent in urban clusters where wastewater sits close to industrial demand centers.
Opportunity Impact Analysis
| Opportunity | (~) % Potential CAGR Upside | Geographic Relevance | Execution Window |
|---|---|---|---|
| Reuse-plant standardization | +2.4% | APAC emerging, MENA, Latin America, U.S. Sun Belt | Medium term (2-4 years) |
| PFAS pretreatment bundling | +1.8% | North America core, EU high-surveillance zones | Short term (≤ 2 years) |
| Industrial park closed loops | +2.0% | China, India, GCC, Southeast Asia | Medium term (2-4 years) |
| Coagulant-as-a-service | +1.5% | North America, EU, developed APAC | Short term (≤ 2 years) |
| Brackish-reuse pretreatment | +1.3% | U.S. West, MENA, Australia, northern Mexico | Medium term (2-4 years) |
| Utility platform roll-ups | +1.6% | Fragmented North America, Latin America, India | Long term (≥ 4 years) |
Challenges Analysis
The energy‑linked cost volatility challenge stems from the inorganic coagulants sector’s dependence on gas‑ and power‑intensive upstream chains (acids, chlor‑alkali, evaporation, drying) that embed EIA‑tracked natural gas and electricity price swings directly into unit production cost even when headline commodity prices appear stable, as the Short‑Term Energy Outlook still projects U.S. marketed natural gas production to grow 3.3 percent in 2026 and 2.5 percent in 2027 with spot prices moving from sub‑$3/MMBtu levels toward the mid‑$3 range as supply–demand balances shift.
This volatility does not halt current shipments but introduces a persistent friction drag because producers must constantly reconcile quarterly or semi‑annual price escalators in water‑utility contracts against month‑to‑month input moves, leading to hedging costs, risk premiums in tenders, and cautious inventory policies; a 10–15 percent swing in energy‑related conversion cost can easily compress gross margins by 150–250 basis points if pass‑through lags by even one quarter, and over a multi‑year horizon this dynamic forces capital allocation toward energy‑efficiency retrofits, on‑site generation, and portfolio balancing rather than pure capacity expansion, which moderates the maximum achievable CAGR even as end‑market demand for treated water continues to grow.
Challenges Impact Analysis
| Challenge | (~) % CAGR Friction Drag | Geographic Relevance | Mitigation Horizon |
|---|---|---|---|
| Energy-linked cost volatility | -1.3% | North America core, EU, energy-importing APAC | Medium term (2-4 years) |
| Bulk-chemical logistics strain | -1.1% | North America interior, EU corridors, APAC hubs | Medium term (2-4 years) |
| High compliance complexity | -1.0% | India, broader APAC, EU regulatory hubs | Long term (≥ 4 years) |
| Skilled operations gap | -0.9% | Global, acute in emerging Asia | Long term (≥ 4 years) |
| Evolving water standards | -1.2% | North America core, EU, advanced APAC | Medium term (2-4 years) |
| Capital-cycle and tariff risk | -1.0% | Emerging markets, fiscally stressed utilities | Long term (≥ 4 years) |
Geopolitical Impact Analysis
Geopolitical Realignment and Supply Chain Fragmentation Reshaping Inorganic Coagulants Manufacturing.
There have been significant effects from the US tariff policies that were implemented in 2025, which have impacted various segments within the inorganic coagulants value chain and led to the re-evaluation of purchasing decisions, pricing, and manufacturing activities throughout the world. Among other major competitors for instance Kemira, Solenis, Ecolab or Feralco Group, The increasing costs resulting from tariff policies in the importation process forced the purchasers to assess opportunities for obtaining the goods domestically, and speed up supplier certification processes.
Chemical feedstock supplies from the Middle East are experiencing disruptions due to geopolitical factors in the region, which are constraining supply levels of exports from Gulf countries. Such developments are leading to major changes in the global supply chain structure, with a shift from cost-driven purchases to resilient logistics strategies.
Regional Analysis
Asia Pacific Held the Largest Share of the Global Battery Separator Market.
Asia Pacific emerges as the leading regional market with a 35.1% global market share. As per the statistics provided by the Ministry of Water Resources of China, the total investment made in the water conservancy construction was recorded at 5.68 trillion yuan (US$813.46 billion) within the 14th Five-Year Plan (2021-2025) period.
The said period accounted for an investment 1.6 times higher than the prior five-year period. Moreover, investment exceeded 1 trillion yuan each year for four consecutive years starting from 2022 to reach 1.3529 trillion yuan in 2024. China alone constitutes about 35% share of the global inorganic coagulant production due to such colossal infrastructure development projects.
The Middle East & Africa region is the fastest growing market. Desalination and water reuse infrastructure development backed by governments is boosting the demand for coagulants. Almost 80% of the world’s wastewater still gets discharged without any proper treatment.
Key Regions and Countries Covered
- North America
- The US
- Canada
- Europe
- Germany
- France
- The UK
- Spain
- Italy
- Russia & CIS
- Rest of Europe
- APAC
- China
- Japan
- South Korea
- India
- ASEAN
- Rest of APAC
- Latin America
- Brazil
- Mexico
- Rest of Latin America
- Middle East & Africa
- GCC
- South Africa
- Rest of MEA
Key Players Analysis
Competitiveness of inorganic coagulant players depends largely on technology differentiation, production economy of scale and value chain integration. Inorganic coagulants require constant development of new products characterized by high levels of purity, basicity, and blended formulas that promote sedimentation, effective turbidity removal and reduced amounts of sludge produced. Another area of interest for many inorganic coagulants companies relates to the growth of their production capacities of liquid formulas, which account for 69.1% of the market share due to convenient handling and high accuracy dosing.
Vertical integration involving cooperation with producers of raw materials, such as aluminum hydroxide, hydrochloric acid, and ferric chloride helps to ensure raw material stability and lower costs against high volatility of raw material prices. Strategic capacity expansion, especially in the Asia Pacific that accounts for 35.1% of total market share, ensures that the company aligns its efforts with growing demand from municipal water utility companies and plants engaged in wastewater treatment. Quality standardization, increased automation, compliance with requirements by EPA and other agencies and establishment of long-term supply contracts with municipalities and industries help to consolidate leadership in premium segments.
Market Key Players
- BASF SE
- Kemira Oyj
- Solenis LLC
- Ecolab Inc. (Nalco Water)
- SNF Group (SNF S.A.S.)
- Kurita Water Industries Ltd.
- Suez SA (Veolia group)
- Nouryon
- Evonik Industries AG
- Danaher Corporation
- Feralco AB
- USALCO LLC
- GEO Specialty Chemicals Inc.
- Chemtrade Logistics
- Grupo Bauminas
- Buckman Laboratories International Inc.
- Ixom Operations Pty Ltd.
- Alumichem A/S
- AKKIM Kimya (Akkim)
- Holland Company Inc.
- Others
Key Development
- In November 2024, Solenis LLC got bigger when they bought BASF’s flocculants business, which boosted their inorganic coagulants and specialty chemicals line in mining and water treatment. This move made them stronger competitors in the global market for municipal and industrial coagulation.
- In September 2024, Kemira Oyj wrapped up the purchase of Norit’s UK reactivation business. This move got them into the activated carbon market for cleaning up micropollutants. They expanded their water treatment chemicals line, stepping up from just traditional inorganic coagulants.
Report Scope
| Report Features | Description |
|---|---|
| Market Value (2025) | USD 4.9 Bn |
| Forecast Revenue (2035) | USD 7.9 Bn |
| CAGR (2026-2035) | 4.8% |
| Base Year for Estimation | 2025 |
| Historic Period | 2020-2024 |
| Forecast Period | 2026-2035 |
| Report Coverage | Revenue Forecast, Market Dynamics, Competitive Landscape, Recent Developments |
| Segments Covered | By Type (Aluminum sulfate (alum), Polyaluminum chloride (PAC), Ferric salts , Other inorganic blends), By Application (Municipal drinking water, Municipal wastewater, Industrial wastewater, Pulp & paper and others), By Form (Liquid, Powder / solid, Blended formulations), By End Use (Municipal utilities, Industrial facilities, Pulp & paper, Oil & gas and power) |
| Regional Analysis | North America – The US & Canada; Europe – Germany, France, The UK, Spain, Italy, Russia & CIS, Rest of Europe; APAC– China, Japan, South Korea, India, ASEAN & Rest of APAC; Latin America– Brazil, Mexico & Rest of Latin America; Middle East & Africa– GCC, South Africa, & Rest of MEA |
| Competitive Landscape | BASF SE, Kemira Oyj, Solenis LLC, Ecolab Inc. (Nalco Water), SNF Group (SNF S.A.S.), Kurita Water Industries Ltd., Suez SA (Veolia group), Nouryon, Evonik Industries AG, Danaher Corporation, Feralco AB, USALCO LLC, GEO Specialty Chemicals Inc., Chemtrade Logistics, Grupo Bauminas, Buckman Laboratories International Inc., Ixom Operations Pty Ltd., Alumichem A/S, AKKIM Kimya (Akkim), Holland Company Inc., Others. |
| Customization Scope | Customization for segments, region/country-level will be provided. Moreover, additional customization can be done based on the requirements. |
| Purchase Options | We have three licenses to opt for: Single User License, Multi-User License (Up to 5 Users), Corporate Use License (Unlimited Users and Printable PDF) |


