


Report Overview
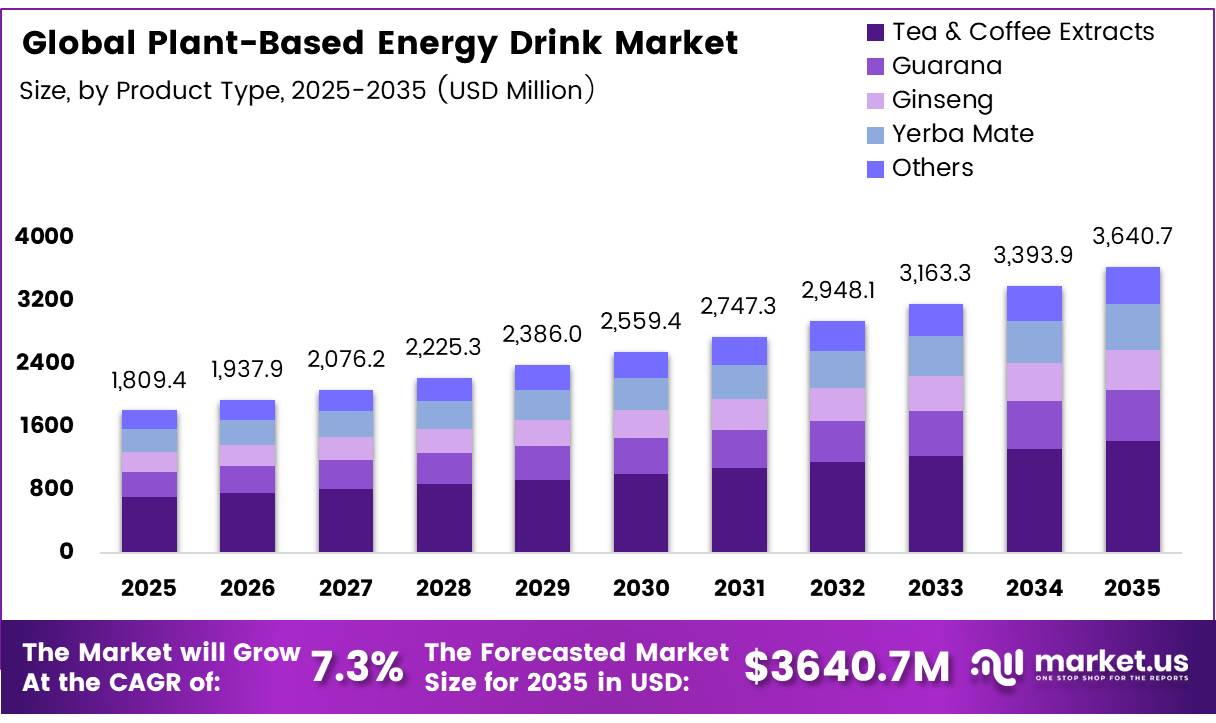
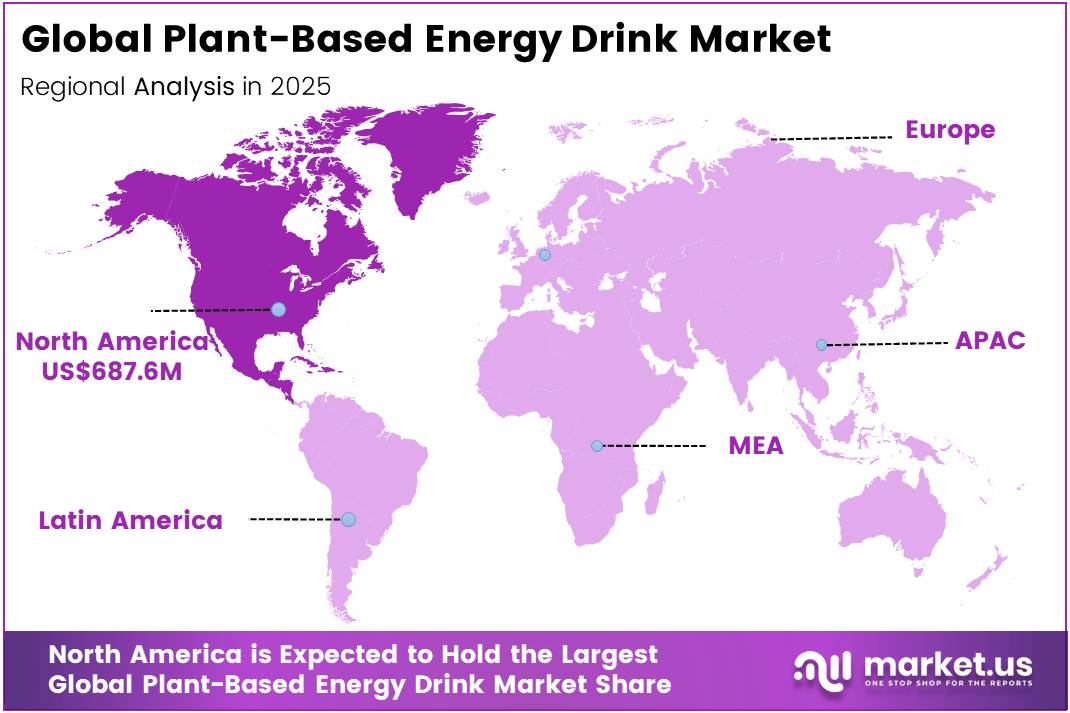
In 2025, the Global Plant-Based Energy Drink Market was valued at USD 1,809.4 million, and between 2026 and 2035, this market is estimated to register a CAGR of 7.3% reaching about USD 3,640.7 million by 2035. In 2025, North America led the market, achieving over 38% share with a revenue of USD 687.57 Million.
Plant-based energy drinks are functional beverages made with botanical caffeine and ingredients such as tea, coffee, guarana, yerba mate, fruit extracts, vitamins and electrolytes. They are positioned as alternatives to conventional energy drinks by emphasizing vegan formulations, recognizable ingredients, lower sugar and natural flavours.
- In May 2025, the Food and Agriculture Organization estimated world tea production at 7.3 million tonnes and tea imports at 2.0 million tonnes, indicating a large raw-material base for tea-derived caffeine and antioxidant ingredients.
- According to the World Health Organization, 31% of adults worldwide, around 1.8 billion people, are physically inactive, and this share could reach 35% by 2030 if current trends continue, which is pushing governments, gyms and health influencers to promote more sport, fitness and active lifestyles, and in turn boosts demand for convenient energy and recovery drinks that are seen as cleaner and more natural than traditional high sugar options.
At the same time, UN youth data shows about 1.2 billion people aged 15–24, roughly 16% of the global population, entering peak consumption and experimentation years, which structurally supports higher volumes of on the go energy beverages, especially those with plant ingredients that match Food and Agriculture Organization messaging on pulses and plant protein as a vital nutrition source.
This expanding base of young, time pressed, health aware consumers directly pulls through to plastic based packaging, as PET bottles already account for nearly half of beverage packaging materials and bottles are projected to hold around 35% share of total beverage packs because they are light, safe, low cost and compatible with existing bottling lines used for water and soft drinks.
As plant based energy drinks move from niche to mainstream and scale through convenience stores, gyms and online channels, brand owners rely on plastic bottles to minimize logistics costs per unit and reach emerging markets where glass and cans face handling and cold chain limits, so every percentage point increase in plant based energy drink consumption translates almost directly into higher plastic packaging volumes, creating a strong and durable growth path for plastic based formats supported by WHO, UN and FAO statistics on inactivity, youth population and plant protein.
Key Takeaways
- The global plant-based energy drinks market was valued at USD 1,809.4 million in 2025.
- The global plant-based energy drinks market is projected to grow at a CAGR of 7.3% and is estimated to reach USD 3,640.7 million by 2035.
- On the basis of product type, the natural caffeine-based drinks dominated the market, constituting 46% of the total market share in 2025.
- Based on the ingredient source, the tea & coffee extracts dominated the plant-based energy drinks market, with a substantial market share of around 39% in 2025.
- Based on the packaging type, cans led the market, comprising 58% of the total market in 2025.
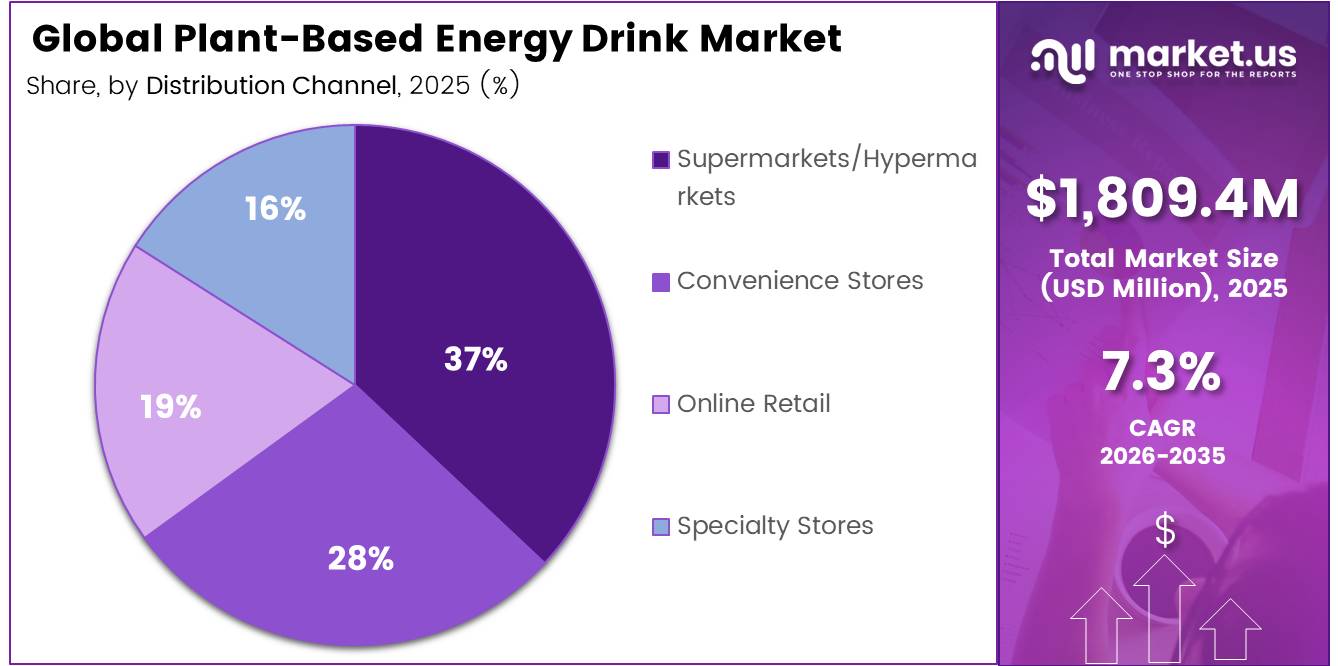
- Among the distribution channels, the supermarkets/hypermarkets industry held a major share in the plant-based energy drinks market, 37% of the market share in 2025.
- Among the consumer groups, the millennials & gen z is the most considerable within the market, accounting for around 41% of the revenue in 2025.
- Among the applications, Daily Energy & Focus industry held a major share in the plant-based energy drinks market, 44% of the market share in in 2025.
- In 2025, North America was the most dominant region in the plant-based energy drinks market, accounting for 38% of the total global consumption.
Product Type Analysis
Natural caffeine-based drinks represent dominant Segment in the Market.
Natural caffeine‑based drinks are dominant by 46% in the product type segment, showing that plant‑derived stimulants anchor most energy formulations in this market. Energy drink research consistently notes that caffeine is the major ingredient and typical drinks carry around 80–150 mg of caffeine per serving, similar to strong coffee, and today many “healthy” energy drinks obtain this caffeine from coffee beans, tea leaves and guarana plants rather than synthetic sources, making natural caffeine formats feel familiar yet cleaner to consumers.
Adaptogen‑based energy drinks are fastest‑growing in the product type segment, reflecting a strong move toward drinks that help with stress, mood and mental resilience, not just short‑term stimulation. Recent market work on adaptogenic drinks describes demand as “skyrocketing”, with the category singled out as one of the most dynamic parts of functional beverages as people look for natural health solutions and balanced energy instead of relying only on high‑caffeine products
Ingredient Source Analysis
Tea & Coffee Extracts Represent a Significant Ingredient Source.
Tea and coffee extracts 39% dominate the ingredient segment due to their established supply chains, regulatory acceptance, and strong consumer familiarity. Ingredients such as green tea extract, matcha, and green coffee extract benefit from widely available sourcing networks and recognized safety profiles, enabling manufacturers to develop products with lower compliance risks and faster commercialization timelines. Their familiarity also supports stronger retail acceptance, as consumers readily understand the benefits associated with naturally sourced caffeine.
Ginseng is the fastest-growing ingredient category, driven by increasing demand for functional wellness beverages and improved availability of standardized extracts. Advances in ingredient processing and global commercialization initiatives have enhanced supply consistency, making ginseng more accessible for beverage manufacturers. Companies are increasingly incorporating Korean red ginseng and other standardized variants to differentiate products with focus, energy, and wellness positioning.
Packaging Type Analysis
Cans Are the Most Widely Used Packaging Type
Cans hold the largest packaging 58% share due to their ability to preserve product quality, support sustainability objectives, and optimize distribution efficiency. Aluminum provides superior protection against oxygen and light exposure, helping maintain the stability and flavor of sensitive botanical ingredients such as green tea catechins and yerba mate extracts.
Sachets and powder mixes are experiencing rapid growth due to their convenience, portability, and lower distribution costs. Unlike ready-to-drink beverages, powder formats eliminate the need for cold-chain logistics and enable manufacturers to reach broader consumer segments through e-commerce and subscription-based sales models.
Distribution Channel Analysis
Supermarkets and hypermarkets Held a Major Share of the Plant Based Energy Drink Market.
Supermarkets and hypermarkets account for the 37% largest distribution channel share due to their extensive consumer reach, strong merchandising capabilities, and ability to support product visibility through promotions and category placement. These retail formats provide plant-based energy drink brands with access to a broad customer base while enabling retailers to expand their functional beverage offerings.
Online retail is the fastest-growing distribution channel, supported by the increasing adoption of e-commerce, subscription purchasing, and targeted digital marketing. Direct-to-consumer platforms allow brands to reach niche consumer groups, gather purchasing insights, and build recurring revenue streams without the constraints of physical shelf space.
Consumer Group Analysis
Millennials and Gen Z lead both consumption and market expansion
Millennials and Gen Z lead both consumption and market expansion 41% because their relationship with energy beverages is behaviorally different from older cohort’s energy consumption is built into daily productivity and wellness routines rather than used as an occasional performance tool, which drives higher purchase frequency and genuine tolerance for premium pricing when functional credentials are clearly communicated.
The habitual integration matters commercially, a consumer who incorporates a plant-based energy drink into their morning routine generates predictable weekly purchase velocity that a situational energy drink user simply does not, and that velocity consistency is what makes the demographic disproportionately valuable to both brands calculating lifetime customer economics and retailers building planogram velocity assumptions.
Application Analysis
Daily energy and focus applications hold the largest market
Daily energy and focus applications hold the largest market share 44% because they align with recurring consumption habits and established consumer needs. Many consumers use plant-based energy drinks as alternatives to coffee or conventional energy beverages, making adoption easier than entirely new functional beverage categories.
The segment also benefits from consistent demand throughout the day, including morning productivity, workplace performance, studying, commuting, and afternoon energy support. Unlike specialized wellness applications that depend on specific consumption occasions, daily energy products address a universal need for sustained alertness and mental focus, resulting in higher purchase frequency and stronger repeat consumption patterns.
Wellness and functional health is the fastest-growing application segment as consumers increasingly seek beverages that deliver benefits beyond energy. Products incorporating adaptogens, botanicals, and functional ingredients are attracting consumers interested in stress management, recovery, and overall well-being.
Key Market Segments
By Product Type
- Natural Caffeine-Based Drinks
- Protein Energy Drinks
- Adaptogen-Based Energy Drinks
- Electrolyte Plant Drinks
- Functional Botanical Drinks
By Ingredient Source
- Tea & Coffee Extracts
- Guarana
- Ginseng
- Yerba Mate
- Others
By Packaging Type
- Cans
- Bottles
- Sachets & Powder Mixes
By Distribution Channel
- Supermarkets/Hypermarkets
- Convenience Stores
- Online Retail
- Specialty Stores
By Consumer Group
- Fitness Consumers
- Millennials & Gen Z
- Working Professionals
- Others
By Application
- Sports Nutrition
- Daily Energy & Focus
- Wellness & Functional Health
Driver Analysis
Sugar Tax & Regulatory Tailwind
The UK Soft Drinks Industry Levy (SDIL) currently set at £1.94 per 10 litres for beverages between 4.5g–7.9g sugar per 100ml, and £2.59 per 10 litres above 8g was confirmed in November 2025 to lower its minimum threshold from 5g to 4.5g total sugar per 100ml effective January 1, 2028, forcing an estimated 25–35% of currently compliant formulations to reformulate or absorb material cost increases.
The UK government projects these changes will cut 17 million daily calories from national intake and deliver nearly £1 billion in combined health and economic value. Concurrently, the UAE transitioned in January 2026 from a flat 50% excise on sugary beverages to a tiered volumetric sugar-content tax structure, with energy drinks maintaining a 100% excise rate as a category but SSBs now taxed by sugar per 100ml bracket directly incentivizing GCC-market plant-based low-sugar launches targeting the <5g/100ml threshold to access the lowest levy tier.
Drivers Impact Analysis
| Driver | (~) % Impact on CAGR | Geographic Relevance | Impact Timeline |
|---|---|---|---|
| Health & Wellness Shift | +2.4% | North America core; EU key markets (UK, Germany, France); APAC premium urban corridors (Australia, Japan, South Korea) | Short term (≤ 2 years) |
| Adaptogen & Nootropic Integration | +1.9% | North America core; EU (Nordics, DACH region); APAC spill-over (India, Australia) | Medium term (2–4 years) |
| Sugar Tax & Regulatory Tailwind | +1.5% | EU (UK SDIL); GCC (UAE tiered excise from Jan 2026); APAC (Thailand, Australia); South America emerging | Short term (≤ 2 years) |
| Gen Z & Millennial Demographic Engine | +1.7% | North America (US lead); Western Europe; APAC youth-dense markets (India, Indonesia, Philippines) | Short term (≤ 2 years) |
| Asia-Pacific Urbanization & E-Commerce Expansion | +2.1% | APAC core (China, India, Vietnam, Indonesia); ASEAN tier-2 city corridors; South America spill-over | Medium term (2–4 years) |
| Sustainable Packaging Mandate | +0.9% | EU (primary mandate); North America (ESG-driven corporate commitment); APAC (Australia, Japan); GCC emerging | Long term (≥ 4 years) |
Restraint Analysis
High ingredient & formulation costs
The first critical restraint is the structurally higher Bill of Materials embedded in plant‑based energy drinks versus synthetic, commodity formulations, which compresses gross margins and forces brands into narrow pricing corridors that limit volume scalability: synthetic caffeine can be procured at roughly USD 4–7/kg at industrial scale, whereas natural caffeine equivalents such as guarana extract, yerba mate, and matcha typically command 3–6× that level USD 20–40/kg depending on origin, standardization, and certification, implying ingredient‑line inflation of 15–25% for like‑for‑like stimulant payloads.
Clean‑label functional ingredients add further cost pressure, with branded ashwagandha or other adaptogens pricing at USD 50–80/kg for food‑grade, clinically backed extracts, and B‑vitamin complexes formulated to EU or Health Canada standards adding another USD 0.03–0.06 per unit at the dosage levels used in functional beverages. On top of this, aluminum can prices which dominate modern energy drink packaging portfolios at close to 98% by weight for leaders such as Monster have tracked metal volatility and recycling cost increases, pushing packaging cost inflation into the mid‑single‑digit percentage range since 2022.
Restraint Impact Analysis
| Restraint | (~) % Impact on CAGR | Geographic Relevance | Impact Timeline |
|---|---|---|---|
| High ingredient & formulation costs | -2.3% | North America core; EU; APAC premium hubs | Medium term (2–4 years) |
| Limited consumer price tolerance & premium positioning risk | -1.8% | North America; EU; India, Brazil urban | Short term (≤ 2 years) |
| Regulatory ambiguity & labeling complexity | -1.5% | US, Canada; EU; Australia, New Zealand | Medium term (2–4 years) |
| Fragmented supply chains & botanical sourcing risk | -1.7% | APAC corridors; Latin America; Africa | Medium term (2–4 years) |
| Channel congestion & high CAC in DTC/e-commerce | -1.6% | North America; EU; India, Southeast Asia | Short term (≤ 2 years) |
| Brand trust deficit vs legacy energy majors | -1.2% | Global, strongest in APAC & LATAM | Long term (≥ 4 years) |
Opportunity Analysis
SaaS‑style personalization & subscription stacking
In practical terms, global DTC ecommerce exceeded USD 200 billion in 2025 and continues to grow, yet only a small fraction of beverage brands are integrating algorithmic personalization engines that adjust ingredient intensity and delivery cadence in real time. If plant‑based energy drink players adopted a SaaS‑style stack e.g., tiered subscriptions at USD 30, 60, and 90 per month with auto‑adjusted formulations and upsell modules and pushed average LTV from an industry baseline of ~USD 120–150 over 12–18 months to USD 250–300 through reduced churn and ARPU expansion, the incremental contribution margin could realistically expand by 8–12 percentage points per cohort, even accounting for higher tech and data privacy costs.
CAC savings of 15–25% are achievable when personalization and retention tooling lift 90‑day repeat rates into the 55–65% band versus current 30–40% levels typical for non‑personalized wellness beverages. Because this is not yet standard practice in the category, it qualifies as a future strategic pivot rather than a driver; successful execution would add an estimated +2.3 percentage points of CAGR upside by turning a large portion of revenue into durable, predictable ARR‑like streams with higher valuation multiples and more aggressive reinvestment capacity.
Opportunity Impact Analysis
| Opportunity | (~) % Potential CAGR Upside | Geographic Relevance | Execution Window |
|---|---|---|---|
| SaaS-style personalization & subscription stacking | +2.3% | North America core; EU; India urban | Short term (≤ 2 years) |
| Cross-category convergence (energy + protein + hydration) | +2.0% | North America; EU; APAC gyms & convenience | Medium term (2–4 years) |
| Ayurveda & regional botanicals export platforms | +1.9% | India core; APAC; EU wellness hubs | Medium term (2–4 years) |
| Co-branding with sports, gaming & creator ecosystems | +1.7% | North America; EU; APAC youth corridors | Short term (≤ 2 years) |
| White-label B2B formulation & ingredient licensing | +1.6% | Global; strongest in EU & APAC manufacturing hubs | Medium term (2–4 years) |
| ESG-linked financing & carbon-smart supply chains | +1.4% | EU core; North America; Japan, Australia | Long term (≥ 4 years) |
Challenges Analysis
Volatile botanical input yields
Supply disruptions from regional events for example, flooding or drought affecting South American yerba mate plantations or Indian ashwagandha fields can extend lead times from typical 30–45 days to 60–90 days, forcing brands to increase safety stocks by 20–40% just to maintain service levels, which ties up incremental working capital per SKU and raises inventory carrying costs by mid‑single digits. Organic and fair‑trade certified inputs amplify the issue because certification‑compliant plots often represent only 20–40% of total acreage, meaning that a single poor harvest can tighten premium supply and widen price differentials versus conventional material by 15–20%.
To navigate this, companies must invest in multi‑origin sourcing strategies, long‑term farmer contracts, and internal forecasting tools that track yield and price risk with statistical confidence, as well as in flexible formulation frameworks that allow minor ingredient ratio adjustments without compromising taste or label claims; these measures demand capex and opex in agronomy teams, sourcing analytics, and inventory systems, which cumulatively drag CAGR by around 1.4 percentage points relative to a hypothetical friction‑free supply environment, and will require at least a 4–7 year horizon of investment and learning before the industry can materially dampen this volatility.
Challenges Impact Analysis
| Challenge | (~) % CAGR Friction Drag | Geographic Relevance | Mitigation Horizon |
|---|---|---|---|
| Volatile botanical input yields | -1.4% | APAC sourcing; LATAM; Africa | Long term (≥ 4 years) |
| Formulation & regulatory complexity | -1.2% | US; Canada; EU hubs | Medium term (2–4 years) |
| Skilled R&D & regulatory talent gap | -1.1% | Global; strongest in APAC, LATAM | Long term (≥ 4 years) |
| Multi-channel logistics & cold-chain strain | -1.0% | North America; EU; APAC corridors | Medium term (2–4 years) |
| Data, privacy & personalization infrastructure burden | -0.9% | North America; EU; India urban | Medium term (2–4 years) |
| Competitive noise & signal dilution in wellness beverages | -0.8% | Global; high in US, EU | Long term (≥ 4 years) |
Geopolitical Impact Analysis
Active Conflict and Trade Fragmentation Are Restructuring Botanical Ingredient Economics and Investment Flows
The Russia-Ukraine conflict’s effects on the plant-based energy drink supply chain have been specific and largely underreported. Before 2022, Ukraine had developed meaningful capacity in botanical extraction processing particularly elderflower and chamomile derivatives used in wellness-adjacent energy formulations concentrated in industrial corridors around Kharkiv and Zaporizhzhia.
That capacity is now effectively idled, and Western European brand owners who relied on those facilities for cost-competitive co-packing have had to redirect extraction contracts to processors in Poland and the Czech Republic. The unit economics are structurally higher. The IMF’s April 2025 Regional Economic Outlook for Emerging Europe confirmed sustained industrial output contraction in conflict-proximate Ukrainian oblasts, which means this is not a disruption that will self-correct it is a permanent supply chain redesign problem for any manufacturer that had not already addressed it.
The Houthi maritime campaign targeting commercial vessels in the Bab el-Mandeb strait through 2024–2025 added a separate but compounding layer of cost pressure. The World Bank’s 2025 Global Trade Cost Update documented insurance premium escalation for Red Sea transit routes severe enough to make certain long-standing procurement relationships economically unworkable without renegotiation.
Regional Analysis
North America Held the Largest Share of the Global Plant-Based Energy Drink Market
North America holds the largest regional share 38% due to its mature functional beverage industry, well-established retail infrastructure, and strong consumer demand for plant-based and clean-label products. The region benefits from extensive distribution networks spanning specialty health stores, supermarkets, convenience channels, and e-commerce platforms, allowing brands to scale efficiently across multiple retail formats.
In addition, the presence of major beverage manufacturers, ingredient suppliers, and retail chains supports continuous product innovation and market expansion. The region’s strong culture of fitness, health, and productivity-focused consumption further drives demand for plant-based energy drinks, particularly among younger consumers seeking natural alternatives to conventional energy beverages.
Key Regions and Countries Covered
- North America
- The US
- Canada
- Europe
- Germany
- France
- The UK
- Spain
- Italy
- Russia & CIS
- Rest of Europe
- APAC
- China
- Japan
- South Korea
- India
- ASEAN
- Rest of APAC
- Latin America
- Brazil
- Mexico
- Rest of Latin America
- Middle East & Africa
- GCC
- South Africa
- Rest of MEA
Key Players Analysis
Plant-based energy drink manufacturers focus on strengthening competitive differentiation through proprietary ingredient platforms, resilient sourcing networks, and broad distribution reach across both natural and conventional retail channels. A key priority is securing long-term relationships with certified organic, single-origin, and standardized botanical ingredient suppliers, as these partnerships enhance traceability, support clean-label positioning, and create barriers to entry for emerging competitors.
Companies further invest in formulation consistency and scalable manufacturing capabilities to maintain product integrity while meeting the volume requirements of mass-market distribution. Strategic expansion across premium retail, grocery, convenience, and e-commerce channels enables brands to capture diverse consumer segments while reinforcing shelf presence in a rapidly expanding category.
Additionally, manufacturers emphasize scientific validation, intellectual property protection, and exclusive ingredient agreements to strengthen product credibility and sustain premium pricing. Long-term collaboration with ingredient developers and retail partners further improves supply security, supports innovation pipelines, and enhances customer retention, positioning leading brands to capitalize on growing demand for functional, plant-based energy beverages while maintaining competitiveness in high-value market segments.
The Major Players In The Industry
- Red Bull
- Monster Energy
- PepsiCo (Rockstar Energy)
- Celsius Holdings
- Zevia
- Guayakí Yerba Mate
- Runa Energy
- Clean Cause
- Hiball Energy
- Guru Organic Energy
- MatchaBar
- Yerbae Brands
- Proper Wild
- Tenzing Natural Energy
- EBOOST
- Other Key Players
Key Development
- In January 2025, Safety Shot acquired Yerbaé Brands Corp, a plant-based, zero-calorie energy drink company, to expand its functional beverage platform with naturally caffeinated, plant-derived formulations and nationwide growth potential. Yerbaé’s yerba mate–based and plant-focused SKUs became central to Safety Shot’s strategy in the cleaner energy segment.
- In September 2025, Celsius agreed to buy Rockstar Energy Drink in the US and Canada from PepsiCo while expanding its distribution partnership, making Celsius the strategic leader of PepsiCo’s US energy drink segment and integrating Rockstar alongside Celsius and Alani Nu. PepsiCo retained international Rockstar rights and increased its equity stake in Celsius to about 11%.
Report Scope
| Report Features | Description |
|---|---|
| Market Value (2025) | USD 1,809.4 Mn |
| Forecast Revenue (2035) | USD 3,640.7 Mn |
| CAGR (2026-2035) | 7.3% |
| Base Year for Estimation | 2025 |
| Historic Period | 2020-2024 |
| Forecast Period | 2026-2035 |
| Report Coverage | Revenue Forecast, Market Dynamics, Competitive Landscape, Recent Developments |
| Segments Covered | By Product Type (Natural Caffeine-Based Drinks, Protein Energy Drinks, Adaptogen-Based Energy Drinks, Electrolyte Plant Drinks, and Functional Botanical Drinks), By Ingredient Source (Tea & Coffee Extracts, Guarana, Ginseng, Yerba Mate, and Others), By Packaging Type (Cans, Bottles, and Sachets & Powder Mixes), By Distribution Channel (Supermarkets/Hypermarkets, Convenience Stores, Online Retail, and Specialty Stores), By Consumer Group (Fitness Consumers, Millennials & Gen Z, Working Professionals, and Others), By Application (Sports Nutrition, Daily Energy & Focus, and Wellness & Functional Health) |
| Regional Analysis | North America – The US & Canada; Europe – Germany, France, The UK, Spain, Italy, Russia & CIS, Rest of Europe; APAC– China, Japan, South Korea, India, ASEAN & Rest of APAC; Latin America– Brazil, Mexico & Rest of Latin America; Middle East & Africa– GCC, South Africa, & Rest of MEA |
| Competitive Landscape | Red Bull, Monster Energy, PepsiCo (Rockstar Energy), Celsius Holdings, Zevia, Guayakí Yerba Mate, Runa Energy, Clean Cause, Hiball Energy, Guru Organic Energy, MatchaBar, Yerbae Brands, Proper Wild, Tenzing Natural Energy, EBOOST, and Other Players. |
| Customization Scope | Customization for segments, region/country-level will be provided. Moreover, additional customization can be done based on the requirements. |
| Purchase Options | We have three licenses to opt for: Single User License, Multi-User License (Up to 5 Users), Corporate Use License (Unlimited Users and Printable PDF) |





































