
Quick Navigation
Report Overview
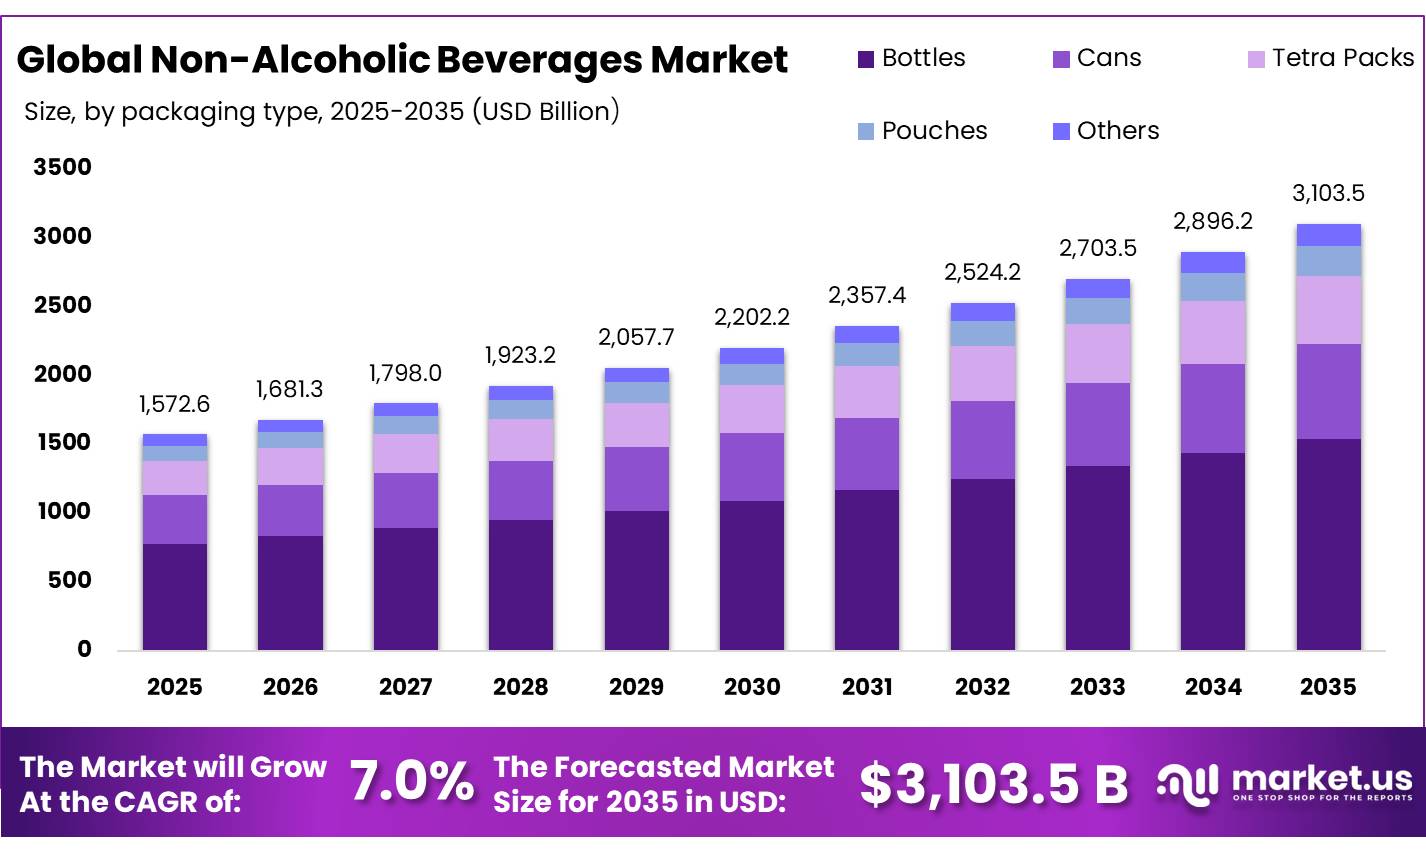
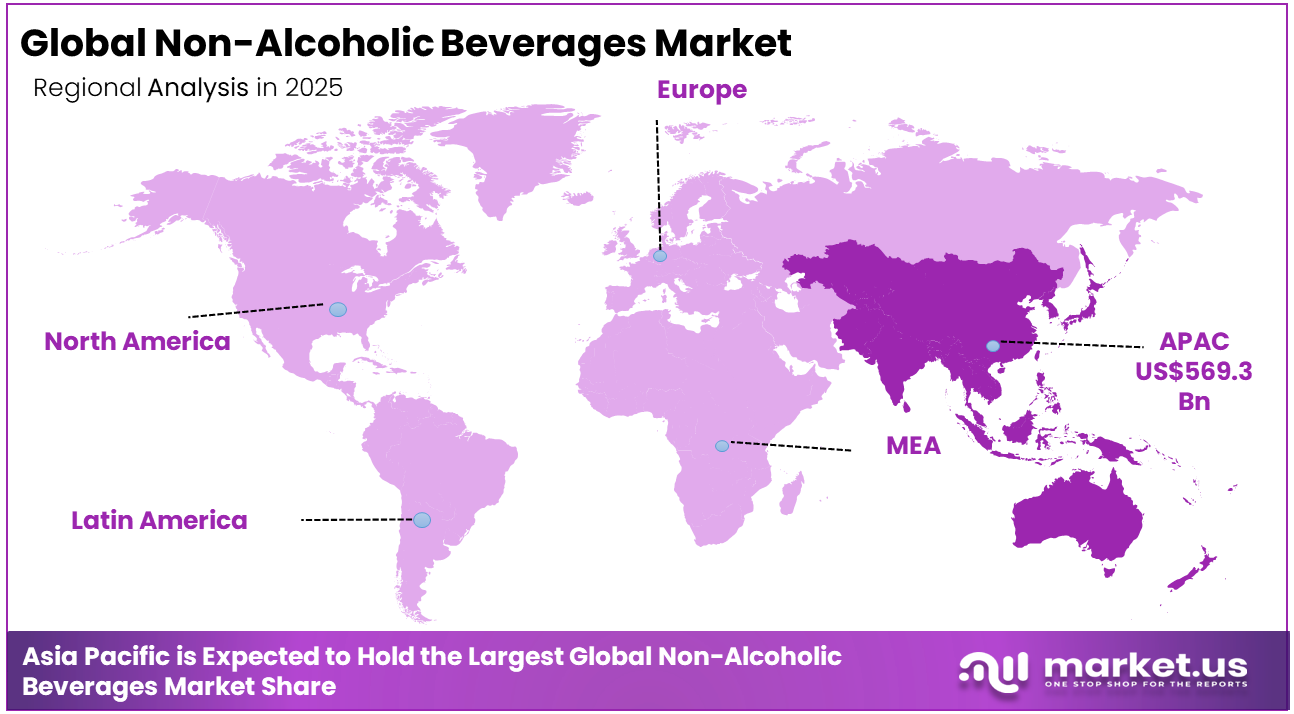
The Global Non-alcoholic Beverages Market size is expected to be worth around USD 3,103.5 Billion by 2035, from USD 1,572.6 Billion in 2025, growing at a CAGR of 7.0% during the forecast period from 2026 to 2035. In 2025, Asia-Pacific held a dominant market position, capturing more than a 36.2% share, holding USD 569.3 Billion revenue.
The global industry of non-alcoholic beverages is an integral part of the international food and agriculture trade complex, which includes carbonated soft drinks, bottled water, fruit juice, ready-to-drink teas and coffee, energy drinks, and functional beverages.
- According to the Food and Agriculture Organization report, the value of global food imports increased by 3.6% in 2024, reaching almost USD 2.1 trillion, while import expenditures on coffee, tea, cocoa, and spices skyrocketed by 29.3%, making up the largest source of growth for all commodities.
Key Takeaways
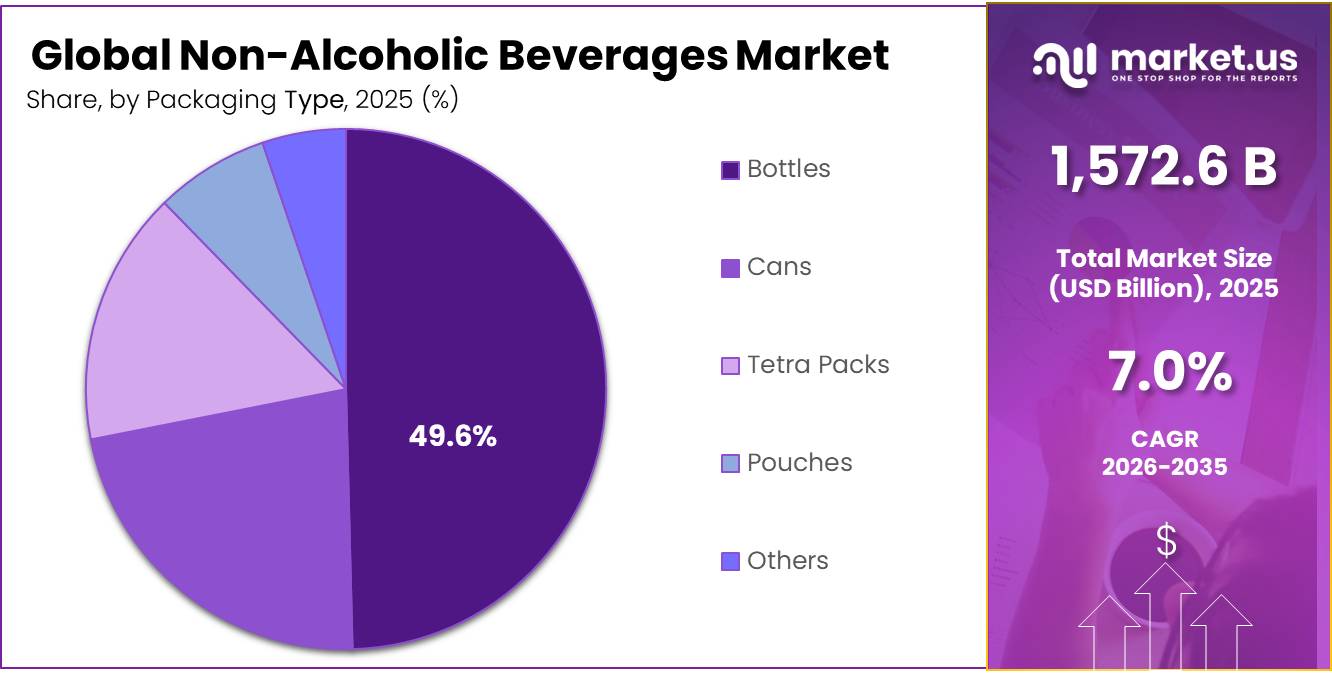
- The global non-alcoholic beverages market was valued at USD 1,572.6 billion in 2025.
- The global market is projected to grow at a CAGR of 7% and is estimated to reach USD 3,103.5 billion by 2035.
- On the basis of type, Carbonated Soft Drinks (CSD) non-alcoholic beverages dominated the market, constituting 29.7% of the total market share.
- Based on the packaging type, bottles dominated the non-alcoholic beverages market, with a substantial market share of around 49.6%.
- Based on the Distribution Channel, Supermarkets/Hypermarkets led the market, comprising 32.6% of the total market.
- Among the end-uses, the Individual / Household Consumers held a major share in the non-alcoholic beverages market, with 68.4% of the market share.
- In 2025, the Asia Pacific was the most dominant region in the non-alcoholic beverages market, accounting for 36.2% of the total global consumption.
Inequality in the production and consumption of non-alcoholic beverages is further accentuated by the consistent disparity in the effectiveness of fiscal policies employed in different countries. According to WHO, fiscal policies targeting taxes on beverages containing sugar have been inadequate, with the median tax rate being less than 2% of the price of a common sugar-sweetened soft drink. In addition, there are other beverages which are extremely high in sugar content but do not attract any taxes at all, such as 100% fruit juices, milk-based beverages, and coffee and tea drinks.
Innovation in terms of materials and policies is moving towards an approach that makes greater use of fiscal tools and consumption incentives that promote health. The WHO has taken up the “3 by 35 campaign,” where it plans to raise the true price of tobacco, alcohol, and beverages containing high levels of sugar by 50% within the next fifteen years, thereby setting a long-term structural path in policy making that would ensure demand redirection from beverages that have a higher level of sugar to those that are healthier in nature.
Non-Alcoholic Beverages Market Segment
Type Analysis
Carbonated Soft Drinks (CSD) represents dominant Segment in the Market.
Carbonated Soft Drinks (CSD) dominates the market with 29.7% of market share. This domination is caused by the deeply embedded consumption habits both in developed and developing markets. According to the WHO, there is a growth in the sale of soft drinks around the world, especially in less affluent countries. Surveys carried out among children and teenagers show that the majority drink one serving or more of such drinks each day in countries ranging from Ghana, Kuwait, and Peru to Samoa. As the WHO Global report on the Use of Sugar-Sweetened Beverage Taxes, 2025 states, sugar-sweetened carbonated drinks represent the most widespread segment of non-alcoholic beverages in the world, being the subject of excise duties in 114 countries more than any other beverage segment.
- According to the Joint Monitoring Programme of the World Health Organization and UNICEF in 2025, 2.1 billion people do not have access to safely managed drinking water up until 2024.
Packaging Type Analysis
Bottles are a significant Packaging type.
Bottles have the highest market penetration rate at 49.6% among the non-alcoholic beverage packages, Bottles dominance in packaging can be attributed to their high versatility and applicability in different product categories such as carbonated beverages, bottled water, juice, and other specialty beverages. However, the magnitude of packaging materials made from bottles has been identified as one of the leading sources of environmental problems, an issue that has dominated global policy discussions in recent years.
As per data from the United Nations Environment Programme (UNEP), over 36% of plastics generated globally were applied in packaging. Among them, around 85% of the single-use food and beverage packaging plastics were disposed of in landfills or were mismanaged. Moreover, the agency estimated that humanity would produce over 500 million tons of plastics in 2024 alone, with beverage bottles being among the largest contributors. This situation has led to the emergence of global plastics treaty negotiations in more than 170 countries.
Distribution Channel Analysis
Supermarkets and Hypermarkets Are the Most Widely Used Distribution Channel.
In 2025, Supermarkets and Hypermarkets held a dominant market position, capturing more than a 32.6% share of the global non-alcoholic beverages distribution landscape. This dominance stems from their ability to stock the entire spectrum of beverage categories from carbonated soft drinks and bottled water to functional and ready-to-drink formats giving consumers immediate, affordable access under one roof.
Online retail, holding an 11.4% share in 2025, represents the fastest-growing distribution channel within the global non-alcoholic beverages market. Accelerating smartphone penetration, expanding last-mile delivery networks, and growing consumer preference for subscription-based bulk beverage purchasing are collectively driving this channel’s upward trajectory.
The FAO confirmed in August 2024 that the expansion of supermarkets and hypermarkets has been a decisive factor in facilitating consumers’ dietary transition toward packaged and processed food and beverage products across developing and emerging economies, with foreign direct investment in food retail playing a central enabling role. Their established cold-chain logistics, wide geographic reach, and deep manufacturer relationships continue to reinforce this channel’s structural leadership across both developed and high-growth emerging markets well into 2025 and beyond.
End User Analysis
Non-alcoholic Beverages Are Mostly Utilized by Individual / Household Consumers.
Consumers at an individual and household level dominate the end users of the global market of non-alcoholic beverages market, with a share of 68.4%, as per their regular water intake requirements, eating and drinking habits, and increasing impact of public health policies on personal choice of beverages. The World Health Organization’s recommendations for a healthy diet include specific provisions regarding the consumption of beverages at an individual level, suggesting that added sugars in beverages purchased at home should be reduced over one’s entire life cycle, encompassing carbonated beverages, fruit juices, and flavored drinks, among others.
- Commercial & Institutional consumers account for 31.6% of the total consumption of beverages, and it can be noted that this group is experiencing structural growth. As per UN Tourism, approximately 1.52 billion people traveled around the world as international tourists in 2025.
Key Market Segments
By Type
- Carbonated Soft Drinks (CSD)
- Bottled Water
- Fruit Beverages
- Ready-to-Drink Coffee & Tea
- Functional Beverages
- Others
By Packaging Type
- Bottles
- Cans
- Tetra Packs
- Pouches
- Others
By Distribution Channel
- Supermarkets/Hypermarkets
- Food Services Sector
- Convenience Stores
- Specialty Stores
- Online Retails
By End User
- Individual / Household Consumers
- Commercial / Institutional
Drivers
Convenience-channel recovery and immediate-consumption pricing
The non-alcoholic beverages market continues to gain value from impulse buying and immediate-consumption occasions, where chilled availability, single-serve formats, and strong retail placement generate higher revenue per liter than bulk take-home packs. This trend is reflected in Coca-Cola Consolidated’s 2025 performance, where net sales reached USD 7.23 billion, increasing 4.8% year over year, while standard physical case volume grew only 0.3%, showing that pricing and product mix contributed more to growth than volume expansion.
The company reported that higher average bottle and can pricing added nearly USD 215 million to sales performance. In addition, fourth-quarter 2025 sparkling beverage volume increased 3.5%, highlighting continued strength in convenience-led consumption and effective cooler and retail execution strategies.
Drivers Impact Analysis
| Driver | (~) % Impact on CAGR | Geographic Relevance | Impact Timeline |
|---|---|---|---|
| Zero-sugar reformulation and low-calorie mix upgrade | 1.60% | North America core, EU, GCC, urban APAC | Short term (≤ 2 years) |
| Functional hydration and bottled-water premiumization | 1.30% | APAC, North America, Western Europe, Middle East | Medium term (2-4 years) |
| Health-label and sugar-tax regulation accelerating portfolio shift | 1.10% | EU, U.S., GCC, Latin America selective | Short term (≤ 2 years) |
| Convenience-channel recovery and immediate-consumption pricing | 0.90% | North America, Europe, metro APAC, travel retail hubs | Medium term (2-4 years) |
| Climate heatwaves and year-round hydration occasions | 0.80% | South Asia, Southern Europe, Middle East, U.S. Sun Belt | Short term (≤ 2 years) |
| Packaging circularity and recyclable-content redesign | 0.70% | EU core, U.K., North America spill-over, developed APAC | Long term (≥ 4 years) |
Restraints
Freight and Red Sea disruption
Shipping instability remains a key challenge for the non-alcoholic beverages market because production depends on internationally sourced materials such as concentrates, aluminum, resin, sweeteners, flavors, caps, and packaging inputs despite local bottling operations. During the Red Sea disruption, cargo movement through the Suez Canal dropped by nearly 50% in the first two months of 2024, while OECD-ITF reported global freight rates increased by around 130% between November 2023 and March 2024.
In addition, JPMorgan observed that some Asia–Europe shipping routes rose almost five times during peak disruption periods. Although rates eased in 2026, Far East to Mediterranean long-term shipping prices remained at USD 2,308 per FEU in January 2026, continuing to pressure beverage margins, inventory planning, and supply chain efficiency.
Restraint Impact Analysis
| Restraint | (~) % Impact on CAGR | Geographic Relevance | Impact Timeline |
|---|---|---|---|
| Sugar and sweetener inflation | -1.50% | North America core, LATAM, import-dependent APAC | Short term (≤ 2 years) |
| Sugar-tax and labeling pressure | -1.30% | EU, U.S., GCC, Latin America selective | Medium term (2-4 years) |
| Freight and Red Sea disruption | -1.10% | Europe, Middle East, Africa, Asia-Europe corridors | Short term (≤ 2 years) |
| Packaging compliance cost | -0.90% | EU core, U.K., developed APAC, North America spill-over | Long term (≥ 4 years) |
| Consumer downtrading risk | -0.80% | Emerging APAC, Africa, LATAM, lower-income EU pockets | Short term (≤ 2 years) |
| FX and imported-input exposure | -0.70% | Africa, South Asia, Middle East, frontier markets | Medium term (2-4 years) |
Opportunity
Powdered hydration scale-up
Functional hydration represents a future growth opportunity for the non-alcoholic beverages market as companies shift from heavy liquid distribution toward asset-light formats such as powders, stick packs, and effervescent tablets. The strategy gained validation through Nestlé Health Science’s acquisition of Nuun, whose hydration products contain only around 1 gram of sugar, supporting sugar-reduction trends and reducing dependence on refrigerated logistics.
Compared with ready-to-drink beverages, powdered hydration formats can reduce freight weight by more than 90% and lower packaging material use by approximately 70%–85% per serving. These efficiencies can improve gross margins by an estimated 400–800 basis points, while creating growth opportunities across pharmacy, sports, workplace wellness, travel retail, and e-commerce channels, especially in heat-intensive emerging markets.
Opportunity Impact Analysis
| Opportunity | (~) % Potential CAGR | Geographic Relevance | Execution Window |
|---|---|---|---|
| Powdered hydration scale-up | 1.80% | North America, India, GCC, Southeast Asia | Short term (≤ 2 years) |
| Adult-social zero sugar adjacencies | 1.50% | Europe, Mexico, North America core, urban APAC | Medium term (2-4 years) |
| Ambient aseptic mass-premium rollout | 1.40% | Africa, India, Southeast Asia, LATAM | Medium term (2-4 years) |
| Functional M&A roll-up platform | 1.20% | North America core, Western Europe, developed APAC | Short term (≤ 2 years) |
| D2C subscription and personalization | 1.00% | U.S., U.K., EU, Japan, South Korea | Medium term (2-4 years) |
| Urban micro-channel pack innovation | 0.90% | India, Nigeria, Indonesia, Middle East metros | Long term (≥ 4 years) |
Challenge
Adult-social zero sugar adjacencies
This represents a future opportunity rather than a core growth driver for the non-alcoholic beverages market, as brands expand into adjacent social and premium refreshment occasions beyond traditional consumption patterns. The Coca-Cola and Bacardi RTD collaboration, launched in selected European markets and Mexico in 2025 and expanded with a spiced variant in 2026, demonstrated how established soft-drink brands can extend into adult social occasions through partnerships rather than building new alcohol capabilities.
This creates opportunities for premium non-alcoholic offerings such as zero-sugar mocktail mixers, adult sodas, and bar-style beverage bases. These formats can command prices around 1.5–2.2 times higher per liter than mainstream carbonated soft drinks while utilizing existing filling infrastructure and improving profit per can.
Challenges Impact Analysis
| Challenge | (~) % Potential CAGR | Geographic Relevance | Mitigation Horizon |
| Ingredient volatility management | -1.20% | North America core, Latin America, global sourcing corridors | Medium term (2-4 years) |
| Water stress adaptation | -1.00% | India, Mexico, U.S. Southwest, MENA, South Africa | Long term (≥ 4 years) |
| Packaging specification complexity | -0.90% | EU regulatory hubs, North America, developed APAC | Medium term (2-4 years) |
| Frontline labor instability | -0.80% | North America core, Western Europe, Gulf manufacturing hubs | Medium term (2-4 years) |
| Cold-chain energy exposure | -0.70% | North America, Europe, Middle East, tropical APAC | Medium term (2-4 years) |
| Continuous reformulation cycles | -0.60% | U.S., EU, GCC, selective LATAM | Long term (≥ 4 years) |
Geopolitical Impact Analysis
Geopolitical Realignment and Supply Chain Fragmentation Reshape Non-alcoholic Beverages Manufacturing.
Geopolitical tensions and their consequences for a fragmentation of international trade systems are generating substantial structural pressure on the non-alcoholic beverages manufacturing supply chain, interfering with the provision of necessary raw materials, which include such ingredients as coffee, tea, cocoa, and packaging materials. According to the Food and Agriculture Organization, geopolitical risks have resulted in increased market uncertainty, price volatility, disruption of trading routes, imposition of retaliatory tariffs, and economic sanctions. Moreover, all those factors contributed to the reconfiguration of supply chains at a cost.
Financial implications for supply chains can be quantified and are increasing steadily. As stated in the Food Outlook report issued by FAO, the total cost of food imports grew by 3.6% in 2024 up to USD 2.1 trillion due to a rise in import costs of coffee, tea, cocoa, and spices by 29.3%, and the organization explicitly noted that in 2025 trade tensions and policy uncertainty would affect food import bill through volume and price changes.
Regional Analysis
Asia Pacific Held the Largest Share of the Global Non-alcoholic Beverages Market.
In 2025, the Asia Pacific dominated the global non-alcoholic beverages market, holding about 36.2% of the total global consumption due to having the world’s largest consumer base and one of the fastest-growing urban regions. As per the findings published by the United Nations Department of Economic and Social Affairs ‘World Urbanization Prospects 2025, more than half of the 33 megacities worldwide (i.e., 19) lie in Asia with cities like Jakarta, Dhaka, and Tokyo having the highest number of inhabitants.
Middle East and Africa expected to be one of the fastest-growing regions. According to the forecasts by the Organization for Economic Cooperation and Development (OECD)-FAO Agricultural Outlook 2024–2033, Sub-Saharan Africa will provide up to 18% of the additional food consumption worldwide by 2033.
Key Regions and Countries Covered
- North America
- The US
- Canada
- Europe
- Germany
- France
- The UK
- Spain
- Italy
- Russia & CIS
- Rest of Europe
- APAC
- China
- Japan
- South Korea
- India
- ASEAN
- Rest of APAC
- Latin America
- Brazil
- Mexico
- Rest of Latin America
- Middle East & Africa
- GCC
- South Africa
- Rest of MEA
Key Players Analysis
Manufacturers of non-alcoholic beverages emphasize increasing their differentiation, portfolio diversification, and supply chain resilience in order to remain competitive in the rapidly evolving global market, where consumer preferences and government policies favor healthier alternatives. Product innovation emerges as one of the main priorities for companies that strive to develop new types of beverages that are functional, fortified, low in sugar, or made from plant-based ingredients.
Given that 115 WHO Member States introduced national sugar-sweetened beverage taxes by February 2024, while 41 other Member States began imposing similar taxes for unhealthy foods and beverages, companies are actively involved in reformulating products and introducing healthier alternatives into their product lineups in order to sustain market access.
Nutrition labeling becomes another competitive advantage for non-alcoholic beverages makers. According to the State of Agricultural Commodity Markets 2024 prepared by the FAO, nutrition labeling is one of the reasons why the WTO TBT Committee addressed 52 out of 77 trade issues that have emerged between countries. As import costs for coffee, tea, cocoa, and spices increased by 29.3% in 2024, vertical integration with suppliers of agricultural raw materials becomes crucial for manufacturers, particularly those active in Asia Pacific and Latin America.
The Major Players in The Industry
- The Kraft Heinz Company
- Appalachian Brewing Co
- Nestle S.A.
- PepsiCo, Inc.
- Reed’s, Inc.
- The Coca-Cola Company
- Arca Continental SAB de CV
- ITO EN Ltd.
- Monster Beverage Corp.
- Other Key Players
Key Development
- In February 2025, Coca-Cola Company introduced the market to their new Simply Pop beverage, their first-ever prebiotic soft drink containing real fruit juice, six grams of prebiotic fiber, and zero sugar content, thus entering the rapidly growing category of functional beverages available through selected markets of the US and Amazon Fresh.
- In March 2025, PepsiCo, Inc. signed an agreement to acquire the prebiotic soda company, Poppi, in an all-cash deal worth USD 1.95 billion, thus transforming their portfolio into that of functional and healthy beverages.
Report Scope
| Report Features | Description |
|---|---|
| Market Value (2025) | USD 1,572.6 Bn |
| Forecast Revenue (2035) | USD 3,103.5 Bn |
| CAGR (2026-2035) | 7% |
| Base Year for Estimation | 2025 |
| Historic Period | 2020-2024 |
| Forecast Period | 2026-2035 |
| Report Coverage | Revenue Forecast, Market Dynamics, Competitive Landscape, Recent Developments |
| Segments Covered | By Type (Carbonated Soft Drinks (CSD), Bottled Water, Fruit Beverages , Ready-to-Drink Coffee And Tea, Functional Beverages , Others), By Packaging Type (Bottles, Cans, Tetra Packs, Pouches, Others), By Distribution Channel (Supermarkets/Hypermarkets, Food Services Sector, Convenience Stores, Specialty Stores, Online Retails), By End User (Individual / Household Consumers, Commercial / Institutional) |
| Regional Analysis | North America – The US & Canada; Europe – Germany, France, The UK, Spain, Italy, Russia & CIS, Rest of Europe; APAC– China, Japan, South Korea, India, ASEAN & Rest of APAC; Latin America– Brazil, Mexico & Rest of Latin America; Middle East & Africa– GCC, South Africa, & Rest of MEA |
| Competitive Landscape | The Kraft Heinz Company, Appalachian Brewing Co, Nestle S.A., PepsiCo, Inc., Reed’s, Inc., The Coca-Cola Company, Arca Continental SAB de CV, ITO EN Ltd., Monster Beverage Corp., Other Key Players. |
| Customization Scope | Customization for segments, region/country-level will be provided. Moreover, additional customization can be done based on the requirements. |
| Purchase Options | We have three licenses to opt for: Single User License, Multi-User License (Up to 5 Users), Corporate Use License (Unlimited Users and Printable PDF) |


