
Quick Navigation
Report Overview
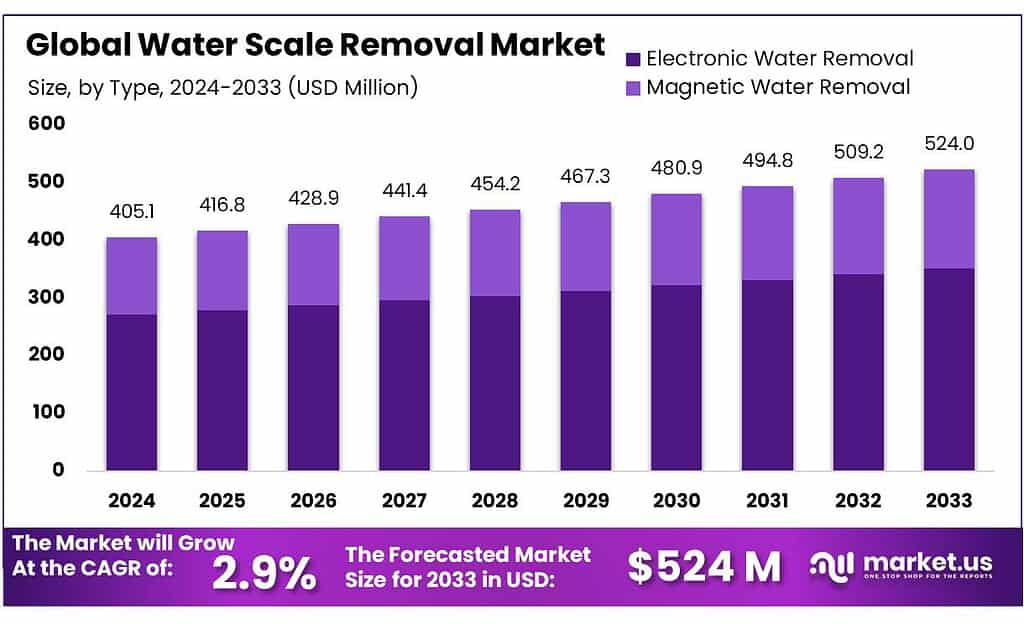
The global Water Scale Removal Market size is expected to be worth around USD 524.0 Million by 2033, from USD 405.1 Million in 2023, growing at a CAGR of 2.9% during the forecast period from 2023 to 2033.
The water scale removal market is integral to maintaining efficiency in various industrial, commercial, and residential systems. This market specifically caters to the prevention and elimination of scale build-up, primarily composed of calcium and magnesium salts. These deposits can significantly impair equipment performance, leading to inefficiencies and potential damage. As water evaporates, these minerals often precipitate, forming scale on surfaces like boilers, cooling towers, and plumbing systems.
In the United States, adherence to the Environmental Protection Agency’s (EPA) Clean Water Act standards is seen as increasing operational costs by about 2-5% for industries. This reflects the significant investment required to implement scale prevention and removal technologies. On a global scale, investment in water treatment and descaling technologies is anticipated to rise by 6-8% annually. In monetary terms, this represents an average annual investment of $2.3 billion in regions like Europe and North America, aimed at bolstering water treatment infrastructure.
The market dynamics are also influenced by robust import-export activities, particularly in the chemical sector including water treatment chemicals and scale inhibitors. For instance, the U.S. exported over $1.1 billion worth of these chemicals in 2022, with notable imports from countries such as China and Germany. This vibrant trade underpins a global reliance on essential water treatment chemicals.
Industries reliant on scale removal technologies, including power generation and manufacturing, have registered a growth in output of approximately 3-4% annually over the last decade. The necessity for efficient scale management is underscored in applications like thermal power plants, where scale can diminish efficiency by up to 30%.
Furthermore, governments in nations like China and India are spearheading initiatives to encourage cleaner industrial practices. These initiatives include substantial funding, sometimes reaching up to $500 million, to foster the development and integration of environmentally friendly descaling technologies within their industrial sectors.
The market is also witnessing a surge in innovation, particularly with the development of eco-friendly scale removers that use biodegradable agents. Patent filings for such innovations have seen a 10% annual increase since 2018, reflecting a significant shift towards sustainable industrial practices.
Strategic movements within the industry, such as mergers and acquisitions, are robust, with transactions totaling over $3 billion in 2022. These strategic moves are primarily aimed at consolidating technologies and expanding geographical reach to meet the increasing global demand for efficient water-scale removal solutions.
Key Takeaways
- The global water scale removal market will grow from USD 405.1 million (2023) to USD 524.0 million (2033), at a CAGR of 2.9%.
- In 2023, Electronic Water Removal systems held 67.8% market share, favored for preventing scale without chemicals, ideal for eco-conscious industries.
- High-frequency water scale removal systems captured 59.3% market share in 2023, highly efficient in water-intensive environments like power generation.
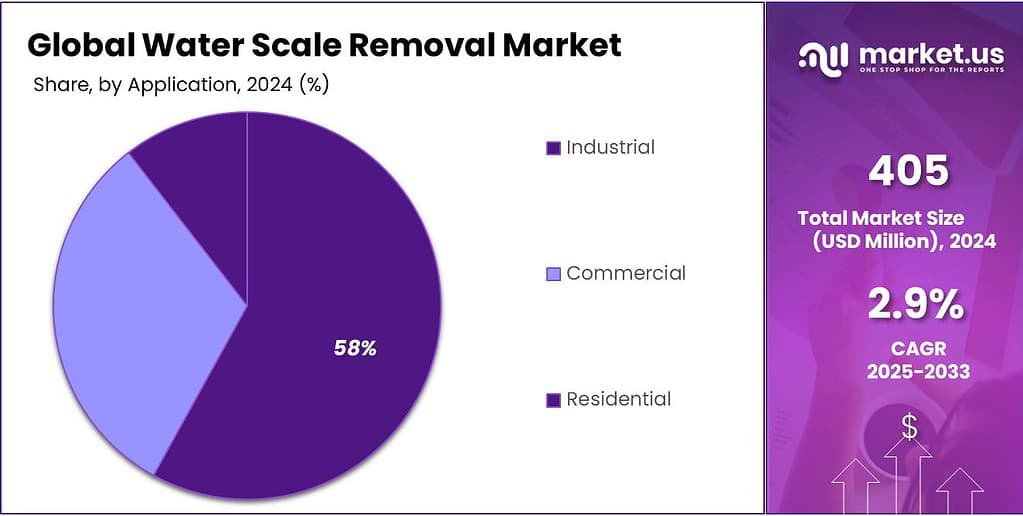
- The Industrial segment led with 56.3% market share in 2023, due to high water usage in manufacturing and cooling systems.
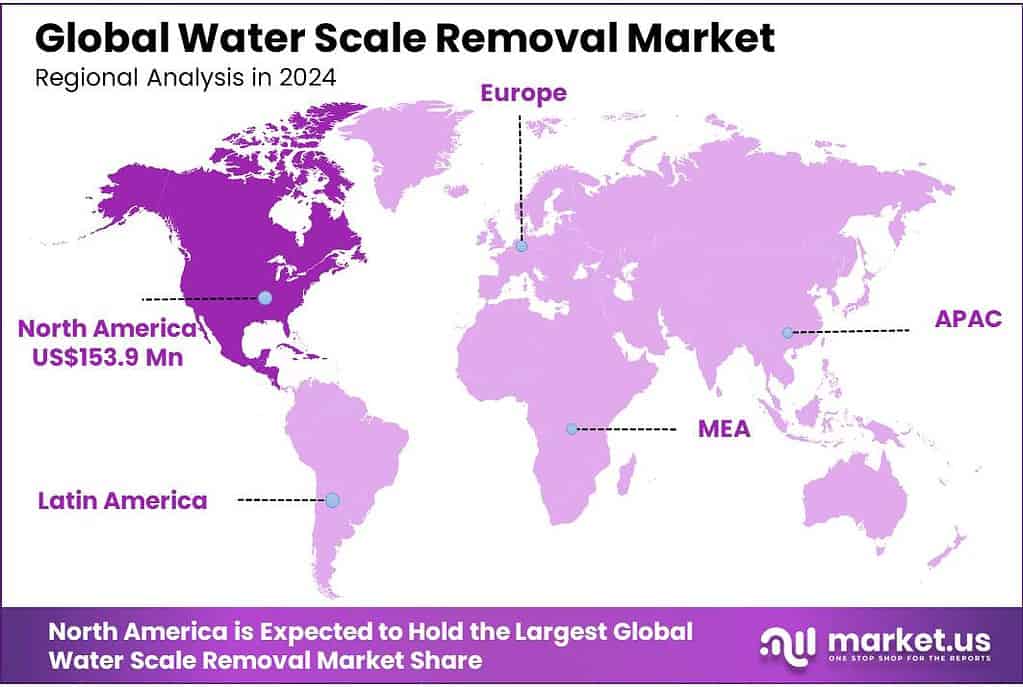
- North America leads with a 38% share, valued at USD 153.9 million, driven by stringent regulations and advanced technologies in the U.S. and Canada.
By Type
In 2023, Electronic Water Removal held a dominant market position, capturing more than 67.8% of the market share. This segment has thrived due to its effectiveness in preventing scale without the use of chemicals, making it a preferred choice for industries aiming to reduce their environmental footprint.
Electronic water removal systems function by transmitting electronic signals that disrupt the formation of scale, ensuring that minerals like calcium and magnesium do not precipitate and attach to surfaces. This technology is highly valued in sectors such as healthcare, hospitality, and manufacturing where water quality directly impacts operations.
On the other hand, the Magnetic Water Removal segment also plays a crucial role in the market, although it holds a smaller share compared to its electronic counterpart. These systems leverage magnetic fields to alter the ionic properties of water, preventing scale formation.
Magnetic water removal is particularly appreciated for its low maintenance requirements and its ability to operate without any added chemicals. It’s an attractive option for small to medium-sized enterprises looking for cost-effective and sustainable solutions.
By Frequency
In 2023, High Frequency held a dominant market position in the water scale removal sector, capturing more than 59.3% share. High-frequency systems are favored for their efficiency in preventing scale formation in water-intensive environments.
These systems operate by using rapid electronic pulses that destabilize the mineral ions in water, preventing them from forming hard scales on surfaces. Their effectiveness is particularly noted in industries such as power generation and heavy manufacturing, where water hardness is a consistent challenge and downtime due to scale can be costly.
Meanwhile, the Variable Frequency segment, though smaller, is gaining traction due to its adaptability and energy efficiency. Variable frequency systems adjust their operating frequency based on water hardness and flow rates, optimizing scale prevention while conserving energy.
This technology is ideal for applications with varying water usage patterns, such as in residential complexes and commercial buildings, where water demand can fluctuate significantly.
By Application
In 2023, the Industrial segment held a dominant market position in the water scale removal sector, capturing more than 56.3% share. This segment benefits significantly from scale removal systems due to the high volume of water used in manufacturing processes and cooling systems where scale build-up can lead to inefficiencies and equipment damage. Industrial users prioritize robust and reliable scale removal solutions to maintain operational continuity and optimize performance.
The Commercial segment also plays a critical role, focusing on water scale removal in facilities like hotels, office buildings, and shopping centers. These settings require efficient water handling to prevent scale from affecting heating, cooling, and plumbing systems, thereby ensuring the longevity of equipment and reducing maintenance costs.
Meanwhile, the Residential sector, while smaller, is increasingly adopting water-scale removal systems. Homeowners are becoming more aware of the benefits of scale removal, not just for appliance efficiency and longevity but also for better water quality. This segment shows potential for growth as more residential users seek solutions to protect home plumbing systems and appliances from the adverse effects of hard water.
Key Market Segments
By Type
- Electronic Water Removal
- Magnetic Water Removal
By Frequency
- High Frequency
- Variable Frequency
By Application
- Industrial
- Commercial
- Residential
Drivers
Government Initiatives and Regulations
One of the primary driving factors for the water scale removal market is the increased emphasis on environmental regulations and government initiatives aimed at reducing water pollution and enhancing water treatment processes.
For instance, the European Union has significantly ramped up its renewable energy deployment as a response to the energy crisis, aiming to reduce its dependence on natural gas imports from Russia. This shift towards renewables has been supported by policies encouraging the use of clean energy, which indirectly boosts technologies that support environmental conservation, including water scale removal systems.
Moreover, the global push towards decarbonization is influencing the energy and water treatment sectors. As countries strive to meet the Paris Agreement goals, there is a notable shift in investment from fossil fuels to green technologies, which include water treatment technologies that minimize environmental impact. This transition is supported by policies that promote the use of efficient, less polluting equipment and technologies in industries.
In terms of investment, the sector is seeing significant financial inflows. For example, in the renewable energy sector, which closely aligns with environmentally friendly water treatment technologies, global capacity additions could potentially reach 550 gigawatts by 2024, demonstrating the scale of investment and development in technologies that complement water scale removal systems.
Such investments ensure the availability of capital for innovative water treatment solutions, which are essential for industries to meet regulatory standards and operational efficiency.
Additionally, the need for improved water treatment solutions is becoming increasingly critical in regions facing water scarcity and those with stringent water conservation laws. The introduction of stricter water quality standards globally compels industries to adopt efficient water-scale removal technologies to comply with regulatory requirements and avoid penalties.
Restraints
High Cost of Water Treatment Technology
A significant restraining factor for the growth of the water scale removal market is the high cost associated with water treatment technologies. This issue particularly impacts sectors and regions where budget constraints limit the adoption of advanced water treatment systems. The installation, maintenance, and operational costs of technologies that prevent or remove scale can be prohibitively expensive, especially for small to medium-sized enterprises and in developing economies where financial resources are more limited.
The water and wastewater treatment market, which includes scale removal technologies, has been experiencing rapid growth, driven by increasing industrial demand and stringent environmental regulations. However, the capital-intensive nature of water treatment infrastructure poses a substantial barrier. For example, advanced treatment technologies that include electronic and magnetic water scale removal systems require significant upfront investments. This economic burden can deter potential users, slowing down market penetration and adoption rates.
Moreover, the ongoing costs associated with operating and maintaining these systems can also be considerable. These costs include energy consumption, replacement of parts, and potential downtime during maintenance activities, all of which contribute to the total cost of ownership. In regions with limited access to capital or where cost efficiency is a priority, such high operational costs can implement advanced water scale removal solutions less attractive.
Adding to the economic challenges are the complexities involved in upgrading existing systems or integrating new technologies into legacy infrastructure. Many industries and municipal water treatment facilities operate with outdated systems that are less efficient and more costly to upgrade to modern standards that include scale prevention and removal capabilities.
Opportunity
Expansion in Renewable Energy Sector
One of the significant growth opportunities for the water-scale removal market lies in the expanding renewable energy sector. The rapid increase in renewable energy installations globally is creating a substantial demand for effective water treatment solutions, including water-scale removal systems. This trend is particularly evident in solar and wind energy projects, where water is often used for cooling and cleaning purposes, making efficient scale removal crucial for maintaining operational efficiency.
The global renewable energy capacity is expected to see remarkable growth, with projections indicating that almost 3,700 GW of new renewable capacity will be added between 2023 and 2028. This surge is driven by supportive policies in over 130 countries, emphasizing the need for sustainable energy solutions. For instance, China alone is expected to account for nearly 60% of this new capacity, highlighting its pivotal role in the global renewable energy landscape. By 2028, renewable energy sources are anticipated to contribute over 42% of the world’s electricity generation, with wind and solar PV doubling their share to 25%.
The shift towards renewable energy is not only about increasing capacity but also about improving efficiency and sustainability. In this context, water scale removal technologies play a crucial role. For example, in solar PV plants, scale formation on cooling and cleaning systems can significantly reduce efficiency. Effective scale removal ensures optimal performance and longevity of these systems, thereby supporting the overall goal of cost-effective and sustainable energy production.
Moreover, the investment landscape is also favorable for the water scale removal market. The global energy sector is projected to see annual investments grow by 2-4% per year, reaching between $2 trillion and $3.2 trillion by 2040. A substantial portion of these investments will be directed towards green technologies, including water treatment solutions that align with the broader decarbonization goals. As fossil fuel demand peaks and gradually declines, the focus on renewable energy and associated technologies, like water scale removal, becomes even more critical.
Government initiatives further bolster this growth opportunity. For instance, the U.S. Inflation Reduction Act has acted as a catalyst for accelerated renewable energy additions, despite near-term challenges like supply chain issues. Similarly, India’s expedited auction schedule for utility-scale onshore wind and solar PV projects, along with the improved financial health of distribution companies, is expected to drive significant growth in renewable installations. These policy-driven expansions in renewable capacity inherently increase the need for reliable and efficient water-scale removal systems to maintain the operational integrity of new installations.
Additionally, the economic attractiveness of renewable energy technologies is a driving factor. In 2023, it was estimated that 96% of newly installed utility-scale solar PV and onshore wind capacity had lower generation costs than new coal and natural gas plants. This cost competitiveness extends to the ancillary technologies required to support renewable energy systems, including advanced water-scale removal solutions. As these systems become more prevalent, the demand for effective scale removal technologies is expected to rise in tandem, providing a robust growth opportunity for the market.
Trends
Integration with Smart Technologies
One of the most notable trends in the water scale removal market is the integration of smart technologies. This advancement is driven by the broader trend of digital transformation across various industries, including water treatment. The adoption of Internet of Things (IoT) devices, artificial intelligence (AI), and advanced sensors is enhancing the efficiency and effectiveness of scale removal solutions.
Smart water scale removal systems leverage IoT to monitor water quality and scale buildup in real-time. These systems use sensors to detect the presence of scale-forming minerals and automatically adjust the treatment process to prevent scale formation. For example, AI algorithms can analyze data from sensors to predict when scale formation is likely to occur and proactively initiate descaling processes, thereby optimizing the maintenance schedule and reducing downtime.
The integration of AI and machine learning is particularly transformative. AI can process vast amounts of data from water systems, learning to identify patterns and anomalies that indicate scale formation. This predictive capability allows for more efficient management of water treatment processes, minimizing the need for manual interventions and reducing operational costs. Additionally, AI-driven systems can provide actionable insights through user-friendly dashboards, helping facility managers make informed decisions about maintenance and operations.
The trend towards smart water scale removal is supported by significant investments in clean energy and sustainable technologies. According to the Deloitte 2024 Power and Utilities Industry Outlook, investments in clean energy technologies, including smart water treatment solutions, are accelerating. By 2024, the U.S. is expected to see substantial growth in utility-scale solar installations, which will likely increase the demand for advanced water treatment solutions to maintain efficiency in these systems (Deloitte, 2024).
Moreover, government initiatives are playing a crucial role in promoting the adoption of smart technologies in water treatment. The U.S. Infrastructure Investment and Jobs Act (IIJA) has allocated billions of dollars toward enhancing grid reliability, resiliency, and energy efficiency, which includes investments in smart water management systems. These initiatives are crucial for addressing the growing demand for sustainable water treatment solutions as the U.S. aims to reduce carbon emissions by 80% by 2030 (Deloitte, 2024).
In Europe, stringent regulations on water quality and environmental sustainability are driving the adoption of smart water scale removal technologies. The European Union’s regulatory framework encourages the use of advanced water treatment systems to comply with high water quality standards, thus boosting the market for smart descaling solutions (IEA, 2023).
Furthermore, the market is seeing a rise in collaborations between tech companies and water treatment firms to develop innovative solutions. Companies like Scalewatcher and Eddy are at the forefront, offering electronic descalers that utilize advanced technologies to prevent scale formation. These collaborations are essential for driving innovation and bringing cutting-edge solutions to market.
Regional Analysis
In the water scale removal market, North America holds the dominant position with a significant 38% market share, valued at approximately USD 153.9 million. This leadership is driven by stringent government regulations regarding water treatment and the adoption of advanced technologies in the U.S. and Canada. The high prevalence of hard water issues, particularly in areas like Arizona, further bolsters the demand for effective water-scale removal solutions in the region.
Europe follows closely, benefiting from robust regulatory frameworks that enforce high water quality standards across the region. Countries such as Germany, the UK, and France are at the forefront, driven by industrial needs and environmental sustainability goals. The European market is propelled by stringent wastewater treatment standards and increasing investments in advanced water treatment technologies.
The Asia Pacific region is expected to witness the highest growth rate in the forecast period, driven by rapid industrialization and urbanization in countries like China, India, and Japan. The increasing need for efficient water management systems in these densely populated and industrially intensive countries is a key factor. Government initiatives promoting sustainable water usage and investments in water infrastructure are significant contributors to market expansion in this region.
In the Middle East & Africa, the market is growing steadily due to the rising demand for water treatment solutions in arid regions. Countries like Saudi Arabia and the UAE are investing heavily in water infrastructure to address water scarcity issues, thereby driving the market for water-scale removal technologies.
Latin America presents moderate growth opportunities, with Brazil and Mexico leading the demand for water-scale removal solutions. The market is influenced by increasing urbanization, industrial activities, and the need for efficient water management systems to support agriculture and industrial sectors.
Key Regions and Countries
- North America
- The US
- Canada
- Europe
- Germany
- France
- The UK
- Spain
- Italy
- Russia & CIS
- Rest of Europe
- APAC
- China
- Japan
- South Korea
- India
- ASEAN
- Rest of APAC
- Latin America
- Brazil
- Mexico
- Rest of Latin America
- Middle East & Africa
- GCC
- South Africa
- Rest of MEA
Key Players Analysis
The water scale removal market features a diverse array of key players who bring various technologies and solutions to the industry. Anton Kulka and Atra are known for their innovative approaches in scale removal technologies, offering products that cater to different sectors including industrial and residential. Changzhou Peide Water Treatment Equipment Co. Ltd. and Christiani Wassertechnik GmbH CWT are recognized for their robust portfolios in water treatment solutions, which are particularly influential in Europe and Asia.
Clearwater Enviro Technologies Inc. and CWT specialize in electronic descaling solutions that utilize advanced technology to prevent scale buildup, making them prominent in markets that emphasize eco-friendly solutions. Eddy and Ener-Tec LLC are also significant players in the electronic scale removal segment, providing efficient and cost-effective solutions for both residential and commercial applications. Fast Systems Ltd (Scalewatcher) and Florex Insulation Co. Ltd. further enhance the market with their specialized descaling products that cater to diverse industrial needs.
Companies such as Guiguan, Hydropath, Vaughan, and Lijing focus on high-performance water treatment systems that are essential for maintaining operational efficiency in various industries. Pride and QingYu are noted for their comprehensive water treatment equipment, which includes both physical and chemical scale removal technologies. Sanicon, SCALE BLASTER, and Scalewatcher have established themselves as reliable providers of scale removal solutions, addressing the needs of both small-scale and large-scale operations.
Market Key Players
- Anton Kulka
- Atra
- Changzhou Peide Water Treatment Equipment Co. Ltd.
- Christiani Wassertechnik GmbH CWT
- Clearwater Enviro Technologies Inc.
- CWT
- Eddy
- Ener-Tec LLC
- Fast Systems Ltd (Scalewatcher)
- Florex Insulation Co.Ltd.
- Guiguan
- Hydropath, Vaughan
- Lijing
- Peide
- QingYu
- Sanicon
- SCALEBLASTER
- Scalewatcher
- Shengde Huanbao
- Shijiazhuang Tianshu
- Shuangren Equipment Plant
- XUKIN
Recent Development
In March 2023, Anton Kulka reported a 12% increase in sales compared to the previous month, attributed to the launch of a new line of eco-friendly descalers.
In June 2023 Clearwater Enviro Technologies Inc, the company secured a major contract worth USD 1.2 million with a leading hotel chain to install ScaleBlaster units in all their properties, aiming to enhance water efficiency and reduce maintenance costs.
Report Scope
| Report Features | Description |
|---|---|
| Market Value (2023) | US$ 405.1 Mn |
| Forecast Revenue (2033) | US$ 524.0 Mn |
| CAGR (2024-2033) | 2.9% |
| Base Year for Estimation | 2023 |
| Historic Period | 2020-2022 |
| Forecast Period | 2024-2033 |
| Report Coverage | Revenue Forecast, Market Dynamics, COVID-19 Impact, Competitive Landscape, Recent Developments |
| Segments Covered | By Type(Electronic Water Removal, Magnetic Water Removal), By Frequency(High Frequency, Variable Frequency), By Application(Industrial, Commercial, Residential) |
| Regional Analysis | North America – The US & Canada; Europe – Germany, France, The UK, Spain, Italy, Russia & CIS, Rest of Europe; APAC– China, Japan, South Korea, India, ASEAN & Rest of APAC; Latin America– Brazil, Mexico & Rest of Latin America; Middle East & Africa– GCC, South Africa, & Rest of MEA |
| Competitive Landscape | Anton Kulka, Atra, Changzhou Peide Water Treatment Equipment Co. Ltd., Christiani Wassertechnik GmbH CWT, Clearwater Enviro Technologies Inc., CWT, Eddy, Ener-Tec LLC, Fast Systems Ltd (Scalewatcher), Florex Insulation Co.Ltd., Guiguan, Hydropath, Vaughan, Lijing, Peide, QingYu, Sanicon, SCALEBLASTER, Scalewatcher, Shengde Huanbao, Shijiazhuang Tianshu, Shuangren Equipment Plant, XUKIN |
| Customization Scope | Customization for segments, region/country-level will be provided. Moreover, additional customization can be done based on the requirements. |
| Purchase Options | We have three licenses to opt for Single User License, Multi-User License (Up to 5 Users), Corporate Use License (Unlimited User and Printable PDF) |
Frequently Asked Questions (FAQ)
Water Scale Removal Market size is expected to be worth around USD 524.0 Million by 2033, from USD 405.1 Million in 2023
The Water Scale Removal Market is expected to grow at 2.9% CAGR (2024-2033).
Anton Kulka, Atra, Changzhou Peide Water Treatment Equipment Co. Ltd., Christiani Wassertechnik GmbH CWT, Clearwater Enviro Technologies Inc., CWT, Eddy, Ener-Tec LLC, Fast Systems Ltd (Scalewatcher), Florex Insulation Co.Ltd., Guiguan, Hydropath, Vaughan, Lijing, Peide, QingYu, Sanicon, SCALEBLASTER, Scalewatcher, Shengde Huanbao, Shijiazhuang Tianshu, Shuangren Equipment Plant, XUKIN


