
Quick Navigation
Report Overview
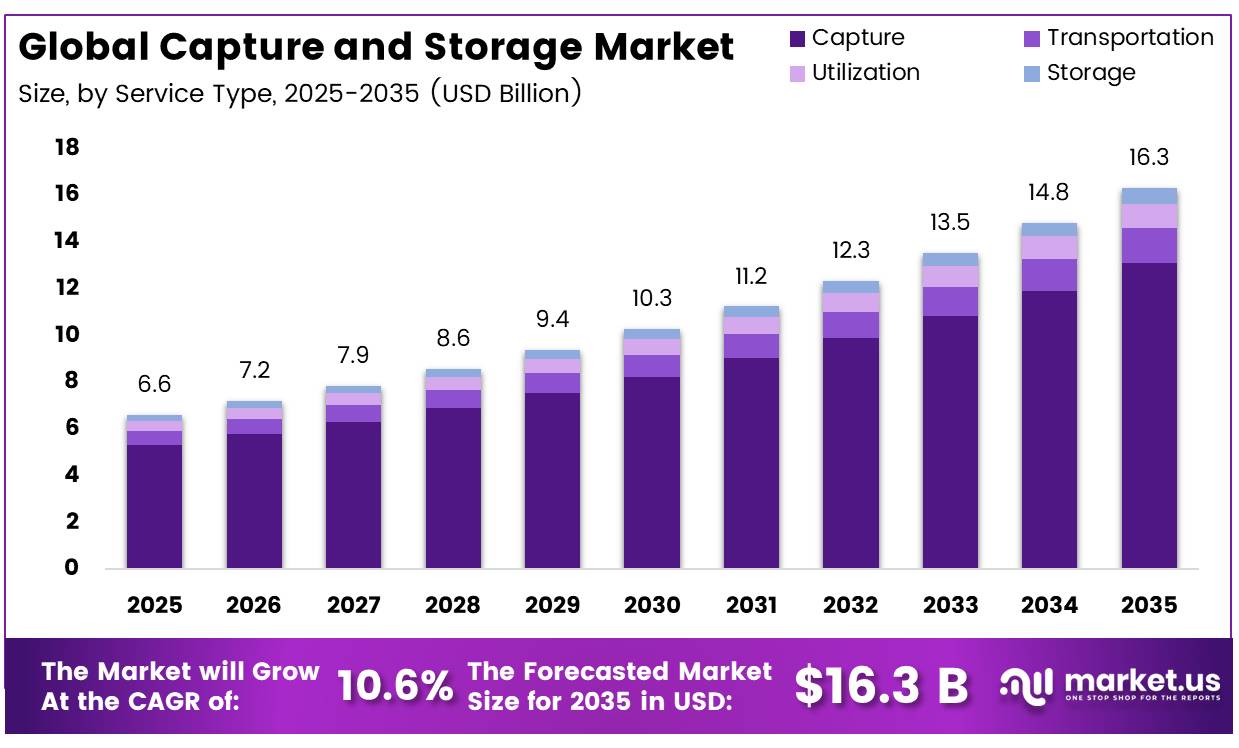
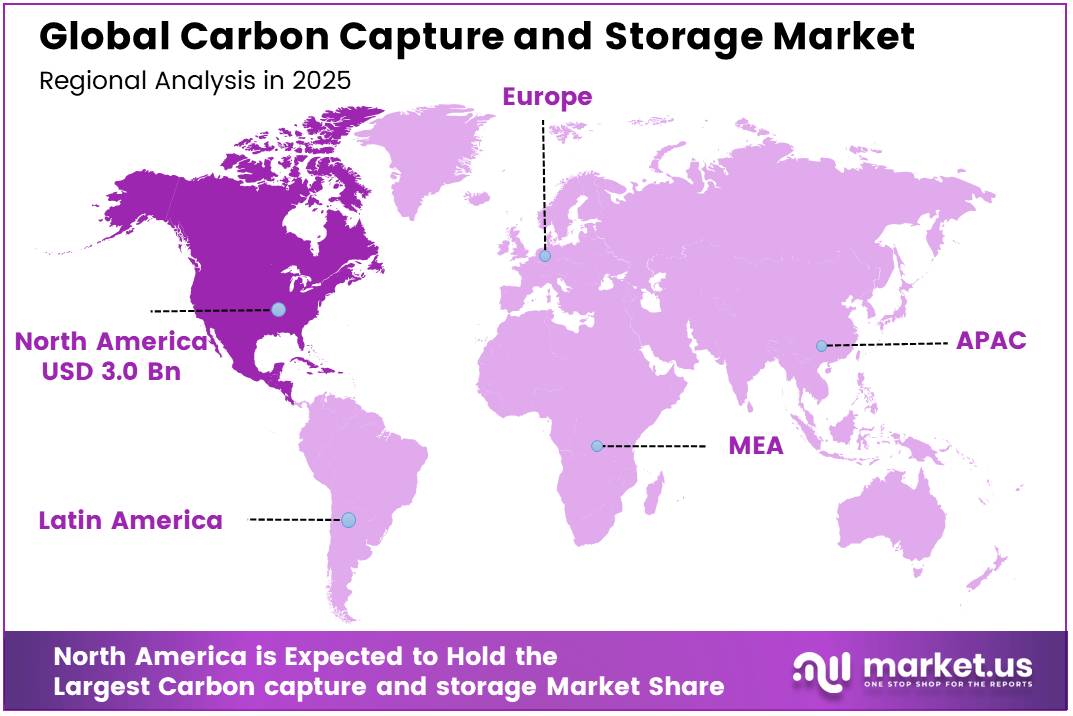
The Global Carbon and storage Market size is expected to be worth around USD 16.3 billion by 2035, from USD 6.6 billion in 2025, growing at a CAGR of 10.6% during the forecast period from 2025 to 2035. North America held a dominant market position, capturing more than a 45.80% share, holding USD 3.02 billion in revenue.
Carbon capture and storage (CCS) is moving from isolated demonstration plants toward shared industrial infrastructure that captures carbon dioxide from power generation, cement, steel, hydrogen, chemicals, and natural-gas processing, transports it by pipeline or ship, and injects it into permanent geological formations. The technology is increasingly viewed as a practical decarbonisation option for emissions that cannot be eliminated easily through electrification or renewable energy alone.
- The International Energy Agency reported that global capture and storage capacity exceeded 50 million tonnes of CO₂ annually in the first quarter of 2025. Based on the project pipeline, capture capacity could reach about 430 million tonnes per year by 2030, while announced storage capacity could approach 670 million tonnes. Projects at advanced development stages or under construction represented 60% of the pipeline, showing improving movement toward commercial execution.
Key Takeaways
- The Global Carbon Capture and Storage Market was valued at USD 6.6 billion in 2025.
- The Global Market is projected to grow at a CAGR of 10.6% and is estimated to reach USD 16.3 billion by 2035.
- On the basis of service, Capture dominated the market, constituting 80.30% of the total market share.
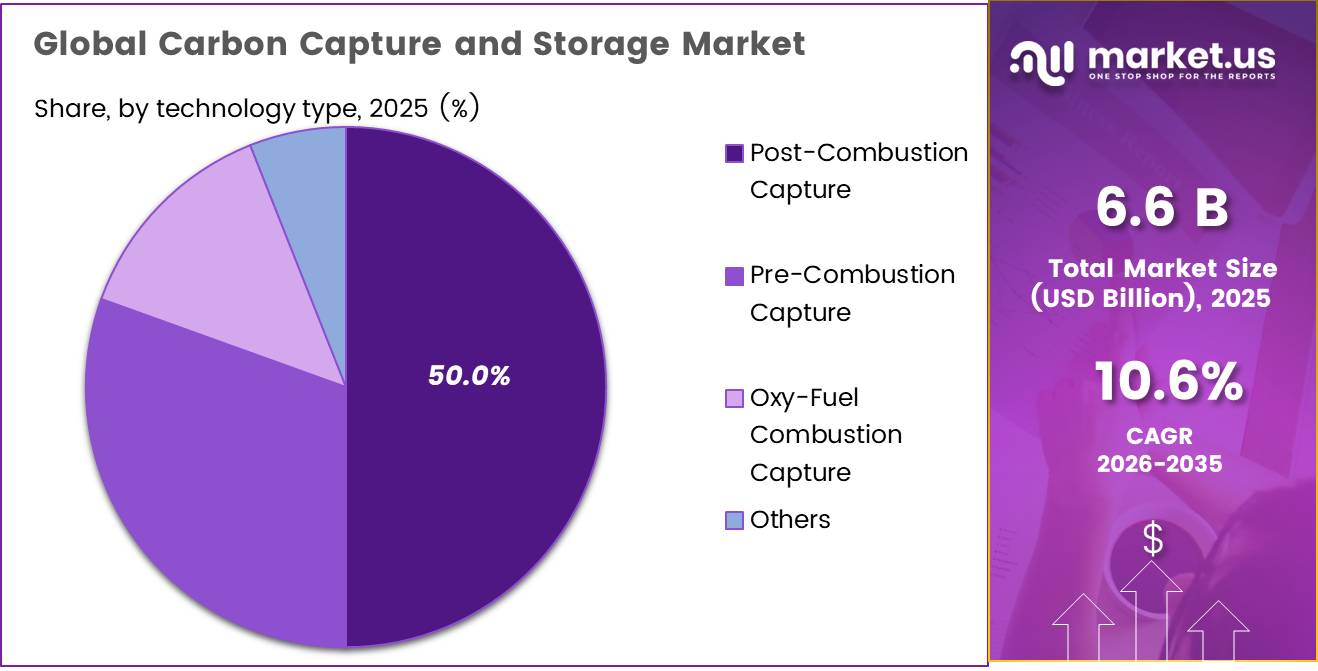
- Based on technology, Post-Combustion Capture dominated the Carbon Capture and Storage Market, with a substantial market share of 50.00%.
- Based on the capture source, Point Source Capture (Industrial Stacks) led the market, comprising 84.50% of the total market.
- Among the end-use industries, the Oil & Gas sector held a major share in the Carbon Capture and Storage Market, accounting for 42.00% of the market share.
- In 2025, North America was the most dominant region in the Carbon Capture and Storage Market, accounting for 45.80% of the total market and reaching USD 6.6 billion.
Growth is being driven by stronger carbon policies, tax incentives, long-term contracts, storage obligations, and public risk-sharing. In March 2026, the IEA stated that more than US$15 billion in commercial debt had been raised for CCUS projects during the previous two years. The European Union requires at least 50 million tonnes of annual CO₂ injection capacity by 2030 and estimates that approximately 250 million tonnes may need permanent storage each year by 2040. The United Kingdom has committed £21.7 billion over 25 years to support clusters.
Future opportunities will centre on multi-user transport and storage hubs, low-carbon cement and hydrogen, bioenergy with CCS, direct air capture, and cross-border CO₂ shipping. Growth will depend on faster permitting, reliable monitoring, clear liability rules, lower capture costs, and coordinated investment across capture, transport, and storage assets. Companies able to secure storage access and long-term customer contracts should gain the position as CCS develops into a network-based industrial service.
Capture and Storage Market Segmentation
Service Analysis
Capture dominates with 80.30% as carbon removal remains the foundation of CCS projects.
In 2025, Capture held a dominant market position, capturing more than a 80.30% share. By June 2025, the segment continued to lead because carbon dioxide must first be separated from industrial and energy-related emissions before it can be moved, used, or stored. Its strong position reflects the broad need for capture systems across large facilities seeking to lower emissions. The segment also benefits from steady improvements in process efficiency, plant integration, and operating reliability, which support wider project adoption.
Transportation is emerging as a growing service area. By June 2026, demand was supported by the development of shared pipelines, shipping networks, and hub-based infrastructure. These systems help connect capture locations with utilization sites and permanent storage areas, making transportation an essential link in larger carbon management networks for industrial operators.
Technology Analysis
Post-Combustion Capture leads because it can be fitted to existing industrial and power facilities.
In 2025, Post-Combustion Capture held a dominant market position, capturing more than a 50.00% share. By June 2025, the technology remained preferred because it removes carbon dioxide after fuel combustion, allowing operators to upgrade established plants without changing their core production process. Its strong position is supported by solvent-based systems, flexible installation options, and suitability across power generation, cement, chemicals, and other emission-intensive industries. Improvements in energy use, equipment design, and process integration are helping facilities improve capture performance and operating reliability.
Pre-Combustion Capture is emerging as a growing technology segment. By June 2026, its use was gaining attention in hydrogen, gasification, and integrated industrial projects where carbon dioxide can be separated before combustion. Its ability to work with concentrated gas streams supports efficient removal and strengthens its role in new low-carbon energy and industrial developments.
Capture Source Analysis
Point Source Capture leads because industrial stacks offer concentrated emissions and practical access for carbon removal.
In 2025, Point Source Capture (Industrial Stacks) held a dominant market position, capturing more than a 84.50% share. By June 2025, the segment remained central to carbon capture and storage projects because industrial facilities release carbon dioxide through exhaust points. These locations make capture equipment easier to install, monitor, and connect with transport and storage networks. Its leadership is supported by use across power generation, cement, chemicals, steel, refining, and other emission-intensive operations. Plant infrastructure also helps operators plan capture systems around stable and measurable emission streams.
Distributed / Mobile Source Capture is emerging as a growing segment. By June 2026, interest increased as industries explored carbon removal from smaller, scattered, and moving emission sources. Progress in compact equipment, modular systems, and flexible collection methods is supporting use across transport fleets and industrial sites.
End-Use Industry Analysis
Oil & Gas leads because established infrastructure supports carbon capture, transport, and permanent underground storage.
In 2025, Oil & Gas held a dominant market position, capturing more than a 42.00% share. By June 2025, the industry remained the leading end user because many operators already manage gas streams, pipelines, processing facilities, and underground reservoirs. These existing assets make carbon dioxide separation, movement, and injection easier to plan within operations. The segment also benefits from experience in subsurface evaluation, well management, pressure control, and long-term site monitoring.
Power Generation is emerging as a growing end-use segment. By June 2026, utilities were giving attention to carbon capture as they worked to lower emissions from existing thermal plants. Retrofit projects, cleaner power strategies, and access to shared transport and storage networks are supporting adoption.
Key Market Segments
By Service
- Capture
- Transportation
- Utilization
- Storage
By Technology
- Post-Combustion Capture
- Pre-Combustion Capture
- Oxy-Fuel Combustion Capture
- Others
By Capture Source
- Point Source Capture (Industrial Stacks)
- Distributed / Mobile Source Capture
- Direct Air Capture (Atmospheric)
By End-Use Industry
- Oil & Gas
- Power Generation
- Industrial (Cement, Fertilizers & Others)
- Others
Drivers
EU storage-capacity mandates and hubs
The EU now has a legally binding target of at least 50 million tonnes per year of CO2 injection capacity by 2030, annual reporting obligations from member states, and contribution requirements for oil and gas producers based on their 2020–2023 production shares, with obligated entities required to submit plans by 30 June 2025 and annual progress reports from 2026 onward. In parallel, the Industrial Carbon Management Strategy models 50 Mt of annual CO2 captured in the EU by 2030, 280 Mt by 2040, and 450 Mt by 2050, while estimating roughly €3 billion for storage-facility investment, €6.2–9.2 billion for associated transport infrastructure, and a funding shortfall of about €10 billion by 2030 for currently announced CCS projects.
These measures matter because they shift CCS from isolated capture projects toward hub economics, where emitters can plug into shared shipping, pipeline, and saline-storage systems rather than each carrying full infrastructure burden. That reduces stranded-asset risk, supports cross-border contracting, and improves permitting confidence, which is why this driver adds an estimated +1.8 percentage points to market CAGR across the North Sea, Benelux, Scandinavia, and heavy-industry corridors in Germany, France, and Southern Europe.
Drivers Impact Analysis
| Driver | (~) % Impact on CAGR | Geographic Relevance | Impact Timeline |
|---|---|---|---|
| 45Q-backed U.S. project bankability | +2.1% | North America core | Short term (≤ 2 years) |
| EU storage-capacity mandates and hubs | +1.8% | EU core, North Sea corridor | Medium term (2-4 years) |
| Industrial decarbonization demand from hard-to-abate sectors | +1.6% | North America, EU, Middle East, APAC industrial belts | Medium term (2-4 years) |
| Rapid global project-pipeline expansion | +1.9% | North America core, EU, APAC corridors, Middle East spill-over | Short term (≤ 2 years) |
| First-wave non-recourse and blended financing | +1.3% | North America, EU, selected APAC | Medium term (2-4 years) |
| CO2 transport and shared-storage network buildout | +1.7% | EU North Sea, U.S. Gulf Coast, Canada hubs, Asia pilots | Long term (≥ 4 years) |
Restraints
High capture-cost burden
The largest restraint remains the cost burden at the capture stage because this is where most CCS value destruction occurs before transport or storage optimization can even begin: full CCS chain costs still span roughly $20–150 per tonne globally, with a weighted average around $58/t, but hard-to-abate industrial sources such as steel, cement, and chemicals can move toward $75–100/t or higher once flue-gas dilution, impurities, retrofit downtime, and energy penalties are incorporated. Since roughly two-thirds of lifetime CCS costs are incurred upfront, developers face a front-loaded capex and energy-intensity problem that erodes returns even when policy support exists.
For a 1 Mtpa cement or refinery project, a $20/t adverse capture-cost deviation can swing annual economics by about $20 million, while a 15%–25% EPC inflation shock across compressors, absorbers, heat exchangers, and power integration can push total installed cost beyond original FID envelopes and extend payback by 2–4 years. This restraint deducts an estimated 2.0 percentage points from baseline CAGR because high cost-to-abate levels reduce the viable customer pool to only the most policy-supported or emissions-exposed assets, delay retrofit decisions, and force project developers to prioritize a narrower set of high-concentration CO2 streams rather than broad market roll-out.
Restraint Impact Aalysis
| Restraint | (~) % Impact on CAGR | Geographic Relevance | Impact Timeline |
|---|---|---|---|
| High capture-cost burden | -2.0% | EU core, APAC industrial belts, emerging markets | Medium term (2-4 years) |
| Storage and transport bottlenecks | -1.8% | EU core, APAC corridors, inland North America | Medium term (2-4 years) |
| Permitting and liability drag | -1.5% | EU regulatory hubs, North America, offshore basins | Long term (≥ 4 years) |
| Financing gap beyond incentives | -1.4% | North America, EU, APAC emerging markets | Short term (≤ 2 years) |
| Weak carbon-price monetization | -1.1% | APAC, Middle East, Latin America, selective US sectors | Medium term (2-4 years) |
| Public acceptance and leakage risk | -0.9% | EU offshore, onshore storage markets, new basins | Long term (≥ 4 years) |
Opportunity
Advanced carbon materials from captured CO2
The carbon capture advanced materials market was valued around US$820 million in 2025 and is projected to reach US$1.86 billion by 2034, reflecting a segment that is real but growing from a tiny base relative to overall CCS project economics. The specific opportunity is in CO2 mineralization, where captured carbon is permanently locked into building aggregates, concrete, and carbonation-cured products at a conversion cost potentially competitive with geological storage when credits and avoided raw-material costs are combined.
Scaling this pathway requires CCS operators to partner with materials science companies, construction aggregates producers, and specialty chemical firms, effectively transforming CO2 pipelines into feedstock supply chains for durable solid materials; a 1 Mtpa capture asset that diverts even 10%–20% of its CO2 into mineralization products valued at $200–500 per tonne creates $20–100 million per annum of incremental high-margin revenue that sits entirely outside the current sequestration business model. The long execution window reflects the remaining material qualification, standardization, and construction-code adoption work required, but the +1.0 percentage-point CAGR upside is highly defensible as a 2030–2035 market contribution in North America, Europe, Japan, and Korea.
Opportunity Impact Analysis
| Opportunity | (~) % Potential CAGR | Geographic Relevance | Execution Window |
|---|---|---|---|
| CO2 utilization as industrial feedstock | +2.3% | EU, North America core, China, Japan, Korea | Medium term (2-4 years) |
| BECCS and CDR monetization via compliance markets | +2.0% | EU core, North America, APAC pilots | Medium term (2-4 years) |
| Maritime and aviation CCS services | +1.5% | EU core, global shipping hubs, Middle East | Short term (≤ 2 years) |
| Modular and small-scale capture deployment | +1.8% | Asia-Pacific corridors, India, emerging markets | Medium term (2-4 years) |
| AI-driven MRV and carbon asset management | +1.2% | North America, EU, APAC digital corridors | Short term (≤ 2 years) |
| Advanced carbon materials from captured CO2 | +1.0% | North America, EU, Japan, Korea | Long term (≥ 4 years) |
Challenge
Subsurface talent bottleneck
The UK Carbon Capture and Storage Association’s 2026 update indicates transport and storage roles alone could account for 20%–30% of direct labor demand across the CCUS sector, with peak annual direct labor demand reaching about 15,000 roles through 2030 and more than 50,000 jobs potentially supported by 2050 if deployment proceeds at full scale.
For project developers, the result is slower appraisal drilling, longer site-characterization cycles, rising contractor day rates, and more conservative project sequencing, which can add 6–18 months to development schedules and lift pre-FID technical spend by high single digits. The modeled friction drag of 1.0 percentage point reflects that growth remains possible, but it must be paced by the rate at which specialist subsurface talent can be trained, transferred, and retained across multiple simultaneous CCS clusters.
Challenges Impact Analysis
| Challenge | (~) % CAGR Friction | Geographic Relevance | Mitigation Horizon |
|---|---|---|---|
| Subsurface talent bottleneck | -1.0% | UK clusters, EU hubs, North America core | Long term (≥ 4 years) |
| Long-lead equipment congestion | -1.1% | North America, EU, APAC fabrication corridors | Medium term (2-4 years) |
| MRV data standardization gaps | -0.8% | EU regulatory hubs, North America, global projects | Medium term (2-4 years) |
| Cluster coordination misalignment | -0.9% | EU North Sea, UK clusters, U.S. Gulf Coast | Medium term (2-4 years) |
| FOAK performance variability | -1.2% | Global industrial pilots, emerging CCS regions | Long term (≥ 4 years) |
| Skills transfer and ageing workforce | -0.7% | UK, EU, North America, mature industrial basins | Long term (≥ 4 years) |
Geopolitical Impact Analysis
Geopolitical Realignment and Cross-Border CO₂ Trade Reshaping CCS Development
Geopolitical competition is reshaping the Carbon Capture and Storage Market by turning carbon dioxide transport and storage access into strategic infrastructure. Countries with offshore reservoirs are positioning themselves as regional storage providers, while industrial economies lacking domestic capacity are pursuing bilateral arrangements, shipping routes, and compatible permitting systems. This shift is creating commercial corridors but exposing projects to treaty, liability, and regulatory risks.
Norway’s Longship development illustrates this realignment. In June 2025, its Northern Lights network entered operation with storage capacity of 1.5 million tonnes. Phase two is designed to raise capacity to at least 5 million tonnes, supported by customers from Denmark, the Netherlands, and Sweden. Norway and France established an arrangement for cross-border carbon dioxide transport and storage, showing how diplomatic agreements are becoming essential to project execution.
Asia is developing a different policy pathway. Japan designated an offshore area near Tomakomai for exploratory drilling in February 2025 and scheduled its CCS Business Act to take effect on May 22, 2026. The framework introduces licensing and oversight for storage operators.
International rules remain important. The London Protocol allows participating countries to arrange carbon dioxide exports for subseabed storage. These developments support market expansion, although differing national standards, approval timelines, monitoring duties, and long-term liability rules may delay investment, raise transaction costs, and further fragment regional CCS supply chains.
Regional Analysis
North America leads with 45.80% share, supported by established infrastructure and public incentives.
In 2025, North America dominated the Carbon Capture and Storage Market with a 45.80% share, valued at USD 3.02 billion. The region benefits from operating capture facilities, extensive pipeline networks, geological formations, and experience in carbon dioxide injection. In January 2025, the U.S. Department of Energy announced USD 101 million for five capture, removal, and conversion test-centre projects. Canada also supports investment through a refundable CCUS tax credit of up to 60% for eligible expenditure incurred through 2030.
Europe is expanding through shared North Sea storage hubs, carbon-management policies, and cross-border transport networks. Asia Pacific is gaining momentum as industrial economies assess capture projects for coal power, steel, cement, and chemicals. Latin America offers opportunities around natural-gas processing and geological storage, while the Middle East and Africa are developing CCS alongside hydrogen, refining, and upstream energy operations.
Key Regions and Countries Covered
- North America
- US
- Canada
- Europe
- Germany
- France
- The UK
- Spain
- Italy
- Rest of Europe
- Asia Pacific
- China
- Japan
- South Korea
- India
- Australia
- Rest of APAC
- Latin America
- Brazil
- Mexico
- Rest of Latin America
- Middle East & Africa
- South Africa
- Saudi Arabia
- UAE
- Rest of MEA
Key Players Analysis
Carbon capture and storage companies focus on strengthening technology performance, project execution capabilities, and infrastructure integration to maintain a competitive position. A major priority is improving capture efficiency while reducing energy consumption and operating costs across power generation, oil and gas, cement, steel, chemicals, and hydrogen facilities. Key players are also expanding their involvement across the complete CCS value chain, including carbon dioxide separation, compression, pipeline and ship transportation, geological storage, monitoring, and long-term site management.
Strategic partnerships with industrial emitters, energy companies, governments, and storage operators help companies secure reliable carbon volumes and improve project economics. Developers increasingly invest in shared transport and storage hubs because these networks can serve multiple industrial facilities and spread infrastructure costs across a wider customer base. Access to suitable geological formations, technical expertise, project financing, and regulatory approvals remains important for market positioning. Companies also emphasize digital monitoring, leakage detection, reservoir modelling, and measurement, reporting, and verification systems to support safety and regulatory compliance.
Market Key Players
- Shell plc
- ExxonMobil Corporation
- Equinor ASA
- TotalEnergies SE
- Occidental Petroleum (OXY)
- Linde plc
- Mitsubishi Heavy Industries (MHI)
- Fluor Corporation
- Aker Solutions ASA
- SLB (Schlumberger)
- Siemens Energy
- Honeywell International
- Baker Hughes Company
- Climeworks AG
- TechnipFMC plc
Key Development
- By May 2026, ExxonMobil Corporation reported agreements covering approximately 9 million tonnes of CO₂ per year and two projects already operating. Its infrastructure included more than 1,300 miles of CO₂ pipelines and potential storage and transportation capacity exceeding 100 million tonnes annually.
- In March 2025, Shell and its equal Northern Lights partners, Equinor and TotalEnergies, approved a NOK 7.5 billion, or about USD 700 million, second-phase investment.
Report Scope
| Report Features | Description |
|---|---|
| Market Value (2025) | USD 6.6 Bn |
| Forecast Revenue (2035) | USD 16.3 Bn |
| CAGR (2026-2035) | 10.6% |
| Base Year for Estimation | 2025 |
| Historic Period | 2020-2024 |
| Forecast Period | 2026-2035 |
| Report Coverage | Revenue Forecast, Market Dynamics, Competitive Landscape, Recent Developments |
| Segments Covered | By Technology (Pre-combustion Capture, Post-combustion Capture, Oxy-fuel Combustion Capture), By Service (Capture, Transportation, Storage, Utilization), By End-use Industry (Oil And Gas, Power Generation, Others), By Application (Enhanced Oil Recovery, Dedicated Storage) |
| Regional Analysis | North America – The US & Canada; Europe – Germany, France, The UK, Spain, Italy, Russia & CIS, Rest of Europe; APAC– China, Japan, South Korea, India, ASEAN & Rest of APAC; Latin America– Brazil, Mexico & Rest of Latin America; Middle East & Africa– GCC, South Africa, & Rest of MEA |
| Competitive Landscape | ExxonMobil Corporation, Shell plc, Chevron Corporation, BP plc, Total Energies SE, Equinor ASA, Occidental Petroleum Corporation, Schlumberger Limited, Mitsubishi Heavy Industries, Aker Carbon Capture ASA, Linde plc, Air Liquide S.A., Fluor Corporation, Carbon Engineering Ltd., Climeworks AG, Other. |
| Customization Scope | Customization for segments, region/country-level will be provided. Moreover, additional customization can be done based on the requirements. |
| Purchase Options | We have three licenses to opt for: Single User License, Multi-User License (Up to 5 Users), Corporate Use License (Unlimited Users and Printable PDF) |


