


Report Overview
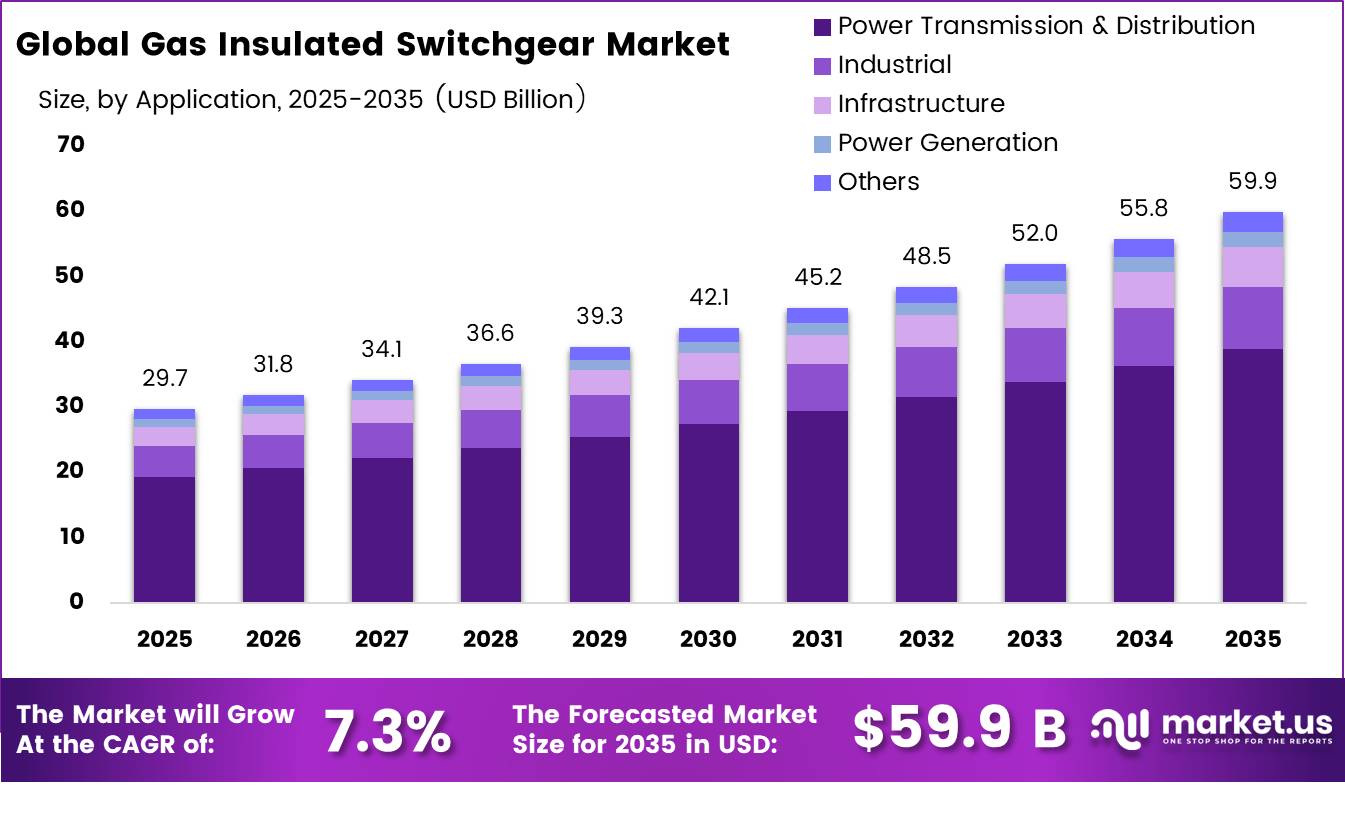
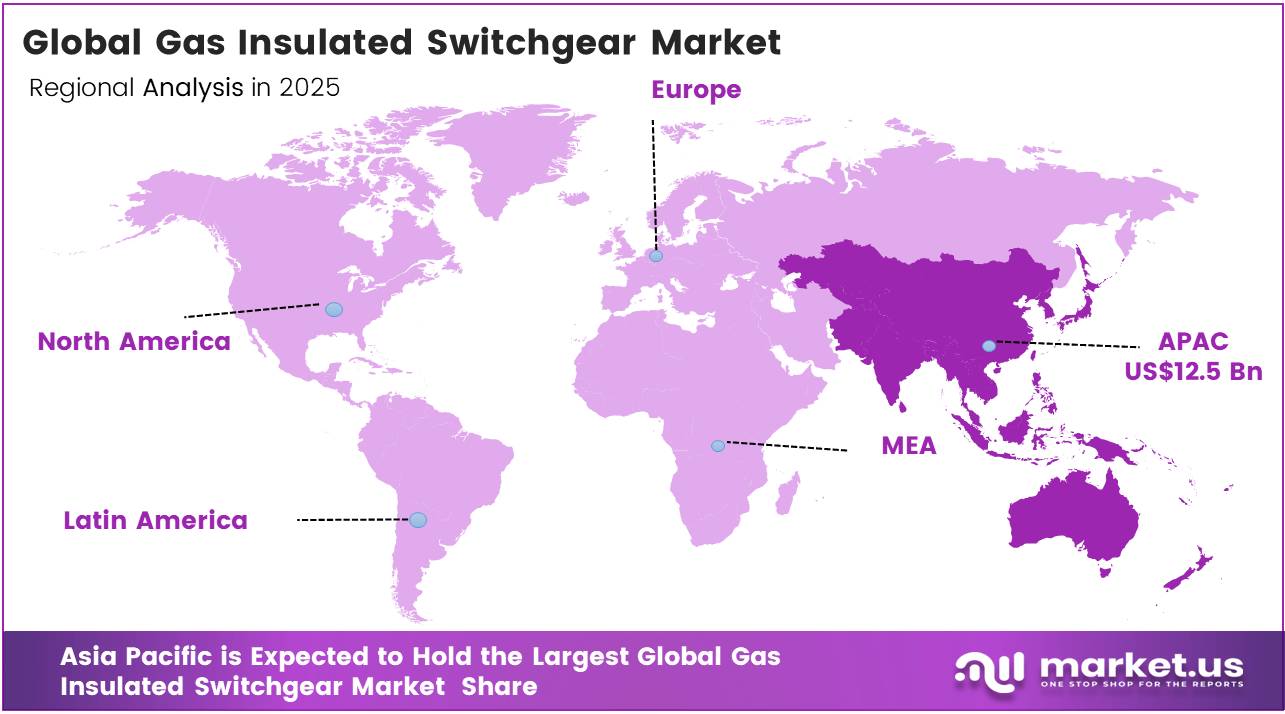
In 2025, the Global Gas Insulated Switchgear Market was valued at USD 29.7 billion. The market is projected to grow at a CAGR of 7.3% during 2026 to 2035, reaching approximately USD 59.9 billion by 2035. Asia Pacific dominated the global market in 2025, accounting for more than 42% of the total share and generating approximately USD 12.5 billion in revenue.
Gas-insulated switchgear (GIS) is a sealed power-control system that encloses circuit breakers, disconnectors, busbars and instrument transformers within a pressurised insulating medium. Its compact footprint, resistance to pollution and suitability for indoor or underground substations make it important in dense cities, offshore facilities, renewable-energy connections, data centres and high-voltage transmission networks.
- According to the International Energy Agency (IEA), global electricity consumption is projected to increase by nearly 1,000 TWh annually through 2035, driven by industrial expansion, electric vehicles, AI-powered data centers, and rising cooling demand in developing economies.
The IEA also projects peak electricity demand to rise by around 40% by 2035, increasing the need for reliable high-voltage grid infrastructure. GIS is becoming the preferred solution because it offers high reliability, requires less land, and is well suited for urban substations, renewable energy projects, and space-constrained installations.
- According to the IEA’s World Energy Investment 2025 report, global energy investment is expected to reach USD 3.3 trillion in 2025, including USD 2.2 trillion for clean energy, electricity grids, electrification, and energy storage. Annual grid investment has reached around USD 400 billion, with further increases needed to support renewable energy integration.
According to IRENA, the region added a record 513 GW of renewable capacity in 2025, representing over 74% of global additions, while China alone contributed more than 440 GW. China has already commissioned 41 ultra-high-voltage (UHV) transmission projects (22 AC and 19 DC), increasing cross-regional transmission capacity by 30%, and plans to expand transmission capacity to 420 GW by 2030 through 15 additional UHV lines.
- Regulation is becoming a major technology driver. In June 2025, the European Commission estimated that Europe requires EUR 730 billion for distribution networks and EUR 477 billion for transmission development by 2040. EU Regulation 2024/573 prohibits new fluorinated-gas switchgear up to 24 kV from January 2026, extends restrictions above 24 kV through 52 kV from 2030, and covers selected 52–145 kV equipment from 2028.
This creates strong opportunities for SF6-free GIS, retrofit engineering, gas recovery, digital diagnostics and lifecycle services. SF6 replacement is commercially important because its global-warming potential is 24,300 times that of carbon dioxide and it can remain in the atmosphere for more than 1,000 years.
Key Takeaways
- The global Gas Insulated Switchgear market was valued at USD 29.7 billion in 2025.
- The market is projected to grow at a CAGR of 7.3% and is estimated to reach USD 59.9 billion by 2035.
- On the basis of Installation, the outdoor dominated the market, constituting 58.5% of the total market share.
- Based on the insulation type, the SF6 dominated the Gas Insulated Switchgear market, with a substantial market share of around 67.2%.
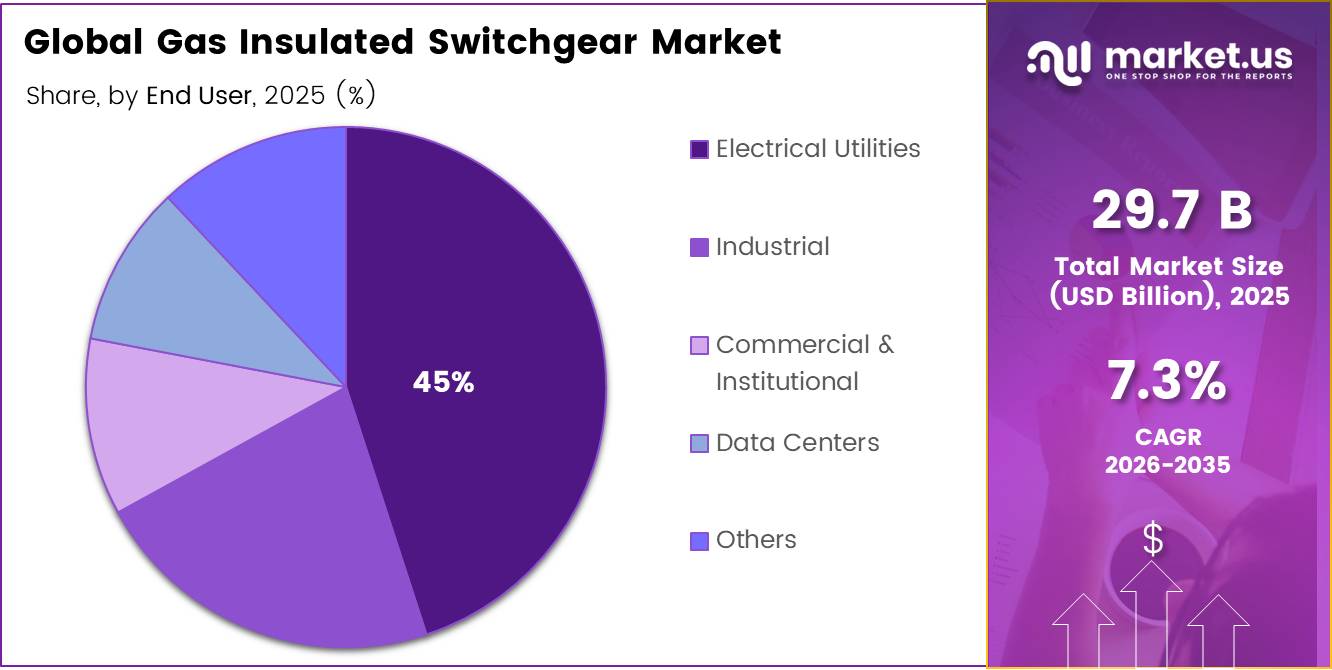
- Based on the End User, Electrical Utilities led the market, comprising 45% of the total market.
- Among the voltage rating, Above 220 kV held a major share in the Gas Insulated Switchgear market, 35% of the market share.
- Among the Application, Power Transmission & Distribution is the most considerable within the market, accounting for around 65% of the revenue.
- In 2025, the Asia Pacific was the most dominant region in the Gas Insulated Switchgear market, accounting for 42% of the total global consumption.
Installation Analysis
Outdoor represents dominant Segment in the Market.
Outdoor installations accounted for a dominant 58.5% share of the global Gas Insulated Switchgear (GIS) market in 2025, supported by rapid expansion and modernization of high-voltage transmission networks worldwide. Every new long-distance transmission line requires substations at both the sending and receiving ends, making outdoor GIS the preferred choice due to its compact design, high reliability, weather resistance, and low maintenance requirements.
According to the Central Electricity Authority (CEA), the National Electricity Plan targets the addition of approximately 114,687 circuit kilometers of transmission lines at 220 kV and above through 2027, supported by investments of around ₹9 trillion (USD 108 billion) by 2031–32. In FY 2025–26, Power Grid Corporation of India commissioned more than 2,300 circuit kilometers of 765 kV transmission lines, strengthening renewable energy connectivity across Rajasthan and Gujarat. In Europe, the European Commission’s Grids Package (2025) reported that 40% of EU distribution grids are over 40 years old and estimated that €584 billion will be required for grid modernization, including doubling cross-border transmission capacity by 2030.
- In the United States, the American Society of Civil Engineers (ASCE) reported utility investments of USD 27.7 billion in transmission infrastructure during 2023, up from USD 20 billion in 2022, representing a 38.5% increase. Additionally, the U.S. Department of Energy plans to expand long-distance transmission capacity by 16% by 2030, including 7,500 miles of new transmission lines. Globally, transmission substations, primarily outdoor installations, represented 58.3% of the electric substation market in 2025, reinforcing outdoor GIS as the leading installation type.
Insulation Type Analysis
SF6 a significant type
SF6 gas insulation accounted for 67.2% of the global gas-insulated switchgear (GIS) market in 2025, maintaining its leading position due to its superior performance in high-voltage power transmission. Its dominance is driven by proven technical reliability rather than market preference.
- According to the U.S. Environmental Protection Agency (EPA), SF6 has been the standard insulating and arc-quenching gas in high-voltage circuit breakers and GIS since the 1950s. The EPA also reports that approximately 67% of SF6 emissions in the United States come from the electrical transmission and distribution sector, highlighting its widespread use in existing grid infrastructure. SF6 offers a dielectric strength about 2.5 times higher than air under similar conditions and reaches 8 to 9 times the insulating capability of air at 5 bar pressure.
The large installed base of SF6 equipment further strengthens its market position. According to the IPCC Task Force on National Greenhouse Gas Inventories, the electrical sector accounts for nearly 50% of global industrial SF6 emissions, reflecting the extensive deployment of SF6-based GIS worldwide. Regulatory developments also indicate that SF6 will remain in use for several years.
Under the EU F-Gas Regulation, new 145 kV SF6 installations are permitted until January 2028, while 420 kV systems remain allowed until at least January 2032. At the same time, major developing markets, including India and many countries in Southeast Asia and Sub-Saharan Africa, have not introduced mandatory SF6 phase-out regulations.
End User Analysis
Electrical Utilities Are the Most Widely Used.
Electrical utilities accounted for more than 45% of the global GIS market in 2025, supported by their position as the largest owners and investors in high-voltage transmission and distribution networks worldwide. Utilities are responsible for expanding, upgrading, and maintaining power grids, making them the largest buyers of gas-insulated switchgear (GIS).
- According to the Edison Electric Institute (EEI), U.S. investor-owned electric utilities invested a record USD 178.2 billion in grid infrastructure in 2024, marking the 13th consecutive year of record capital spending. Of this, more than USD 32.6 billion was allocated to transmission projects. EEI also projects that utilities will invest over USD 1.1 trillion between 2025 and 2029 to strengthen grid reliability, support AI data centers, manufacturing growth, and increasing electrification.
The dominance of electrical utilities is also evident across emerging economies. According to the World Bank, utilities remain the primary organizations responsible for transmission infrastructure in low- and middle-income countries, although fewer than 40% recover their full operating and financing costs. This has increased support from multilateral funding agencies for grid expansion projects.
- The International Finance Corporation (IFC) also reports that the Single Buyer Model is now used in approximately 89 countries, where a central state-owned utility manages power purchases and grid operations. This structure makes public utilities the largest institutional buyers of GIS equipment across Asia, Africa, and Latin America.
Voltage Rating Analysis
Above 220 kv Held a Major Share of the Gas Insulated Switchgear Market.
In 2025, Above 220 kV held a dominant market position, capturing more than a 35% share of the Gas Insulated Switchgear market by voltage rating. The above 220 kV segment held the largest share of the global GIS equipment market in 2025, accounting for more than 35% of total revenue. Its leadership is driven by the growing need for efficient long-distance power transmission, where higher voltage levels reduce transmission losses and improve grid reliability. Every extra-high-voltage transmission corridor requires GIS equipment rated above 220 kV at substations for safe switching and power control.
- According to the Ministry of Power, Government of India, the country’s transmission network exceeded 500,000 circuit kilometers of lines rated 220 kV and above in January 2026. This includes 57,323 circuit kilometers of 765 kV lines and more than 19,000 circuit kilometers of ±800 kV and ±500 kV HVDC transmission lines. In addition, the Central Electricity Authority (CEA) reported transformation capacity of 1,407 GVA at 220 kV and above, highlighting the expanding installed base of high-voltage infrastructure.
The same trend is visible globally. ENTSO-E’s TYNDP 2024 identified 177 transmission projects and 33 storage projects across Europe, with most transmission investments focused on 400 kV and above networks. The organization also estimates around €400 billion will be invested in offshore transmission infrastructure, primarily using voltage levels above 220 kV.
- In China, the State Grid Corporation reported 1.34 billion kW of grid-connected wind and solar capacity by June 2025, nearly three times the 2020 level. This renewable capacity is connected through 500 kV, 1000 kV AC, and ±800 kV DC transmission networks, creating sustained demand for GIS equipment rated above 220 kV.
By Application Analysis
Gas Insulated Switchgears Are Mostly Utilized in the Power Transmission & Distribution.
Power Transmission & Distribution (T&D) accounted for more than 65% of the global GIS market in 2025, driven by the essential role of gas-insulated switchgear in high-voltage substations. GIS is widely used in new and upgraded transmission and distribution networks because it offers high reliability while requiring 60–70% less space than conventional air-insulated switchgear. This compact design makes GIS the preferred choice for urban areas, industrial zones, and renewable energy grid connections where land availability is limited.
- According to REN21, global investment in power grid infrastructure increased by 5.3% to USD 310.2 billion in 2023. The IEA World Energy Investment 2024 report further stated that grid investment reached USD 375 billion in 2024, representing a 21% year-over-year increase, with transmission and distribution equipment accounting for the largest share of spending.
In addition, the IEA Building the Future Transmission Grid report highlighted that around 1,650 GW of wind and solar projects were awaiting grid connections in 2024, creating substantial demand for new substations and GIS installations. The World Bank’s Tracking SDG 7: Energy Progress Report 2025 also reported that nearly 92% of the global population has access to electricity, requiring continuous expansion and modernization of transmission and distribution networks, which is expected to sustain strong demand for GIS equipment.
Key Market Segments
By Installation
- Outdoor
- Indoor
By Insulation Type
- SF6
- SF6-free
By End User
- Electrical Utilities
- Industrial
- Commercial & Institutional
- Data Centers
- Others
By Voltage Rating
- Above 220 kV
- 74-220 kV
- 6-73 kV
- 28-40.5 kV
- 16-27 kV
- 6-15 kV
- Up to 5 kV
By Application
- Power Transmission & Distribution
- Industrial
- Infrastructure
- Power Generation
- Others
Driver Analysis
Grid build-out for renewable evacuation and urban load density
India’s Central Electricity Authority stated that more than 1,91,000 circuit km of transmission lines and 1,270 GVA of transformation capacity are planned for addition during 2022-23 to 2031-32, while inter-regional transfer capacity is planned to rise from 119 GW to 168 GW by 2032; the same plan is explicitly tied to integrating 500 GW of renewable capacity by 2030 and over 600 GW by 2032.
India’s Ministry of Power also reported maximum demand of 242.49 GW in FY 2025-26 and installed capacity of 509.743 GW by November 2025, showing that load growth and generation additions are running in parallel rather than sequentially, which increases the probability of simultaneous procurement of bays, transformers, and compact gas-insulated substations rather than isolated switchgear packages. In commercial terms, this driver raises projectable bay demand, improves factory utilization for enclosure-heavy product lines, and supports a higher mix of turnkey packages, protection integration, and digital monitoring attachments, which is why it contributes an estimated +2.1 percentage points to forward CAGR in the 2026 baseline.
Drivers Impact Analysis
| Driver | (~) % Impact on CAGR Forecast | Geographic Relevance | Impact Timeline |
|---|---|---|---|
| Grid build-out for renewable evacuation and urban load density | +2.1% | India core, China corridors, EU urban nodes, North America metros | Medium term (2-4 years) |
| SF6 phase-down and low-GWP switchgear substitution | +1.8% | EU core, California/New York, advanced APAC spill-over | Short term (≤ 2 years) |
| Resilience spending for weather-hardening and compact substation design | +1.4% | North America core, Japan, coastal EU, dense South Asia cities | Medium term (2-4 years) |
| Transmission permitting acceleration and substation modernization | +1.2% | Germany core, India core, selected EU corridors | Short term (≤ 2 years) |
| Compliance-led monitoring, leak control, and lifecycle service intensity | +0.9% | EU, U.S. regulated states, utility fleets globally | Short term (≤ 2 years) |
| High-voltage corridor expansion and transformation capacity additions | +1.6% | India core, China core, interconnection-heavy EU markets | Long term (≥ 4 years) |
Restraint Analysis
Grid equipment lead-time inflation
A second major restraint is broader grid-equipment congestion, because GIS competes for manufacturing slots, skilled labor, test capacity, and upstream electrical materials within the same transmission buildout cycle that DOE describes as increasingly strained. DOE’s grid supply chain review notes that critical grid components face limited to no domestic manufacturing capacity in some segments, that 82% of large power transformers consumed in the United States were imported in 2019, and that component suppliers such as bushings and tap changers can create bottlenecks through long lead times exacerbated by pandemic-era disruptions; the same report also states that transmission projects can take 3 to 10 years, making schedule slip highly destructive to procurement economics.
Even though the report centers on transformers and HVDC systems rather than GIS alone, the strategic read-through is strong: utility substation packages are procured as interdependent systems, so delayed transformers, breakers, sensors, and switchyard components can postpone GIS revenue recognition, elevate working-capital lockup, and compress margins through liquidated-damages risk, supporting an estimated -1.6 percentage point short-term hit to GIS CAGR in 2026.
Restraint Impact Analysis
| Restraint | (~) % Impact on CAGR Forecast | Geographic Relevance | Impact Timeline |
|---|---|---|---|
| SF6 phaseout compliance cost | -1.4% | North America core, EU | Short term (≤ 2 years) |
| Alternative-gas qualification drag | -1.1% | EU, North America core, APAC corridors | Medium term (2-4 years) |
| Grid equipment lead-time inflation | -1.6% | North America core, EU, APAC corridors | Short term (≤ 2 years) |
| Imported component dependence | -1.2% | North America core, LATAM importers, MEA projects | Medium term (2-4 years) |
| Utility CapEx timing friction | -0.9% | North America core, EU | Medium term (2-4 years) |
| Emissions reporting and leak controls | -0.7% | California, New York, Massachusetts, EU | Long term (≥ 4 years) |
Opportunity Analysis
Renewable pooling hubs
This is an opportunity because baseline GIS growth already captures ordinary transmission expansion, but the untapped upside sits in designing standardized GIS architectures for renewable energy pooling hubs, collector substations, and multi-infeed evacuation nodes that emerge when countries move from linear grid addition to cluster-based renewable integration; India alone has planned transmission for about 537 GW of renewable capacity by 2030, including 50,890 circuit-km of lines and 433,575 MVA of substation capacity at an estimated INR 2,44,200 crore, which signals a large secondary market for compact, high-reliability switching packages around congested renewable corridors rather than just conventional substation sales.
The white space is to pre-engineer modular GIS blocks for 220 kV to 420 kV renewable hubs, reduce engineering hours by 20% to 25%, cut site footprint by 35% to 50% versus AIS in land-constrained nodes, and monetize digital commissioning plus fleet diagnostics, allowing vendors to expand share of balance-of-substation spend from roughly 8% to 11% today toward 12% to 15% in hub-centric projects; because the IEA still sees the world falling short of the more than 11,000 GW tripling pathway even as policy ambition rises, suppliers that make renewable evacuation faster and denser can capture incremental orders above baseline planning assumptions, supporting about 1.9 percentage points of CAGR upside in India, MENA, and fast-build APAC systems.
Opportunity Impact Analysis
| Opportunity | (~) % Potential CAGR Upside | Geographic Relevance | Execution Window |
|---|---|---|---|
| SF6-free retrofit cycle | +2.4% | EU core, UK, Australia, advanced APAC | Short term (≤ 2 years) |
| Renewable pooling hubs | +1.9% | India, MENA, APAC emerging markets | Medium term (2-4 years) |
| Offshore HV platform GIS | +1.6% | North America, North Sea Europe, East Asia | Medium term (2-4 years) |
| GIS-as-a-service lifecycle | +1.3% | North America core, EU, GCC | Short term (≤ 2 years) |
| Urban resilience microgrids | +1.1% | Japan, South Korea, Singapore, megacity Asia | Medium term (2-4 years) |
| Roll-up of service and retrofit firms | +1.5% | EU, North America, India | Long term (≥ 4 years) |
Challenges Analysis
Recycled gas servicing gap
A less visible but material challenge is the service-side gap between installed SF6 fleets and the evolving policy preference for reclaimed or recycled gas in maintenance, especially in Europe where the legal direction clearly narrows future dependence on virgin SF6 for servicing applications. That creates a practical mismatch between the large legacy installed base and the still-developing ecosystem for gas recovery, purification, certification, cylinder logistics, and technician readiness, leading to a modeled 0.8 percentage-point drag as maintenance events require more planning days, more chain-of-custody controls, and tighter quality assurance around gas handling than the legacy operating model assumed.
Challenges Impact Analysis
| Challenge | (~) % CAGR Friction Drag | Geographic Relevance | Mitigation Horizon |
|---|---|---|---|
| SF6 transition engineering | -1.4% | EU regulatory hubs; export-linked OEM bases | Medium term (2-4 years) |
| Grid component lead-time spillover | -1.1% | North America core; APAC logistics corridors; EU project clusters | Medium term (2-4 years) |
| High-voltage skills bottleneck | -0.9% | North America core; EU field service markets; Gulf and ASEAN buildout zones | Long term (≥ 4 years) |
| Leak monitoring compliance burden | -0.7% | California; EU compliance jurisdictions; dense urban substations | Short term (≤ 2 years) |
| Recycled gas servicing gap | -0.8% | EU installed-base markets; mature transmission networks | Medium term (2-4 years) |
| Electrification-driven specification churn | -1.0% | U.S. utility programs; European grid upgrades; fast-growth Asian metros | Medium term (2-4 years) |
Geopolitical Impact Analysis
Rising trade protection measures and supply chain disruptions are increasing cost pressure across the Gas Insulated Switchgear (GIS) market. GIS manufacturing relies heavily on copper, aluminum, and steel, which are essential for structural components and electrical conductivity. Under Section 232 of the U.S. Trade Expansion Act, the United States imposed 50% tariffs on imported steel and aluminum from June 2025. In addition, derivative electrical grid equipment is subject to a 15% tariff through 2027, after which the rate will increase to 25%. These measures have raised manufacturing costs for GIS suppliers serving the U.S. market. At the same time, LME copper spot prices increased by around 42% year-over-year by May 2026, rising from USD 9,533/mt to USD 13,543/mt, driven by strong electrification demand and supply uncertainty. This increase in raw material costs is reducing profit margins and extending procurement timelines for GIS manufacturers.
Global logistics challenges have further disrupted the market. Continued security issues in the Red Sea forced many cargo vessels to avoid the Bab el-Mandeb Strait and reroute around the Cape of Good Hope, adding approximately 10–15 days to Asia-Europe shipping routes while increasing freight and insurance costs during 2024–2025. According to OEC trade data, China accounted for 34.1% of global electrical transformer exports in 2024, highlighting the industry’s dependence on Asian manufacturing. As a result, project deliveries for European and Middle Eastern power utilities have been delayed. To reduce future supply risks, utilities are increasing inventory buffers by 10–15%, while governments are promoting domestic GIS manufacturing to strengthen supply chain resilience and reduce dependence on a single trade corridor.
Regional Analysis
Asia Pacific Held the Largest Share of the Global Gas Insulated Switchgear Market.
In 2025, Asia-Pacific held a dominant market position, capturing more than a 42% share of the global Gas Insulated Switchgear market, valued at approximately $12.5 billion. The region’s commanding presence is rooted in the sheer scale of power infrastructure expansion underway across China, India, Japan, and Southeast Asian economies, where rapid urbanization, industrial growth, and renewable energy integration have collectively driven unprecedented transmission grid investment.
According to the International Energy Agency, May 2025, Asia-Pacific economies accounted for the largest share of global electricity network investment in 2024, with China alone committing record capital toward ultra-high voltage transmission corridor expansion and urban substation modernization programs requiring compact GIS installations. India has similarly accelerated grid development through its national transmission programs. The U.S. Energy Information Administration, March 2026, noted that electricity consumption across Asian economies continued rising through 2024 and 2025, reinforcing utility demand for reliable high-voltage switchgear across both greenfield and brownfield substation projects throughout the region.
North America represents the market’s most dynamically growing regional segment, driven primarily by federally backed grid modernization commitments and surging renewable energy interconnection demand. According to the U.S. Department of Energy, August 2025, transmission infrastructure investment across the United States reached elevated levels through 2024 and 2025 under the Infrastructure Investment and Jobs Act, with new and rehabilitated substations across congested grid corridors increasingly specifying GIS equipment for its compact footprint and operational reliability advantages over conventional air-insulated alternatives in space-constrained urban and suburban environments.
Key Regions and Countries Covered
- North America
- The US
- Canada
- Europe
- Germany
- France
- The UK
- Spain
- Italy
- Russia & CIS
- Rest of Europe
- APAC
- China
- Japan
- South Korea
- India
- ASEAN
- Rest of APAC
- Latin America
- Brazil
- Mexico
- Rest of Latin America
- Middle East & Africa
- GCC
- South Africa
- Rest of MEA
Key Players Analysis
Gas Insulated Switchgear manufacturers focus on strengthening technological differentiation, production scale efficiency, and supply chain integration to maintain competitiveness in an increasingly demanding global market. A key priority is continuous innovation in insulation technology, particularly the development of SF6-free alternatives using clean air, nitrogen, and fluoronitrile-based gas mixtures that meet tightening environmental regulations without compromising dielectric performance or operational reliability. Companies further invest heavily in digital monitoring and smart grid compatibility, embedding sensors and IoT-enabled diagnostic systems within GIS units to support predictive maintenance and reduce lifecycle operating costs for utility customers.
Vertical integration with specialized component suppliers and engineering procurement construction partners helps secure supply chain stability and improve cost management amid rising raw material and logistics pressures. Strategic capacity expansion, particularly across Asia-Pacific manufacturing hubs, enables alignment with concentrated demand from national grid operators and renewable energy interconnection programs driving large-volume switchgear procurement.
The Major Players In The Industry
- ABB Ltd.
- Siemens AG
- General Electric Company
- Schneider Electric SE
- Eaton Corporation plc
- Hitachi Energy Ltd.
- Mitsubishi Electric Corporation
- Toshiba Corporation
- Fuji Electric Co., Ltd.
- Hyundai Electric & Energy Systems Co., Ltd.
- Hyosung Heavy Industries Corporation
- CG Power and Industrial Solutions Ltd.
- LS Electric Co., Ltd.
- Larsen & Toubro Limited
- CHINT Group Corporation
- Others
Key Development
- In May 2025, Hitachi Energy Ltd. announced delivery of the world’s first SF6-free 550 kV GIS to State Grid Corporation of China’s Central China Branch, using EconiQ technology to cut CO2-equivalent emissions by 99% versus conventional SF6 equipment.
- In November 2025, Schneider Electric SE unveiled GM AirSeT, an SF6-free primary gas-insulated switchgear insulated with pure air, at ENLIT Europe 2025 in Bilbao, expanding its clean-insulation portfolio into primary GIS applications for utilities and grid operators.
Report Scope
| Report Features | Description |
|---|---|
| Market Value (2025) | USD 29.7 Bn |
| Forecast Revenue (2035) | USD 59.9 Bn |
| CAGR (2026-2035) | 7.3% |
| Base Year for Estimation | 2025 |
| Historic Period | 2020-2024 |
| Forecast Period | 2026-2035 |
| Report Coverage | Revenue Forecast, Market Dynamics, Competitive Landscape, Recent Developments |
| Segments Covered | By Installation (Outdoor and Indoor), By Type (Coated Separator and Non-coated Separator By Insulation Type (SF6 and SF6-free), By End User (Electrical Utilities, Industrial, Commercial & Institutional, Data Centers, Others ), By Voltage Rating (Above 220 kV, 74-220 kV, 40.6-73 kV, 28-40.5 kV, 16-27 kV, 6-15 kV and Up to 5 kV ), By Application (Power Transmission & Distribution, Industrial, Infrastructure, Power Generation, Others ) |
| Regional Analysis | North America – The US & Canada; Europe – Germany, France, The UK, Spain, Italy, Russia & CIS, Rest of Europe; APAC– China, Japan, South Korea, India, ASEAN & Rest of APAC; Latin America– Brazil, Mexico & Rest of Latin America; Middle East & Africa– GCC, South Africa, & Rest of MEA |
| Competitive Landscape | ABB Ltd., Siemens AG, General Electric Company, Schneider Electric SE, Eaton Corporation plc, Hitachi Energy Ltd., Mitsubishi Electric Corporation, Toshiba Corporation, Fuji Electric Co., Ltd., Hyundai Electric & Energy Systems, Hyosung Heavy Industries Corporat, CG Power and Industrial Solutions L, LS Electric Co., Ltd., Larsen & Toubro Limited, CHINT Group Corporation, Others |
| Customization Scope | Customization for segments, region/country-level will be provided. Moreover, additional customization can be done based on the requirements. |
| Purchase Options | We have three licenses to opt for: Single User License, Multi-User License (Up to 5 Users), Corporate Use License (Unlimited Users and Printable PDF) |





































