


Report Overview
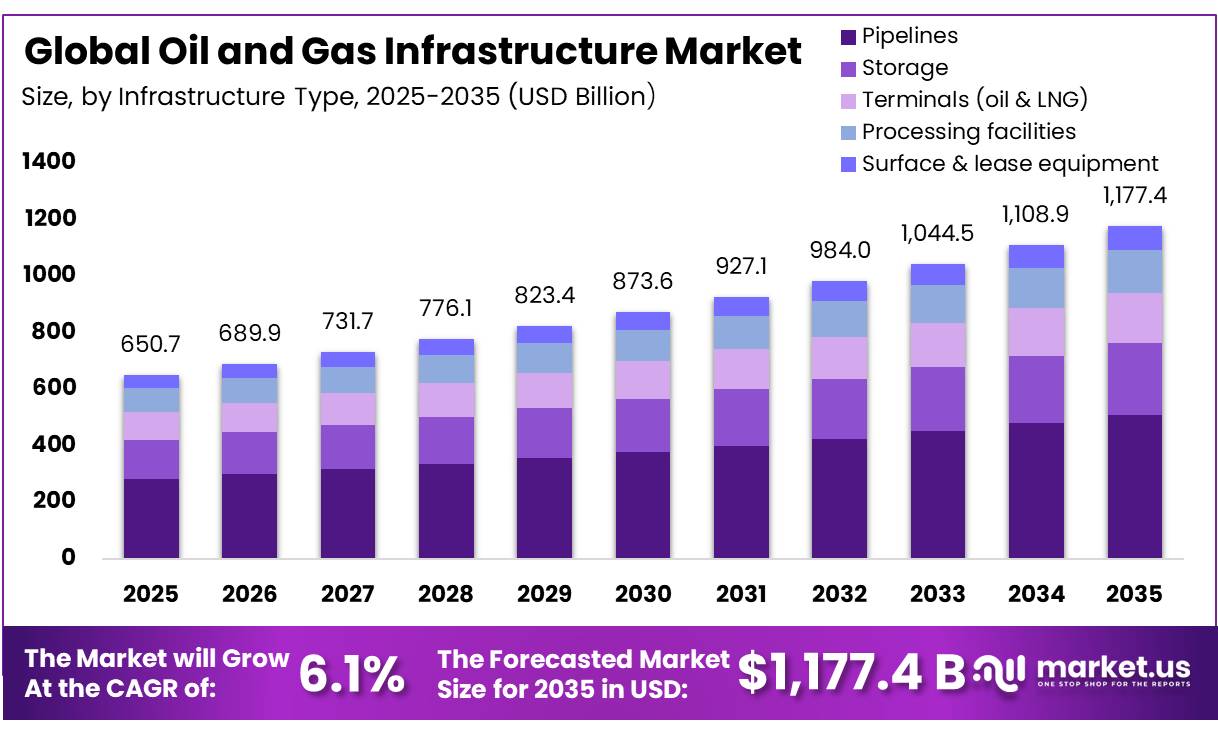
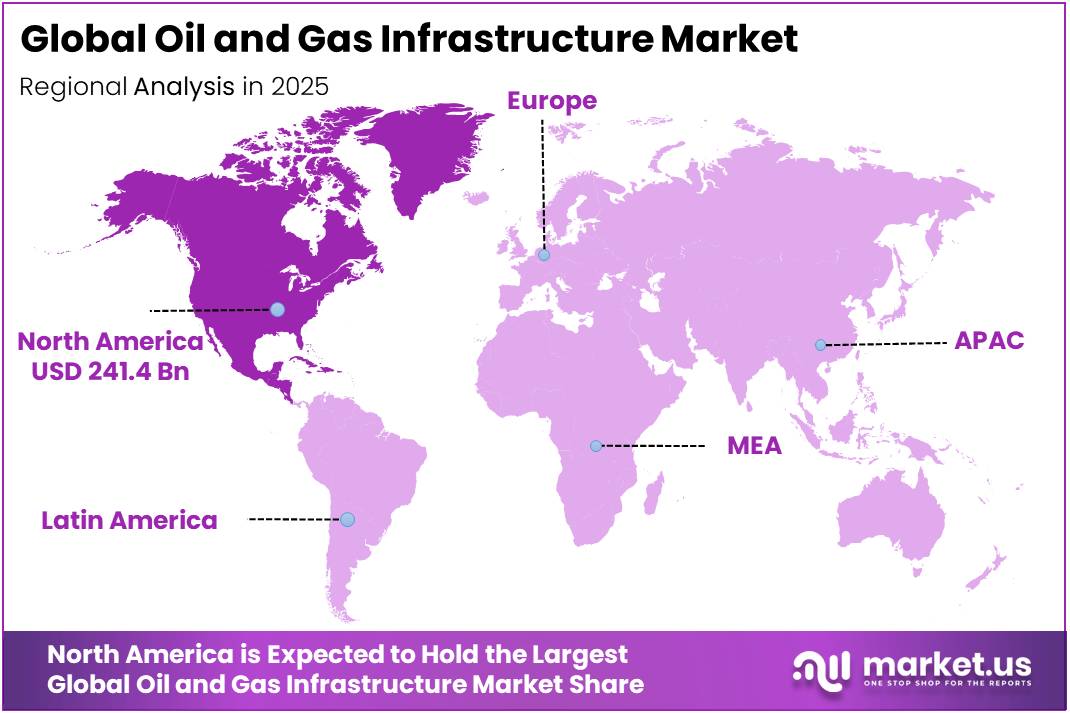
In 2025, the Global Oil and Gas Infrastructure Market was valued at USD 650.7 billion, and between 2026 and 2035, this market is estimated to register a CAGR of 6.1%, reaching about USD 1,177.4 billion by 2035. In 2025, North America led the market, achieving over 37.1% share with a revenue of USD 241.4 Billion.
Oil and gas infrastructure forms the backbone of energy supply, covering gathering systems, processing plants, transmission pipelines, storage terminals, refineries, LNG facilities and export networks. The sector remains essential because petroleum and natural gas continue to support transport, petrochemicals, industrial heat and power generation.
- In 2025, the International Energy Agency estimated that global upstream oil and gas investment would reach just under USD 570 billion, although this represented a decline of about 4%. Around 40% of that spending was directed toward limiting production declines at existing fields, showing that maintenance, brownfield expansion and asset integrity remain as important as new development.
Key Takeaways
- The Global Oil and Gas Infrastructure Market was valued at USD 650.7 billion in 2025.
- The global market is projected to grow at a CAGR of 6.1% and is estimated to reach USD 1,177.4 billion by 2035.
- On the basis of infrastructure type, Pipelines dominated the market, constituting 43.2% of the total market share.
- Based on the location, Onshore dominated the market, with a substantial market share of around 77.8%.
- Based on the operation, Distribution led the market, comprising 38.1% of the total market.
- On the basis of product, Natural gas dominated the market, constituting 40.1% of the total market share.
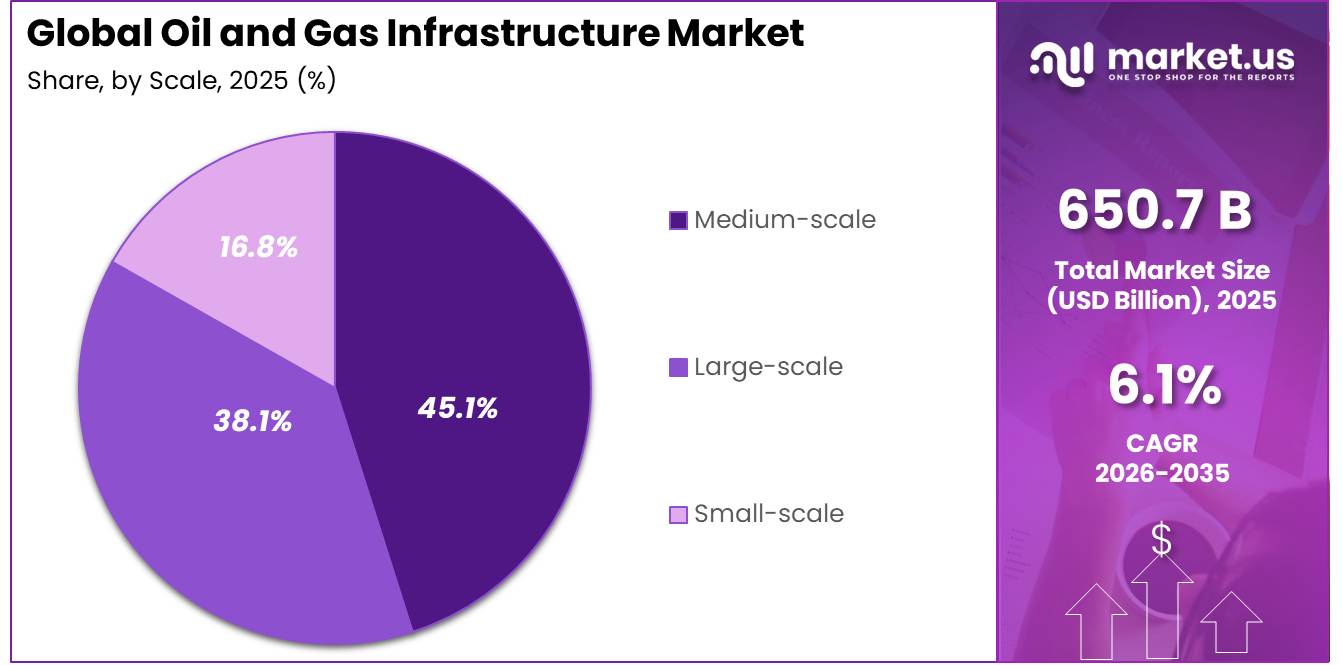
- Based on the scale, Medium-scale dominated the market, with a substantial market share of around 45.1.
- In 2025, North America was the most dominant region in the market, accounting for 37.1% of the total global consumption.
The industrial scenario is increasingly shaped by changing trade routes, LNG expansion and regional supply-security priorities. The IEA reported that spending on new LNG facilities was rising, with projects in the United States, Qatar, Canada and other producing regions expected to support some of the largest annual LNG capacity additions during 2026–2028.
- In the United States, natural gas pipeline projects completed in 2025 added approximately 6.3 billion cubic feet per day of capacity. About 85%, or 5.3 billion cubic feet per day, was designed to serve the South Central region, where Gulf Coast LNG demand is concentrated.
Growth is being driven by energy security, replacement of aging assets, expanding gas-fired power demand, petrochemical feedstock requirements and the need to connect production basins with consumption and export centers.
- According to the IEA, the region was set to invest around USD 130 billion in oil and gas supply during 2025, equal to nearly 15% of the global total. Saudi Arabia alone was expected to invest about USD 40 billion in upstream oil and gas activities.
The U.S. Pipeline and Hazardous Materials Safety Administration’s Natural Gas Distribution Infrastructure Safety and Modernization program provides USD 200 million annually. Future investment will also focus on methane reduction, carbon capture connections, hydrogen-ready pipelines and gas-flaring recovery systems. The World Bank reported that global gas flaring reached 167 billion cubic meters in 2025, wasting an estimated USD 54 billion in energy. This creates a significant opportunity for gas gathering, compression, processing and reinjection infrastructure. Although slower oil-demand growth may limit some greenfield projects, long-term opportunities remain in LNG terminals, storage capacity, pipeline refurbishment, offshore tiebacks and lower-emission asset upgrades.
Infrastructure Type Analysis
Pipelines dominate with a 43.2% share, supported by extensive oil and gas transportation networks.
In 2025, Pipelines held a dominant market position, capturing more than a 43.2% share of the Oil and Gas Infrastructure Market. The segment remained important because pipelines provide a reliable and cost-effective way to transport crude oil, refined petroleum products and natural gas over long distances. Their ability to move large volumes continuously also reduces dependence on road and rail transportation.
- According to the U.S. Pipeline and Hazardous Materials Safety Administration, the United States had 413,330 miles of natural gas transmission and gathering pipelines in 2025. These extensive networks demonstrate the continued importance of pipelines in connecting production areas, processing facilities, storage terminals and major consumption centers.
Storage is the fastest-growing segment in the Oil and Gas Infrastructure Market. Its growth is supported by the need to manage seasonal demand, maintain emergency fuel reserves and balance fluctuations in oil and natural gas production. Storage facilities also help operators maintain continuous supply when pipelines, processing plants or export terminals face disruptions. These additions indicate continued investment in storage infrastructure as energy suppliers improve system reliability, manage peak consumption periods and support growing natural gas trading and export activities.
- In May 2026, the U.S. Energy Information Administration reported that underground natural gas demonstrated peak storage capacity increased by 0.1%, or 6 billion cubic feet, during 2025. Working gas design capacity also increased by 6%, or 26 billion cubic feet.
Location Analysis
Onshore dominates with a 77.8% share, supported by strong land-based production and established infrastructure.
In 2025, Onshore held a dominant market position, capturing more than a 77.8% share of the Oil and Gas Infrastructure Market by location. The segment remained ahead because most oil and gas fields, gathering systems, processing facilities, storage terminals and pipeline networks are located on land. Lower construction costs, easier maintenance and faster access to production sites also supported the segment’s leading position.
- According to the U.S. Energy Information Administration in March 2026, the Lower 48 states, excluding the Federal Gulf of America, produced 11.3 million barrels of crude oil per day in 2025, representing 83% of total U.S. output. The Permian Basin alone supplied 6.6 million barrels per day, showing the scale of infrastructure required for drilling, transportation, processing and storage across onshore regions.
Offshore is the fastest growing segment in the Oil and Gas Infrastructure Market by location. Growth is being supported by new deepwater projects, subsea production systems and investments in offshore platforms and pipelines.
- In April 2026, the Bureau of Ocean Energy Management reported that U.S. Outer Continental Shelf oil production exceeded 714 million barrels during 2025. Offshore development is expected to expand steadily as operators target large reserves and use advanced floating platforms, subsea equipment and remote monitoring systems to improve production from deepwater fields.
Operation Analysis
Distribution dominates with a 38.1% share, supported by its extensive pipeline network and direct customer connections.
In 2025, Distribution held a dominant market position, capturing more than a 38.1% share. The segment remained important because distribution systems form the final link between large transmission pipelines and residential, commercial, and industrial consumers. According to the U.S. Pipeline and Hazardous Materials Safety Administration, the country operated 2,397,861 miles of natural gas distribution mains and estimated service pipelines in 2025.
This included 1,394,002 miles of distribution mains and 1,003,859 miles of service pipelines. The network also supported 73,134,485 customer service connections, showing the large infrastructure required to deliver gas safely and reliably to end users. Continuous replacement of older pipelines, installation of modern metering systems, and expansion of urban gas networks further supported the segment’s leading position.
Transmission is the fastest growing segment. Its growth is supported by rising demand for long-distance movement of natural gas from production fields, processing facilities, storage sites, LNG terminals, and regional distribution networks. In 2025, the United States had 300,161 miles of natural gas transmission pipelines, including 297,310 onshore miles and 2,851 offshore miles. Increasing gas-fired power generation, LNG export activity, and the need to connect new production areas with major consumption centres are encouraging investment in transmission capacity.
Product Analysis
Natural Gas dominates the product segment with more than a 40.1% share, supported by expanding pipeline and LNG infrastructure.
In 2025, Natural Gas held a dominant market position, capturing more than a 40.1% share of the Oil and Gas Infrastructure Market. Its leading position was supported by strong demand for gas pipelines, processing plants, storage systems, compressor stations and LNG terminals. Natural gas remained widely used for electricity generation, industrial heating and residential energy needs, encouraging operators to expand transportation and distribution networks. According to the U.S. Energy Information Administration, natural gas pipeline projects completed in 2025 added approximately 6.3 billion cubic feet per day of transportation capacity.
Crude Oil is the fastest growing segment in the Oil and Gas Infrastructure Market. Its growth is supported by new upstream projects, refinery expansion and the modernization of pipelines, storage terminals and export facilities. Producers are investing in infrastructure that can safely move crude oil from production fields to refineries and international shipping terminals. Growing energy requirements, particularly across developing industrial regions, are also creating demand for larger storage capacity and more efficient transportation networks.
Scale Analysis
Medium-scale infrastructure leads with a 45.1% share due to flexible capacity and lower project complexity.
In 2025, medium-scale held a dominant market position, capturing more than a 45.1% share. The segment benefited from its ability to balance operating capacity, investment requirements, construction time, and regional demand. Medium-scale pipelines, storage sites, processing units, and distribution facilities are widely used to connect producing fields with nearby industrial users, power plants, and export infrastructure. These projects are generally easier to finance and expand than large integrated developments, while offering greater capacity than small local systems.
Large-scale is the fastest-growing segment in the oil and gas infrastructure market. Its growth is supported by rising investment in LNG terminals, cross-regional pipelines, export facilities, large storage terminals, and integrated processing complexes. These projects are designed to transport and handle high volumes of crude oil and natural gas across long distances. Energy security concerns and growing demand from power generation, industrial production, and international trade are encouraging governments and operators to develop larger and more connected infrastructure systems.
Key Market Segments
By Infrastructure Type
- Pipelines
- Storage
- Terminals (oil & LNG)
- Processing facilities
- Surface & lease equipment
By Location
- Onshore
- Offshore
By Operation
- Distribution
- Transmission
- Gathering
By Product
- Natural gas
- Crude oil
- Refined products & NGL
- LNG (export/import)
By Scale
- Medium-scale
- Large-scale
- Small-scale
Driver Analysis
LNG Export Terminal Ramp-Up and Feedgas Pipeline Build-Out
The U.S. Energy Information Administration projects LNG exports will climb to an average of 17.0 Bcf/d in 2026, a 1.9 Bcf/d year-over-year increase, before reaching 18.6 Bcf/d in 2027, driven by the phased start-up of Corpus Christi Stage 3 trains 5-7 (0.6 Bcf/d), Golden Pass LNG’s first two trains (1.4 Bcf/d), and subsequent Port Arthur Phase 1 (1.6 Bcf/d) and Rio Grande LNG trains (1.4 Bcf/d) commissioning through 2027.
As of December 2025, total operating U.S. LNG capacity stood at 18 Bcf/d (136.5 MTPA), with an additional 15 Bcf/d under construction and 13.3 Bcf/d already permitted but not yet begun, indicating a structural pipeline of committed capital expenditure extending through 2031. The Department of Energy has issued 44 long-term export authorizations totaling 56.3 Bcf/d as of March 2026, with facilities such as Plaquemines and Elba Island receiving incremental permitted-export increases of 0.5 Bcf/d and 0.1 Bcf/d respectively in March-April 2026.
This build-out fundamentally shifts infrastructure unit economics from domestic pipeline-only transmission tariffs toward liquefaction-linked take-or-pay contracts, compelling midstream operators to underwrite feedgas pipeline capacity years ahead of terminal completion, exemplified by the 4.5 Bcf/d Rio Bravo Pipeline built explicitly to supply Rio Grande LNG and the 2.5 Bcf/d Blackcomb Pipeline entering service in Q3 2026 to relieve Permian bottlenecks. With export facilities running near full utilization and March 2026 exports hitting a near-record 17.9 Bcf/d monthly average, capacity constraints are directly incentivizing accelerated capital deployment into liquefaction-adjacent pipeline assets rather than legacy interstate transmission.
Drivers Impact Analysis
| Driver | (~) % Impact on CAGR Forecast | Geographic Relevance | Impact Timeline |
|---|---|---|---|
| LNG export terminal ramp-up and feedgas pipeline build-out | +2.2% | US Gulf Coast core, APAC/EU import corridors | Short term (≤2 years) |
| Permian-to-Gulf Coast takeaway pipeline expansion | +1.6% | North America core (Texas, Louisiana) | Short term (≤2 years) |
| Federal methane rule recalibration and compliance deregulation | +1.1% | US core, indirect EU/APAC ESG spill-over | Medium term (2-4 years) |
| India National Gas Grid and City Gas Distribution mandate | +1.4% | APAC (India) core, South Asia spill-over | Medium term (2-4 years) |
| 45Q carbon capture credit escalation and EOR economics | +0.7% | North America core, Gulf Coast/Permian | Long term (≥4 years) |
| PHMSA pipeline integrity and aging-asset safety mandates | -0.5% | North America core | Medium term (2-4 years) |
Restraint Analysis
Section 232 Steel and Aluminum Tariffs
The root cause of this restraint traces to the June 2025 presidential proclamation that doubled Section 232 tariffs on steel and aluminum imports from 25% to 50% ad valorem for nearly all trading partners except the United Kingdom, which retained a 25% rate; because line pipe, valves, fittings, and derivative steel articles used in gathering, transmission, and storage infrastructure fall squarely within the expanded HTSUS derivative categories, EPC contractors sourcing non-domestically-melted steel face an immediate and structural cost escalation on bill-of-materials line items that typically represent 25-35% of total pipeline project capital cost.
Quantitatively, with the BLS Steel Mill Products PPI (WPU1017) already registering 308.1 in mid-2025 and posting a further 2.1% month-on-month gain by May 2026, compounding tariff pass-through with base commodity inflation, project sponsors are absorbing an estimated 8-14% increase in delivered pipe costs versus pre-tariff baselines, a burden that flows directly into margin compression for midstream operators locked into fixed-price EPC contracts signed before the tariff escalation, forcing many to renegotiate contingency reserves upward by 300-500 basis points and, in several documented cases, delay final investment decisions by two to three quarters while sourcing strategies pivot toward domestically melted-and-poured steel exempted under the 0% duty carve-out.
Restraint Impact Analysis
| Restraint | (~) % Impact on CAGR Forecast | Geographic Relevance | Impact Timeline |
|---|---|---|---|
| Section 232 Steel/Aluminum Tariffs (50% ad valorem) | -1.6% | North America core (US midstream, Canadian pipe exporters) | Short term (≤2 years) |
| FERC/NEPA Permitting Backlog & Litigation Risk | -1.2% | North America core, EU cross-border corridors | Medium term (2-4 years) |
| Skilled Construction Labor Shortage | -0.9% | North America core, EU | Short term (≤2 years) |
| Elevated Interest Rates & CapEx Financing Costs | -1.1% | Global, most acute in North America and EU | Short term (≤2 years) |
| PHMSA Safety & Methane Compliance Mandates | -0.7% | North America core | Long term (≥4 years) |
| Input Commodity Price Volatility (steel, diesel) | -0.8% | Global, APAC fabrication corridors, North America | Medium term (2-4 years) |
Opportunity Analysis
Rural & Peri-Urban City Gas Distribution (CGD) White Space
India’s PNGRB has authorized City Gas Distribution entities across 307 Geographical Areas achieving 100% mainland coverage in principle, yet as of March 2026 only 250 of these GAs are actually connected to the national gas trunk pipeline, with 37 GAs and 44 districts still explicitly identified as unconnected a residual white space the current National PNG Drive 2.0 is only beginning to address, having added 6.5 lakh new domestic PNG infrastructure connections and connected 11 new GAs in a single quarter; because the baseline forecast already embeds the announced Drive targets, the incremental opportunity lies specifically in accelerating the remaining unconnected GAs and underserved commercial/industrial micro-clusters ahead of schedule, where average connection density is estimated at under 40% of authorized potential versus over 75% in metro GAs, implying a residual serviceable addressable market of several million uncaptured domestic and commercial connections; first-movers securing spur-line rights in these lagging GAs could realize customer acquisition costs 25-30% lower than metro markets due to reduced competitive bidding intensity, alongside a structurally higher blended margin from bundled CNG station rollouts using the 32,667 km common-carrier NGPL network already authorized to 14 entities.
Opportunity Impact Analysis
| Opportunity | (~) % Potential CAGR Upside | Geographic Relevance | Execution Window |
|---|---|---|---|
| CO2 Transport Pipeline Repurposing & CCUS Corridors | +2.8% | US Gulf Coast (Texas, Louisiana), EU industrial clusters | Medium term (2-4 years) |
| Hydrogen-Ready Pipeline Conversion & Blending Services | +2.2% | EU (Germany, Netherlands, Austria, Slovakia), US Appalachian/Gulf hubs | Medium term (2-4 years) |
| Rural & Peri-Urban City Gas Distribution (CGD) White Space | +1.9% | India (uncovered GAs, tier-2/3 districts) | Short term (≤2 years) |
| Data Center-Linked Gas-to-Power Infrastructure Monetization | +3.1% | US Texas, PJM/Mid-Atlantic corridor | Short term (≤2 years) |
| Midstream M&A Roll-ups of Fragmented Small-Cap Pipeline Assets | +1.6% | US Permian/Appalachian basins, EU secondary networks | Long term (≥4 years) |
| Cross-Border Interconnector & LNG Feedgas Capacity Monetization | +2.4% | EU-Iberian corridor, US Gulf Coast export terminals | Medium term (2-4 years) |
Challenges Analysis
Aging Pipeline Replacement Burden
The systemic vulnerability is embedded in the vintage composition of U.S. gas infrastructure: PHMSA’s By-Decade Inventory confirms that roughly 30% of gas distribution mains predate 1970, and while cast/wrought iron main mileage has fallen 38% since 2005, total distribution main and estimated service mileage still grew to 2,395,772 miles in 2025 from 2,284,732 miles in 2020, meaning replacement work is layered onto an expanding, not shrinking, base; this creates a persistent capital allocation conflict as operators must simultaneously fund new-build capacity for record LNG feedgas demand and multi-decade replacement programs for legacy bare-steel and cast-iron segments, with nineteen states having only recently achieved full cast/wrought-iron elimination after programs spanning 10-15+ years; the quantitative drag appears as elevated integrity-management capital expenditure, inspection backlogs, and incident-rate volatility that PHMSA’s national performance measures track as an upward trend in significant incidents since Distribution Integrity Management Program rules took effect; the long-term corporate adjustment involves prioritized risk-ranked replacement scheduling, accelerated plastic-pipe conversion, and blending regulatory-mandated capex into rate-base recovery mechanisms to avoid diverting capital from expansion projects.
Challenges Impact Analysis
| Challenge | (~) % CAGR Friction Drag | Geographic Relevance | Mitigation Horizon |
|---|---|---|---|
| Skilled labor and technician attrition | -1.2% | Permian Basin, Eagle Ford, Gulf Coast fabrication yards | Long term (≥4 years) |
| Steel and metals tariff cost inflation | -0.9% | US import-dependent pipeline/terminal builders | Medium term (2-4 years) |
| Aging pipeline replacement burden | -0.7% | Northeast/Midwest legacy cast-iron distribution zones | Long term (≥4 years) |
| Interstate permitting and certificate delays | -0.8% | FERC-jurisdictional corridors, Appalachia-to-Northeast routes | Medium term (2-4 years) |
| LNG terminal construction bottlenecks | -0.6% | Gulf Coast LNG corridor (Louisiana, Texas) | Medium term (2-4 years) |
| Workforce safety and incident-driven compliance costs | -0.5% | Nationwide, concentrated in gathering/transmission segments | Short term (≤2 years) |
Geopolitical Impact Analysis
War-Driven Supply Risks Reshape Oil and Gas Infrastructure
The Middle East conflict and Russia-Ukraine war are placing oil and gas infrastructure under pressure. Attacks, blockades and security risks around pipelines, refineries, terminals and shipping routes have increased costs and delayed deliveries. The Strait of Hormuz remains the concern because it normally carries 20 million barrels of oil per day and almost 20% of global LNG supply. Disrupted tanker movements have forced Gulf producers to reduce output, while LNG shortages have pushed buyers in Europe and Asia to compete for cargoes.
The Red Sea and Suez route remain exposed to attacks, encouraging vessels to travel around the Cape of Good Hope. Longer journeys raise freight, insurance, fuel and maintenance expenses, while reducing tanker availability. At the same time, strikes on Russian refineries, pipelines and Black Sea facilities continue to create uncertainty for crude oil and refined-product supplies.
These conditions are encouraging governments and energy companies to invest in storage terminals, alternative pipelines, LNG import facilities, cybersecurity and route diversification. North American, African and Mediterranean infrastructure projects may gain demand as buyers seek safer supply sources. However, equipment costs, project financing and construction risks are expected to remain elevated until tensions ease.
Regional Analysis
North America Dominates the Oil and Gas Infrastructure Market.
North America was established as the dominant region in 2025, accounting for 37.1% of the total market and generating revenue of US$241.4 billion. This leadership is anchored in the region’s extensive pipeline and storage infrastructure, its position as a leading producer and exporter of crude oil and natural gas, and continued investment in gas-processing and LNG terminal capacity along the U.S. Gulf Coast and Canadian energy corridors. Regulatory support for pipeline expansion, coupled with sustained upstream activity across major shale basins, has reinforced the region’s infrastructure investment base and its role as the largest revenue contributor to the global market.
Asia Pacific was identified as the fastest-growing region in the market. Growth is being propelled by rising energy consumption across China, India, and Southeast Asia, expanding LNG import and regasification infrastructure, and government-backed investment in pipeline connectivity to secure long-term energy supply. Rapid industrialization and urbanization across the region are driving demand for new storage terminals and distribution networks, while several economies are prioritizing infrastructure upgrades to reduce reliance on spot-market gas purchases and strengthen energy security amid volatile global commodity pricing.
Key Regions and Countries Covered
- North America
- The US
- Canada
- Europe
- Germany
- France
- The UK
- Spain
- Italy
- Russia and CIS
- Rest of Europe
- APAC
- China
- Japan
- South Korea
- India
- ASEAN
- Rest of APAC
- Latin America
- Brazil
- Mexico
- Rest of Latin America
- Middle East and Africa
- GCC
- South Africa
- Rest of MEA
Key Players Analysis
Pembina Pipeline Corporation operates an integrated network of pipelines, storage terminals, gas-processing facilities and export infrastructure across North America. Its pipeline division manages approximately 18,000 kilometres of pipelines, transportation capacity of 3.0 million barrels of oil equivalent per day and above-ground storage capacity of 10 million barrels. In 2025, Pembina generated CAD 7.78 billion in revenue, CAD 1.69 billion in earnings and CAD 4.29 billion in adjusted EBITDA, strengthening its position in energy transportation and processing infrastructure.
DCP Midstream operates as an important part of Phillips 66’s integrated midstream business after Phillips 66 acquired full ownership of the partnership in 2023. Its infrastructure gathers, processes, stores and transports natural gas and natural gas liquids across major U.S. production regions. Phillips 66’s wider midstream portfolio includes more than 70,000 miles of pipeline systems, over 5.0 billion cubic feet per day of net gas-processing capacity and 11 NGL fractionation plants. Fourth-quarter 2025 NGL pipeline throughput surpassed 1 million barrels per day, a company record.
National Oilwell Varco, currently operating as NOV Inc., supplies drilling systems, production equipment, subsea technologies, tubular products and aftermarket services used across oil and gas infrastructure projects. In 2025, NOV recorded USD 8.74 billion in revenue, USD 145 million in net income and USD 1.03 billion in adjusted EBITDA. Its operating cash flow reached USD 1.25 billion, while year-end equipment backlog stood at USD 4.34 billion. The company’s broadband drilling technology supported more than 750,000 feet of drilling during the year.
MRC Global Inc. distributes pipes, valves, fittings and related infrastructure products to gas utilities, transmission pipelines, upstream operators, refineries and industrial customers. The company operates through a worldwide network of approximately 200 locations, including engineering and valve centres. During the first nine months of 2025, MRC Global generated USD 2.19 billion in sales. Gas utilities contributed USD 864 million, while production, transmission and infrastructure activities generated USD 682 million. Its revenue backlog reached USD 571 million in the third quarter of 2025.
The Major Players in The Industry
- Enbridge Inc.
- Kinder Morgan, Inc.
- TC Energy Corporation
- Williams Companies, Inc.
- Energy Transfer LP
- ONEOK, Inc.
- Pembina Pipeline Corporation
- Plains All American Pipeline, L.P.
- DCP Midstream, LP
- Gazprom
- National Oilwell Varco
- MRC Global Inc.
- Nippon Steel Corporation
- Tenaris S.A.
- General Electric
- Others
Key Development
- In June 2025, Enbridge completed the acquisition of a 10% interest in the Matterhorn Express Pipeline for approximately US$300 million. The operating pipeline can transport around 2.5 billion cubic feet of natural gas per day from the Permian Basin toward the U.S. Gulf Coast.
- In February 2025, Kinder Morgan, Inc. completed the $640 million acquisition of Outrigger Energy II’s natural gas gathering and processing assets in North Dakota. The deal added a 270 MMcf/d processing facility and a 104-mile gathering pipeline with 350 MMcf/d capacity, strengthening the company’s position in the Bakken region.
Report Scope
| Report Features | Description |
|---|---|
| Market Value (2025) | USD 650.7 Bn |
| Forecast Revenue (2035) | USD 1,177.4 Bn |
| CAGR (2026-2035) | 6.1% |
| Base Year for Estimation | 2025 |
| Historic Period | 2020-2024 |
| Forecast Period | 2026-2035 |
| Report Coverage | Revenue Forecast, Market Dynamics, Competitive Landscape, Recent Developments |
| Segments Covered | By Infrastructure Type (Pipelines, Storage, Terminals (oil & LNG), Processing facilities, and Surface & lease equipment), By Location (Onshore and Offshore), By Operation (Distribution, Transmission, and Gathering), By Product (Natural gas, Crude oil, Refined products & NGL, and LNG (export/import)), By Scale (Medium-scale, Large-scale, and Small-scale) |
| Regional Analysis | North America – The US and Canada; Europe – Germany, France, The UK, Spain, Italy, Russia and CIS, Rest of Europe; APAC– China, Japan, South Korea, India, ASEAN and Rest of APAC; Latin America– Brazil, Mexico and Rest of Latin America; Middle East and Africa– GCC, South Africa, and Rest of MEA |
| Competitive Landscape | Enbridge Inc., Kinder Morgan, Inc., TC Energy Corporation, Williams Companies, Inc., Energy Transfer LP, ONEOK, Inc., Pembina Pipeline Corporation, Plains All American Pipeline, L.P., DCP Midstream, LP, Gazprom, National Oilwell Varco, MRC Global Inc., Nippon Steel Corporation, Tenaris S.A., General Electric, Others. |
| Customization Scope | Customization for segments, region/country-level will be provided. Moreover, additional customization can be done based on the requirements. |
| Purchase Options | We have three licenses to opt for: Single User License, Multi-User License (Up to 5 Users), Corporate Use License (Unlimited Users and Printable PDF) |





































