


Report Overview
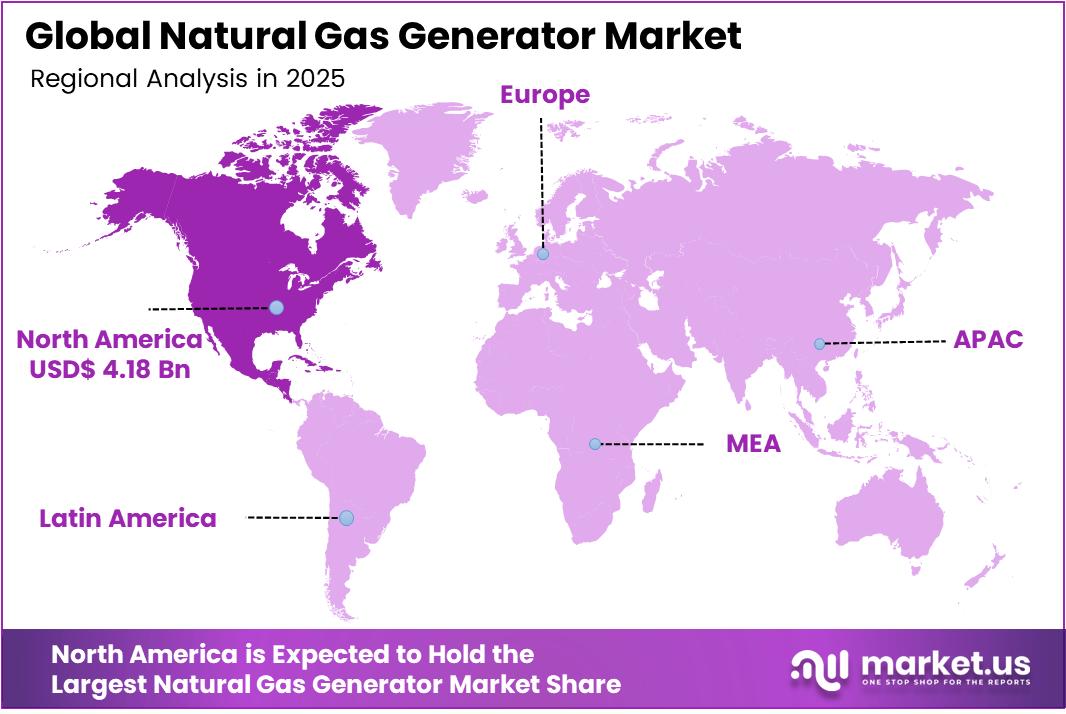
The Global Natural Gas Generator Market was valued at US$ 12.9 billion in 2025, and between 2026 and 2035, this market is estimated to register a CAGR of 10.9%, reaching about US$ 32.7 billion by 2035. North America held a dominant Market position, capturing more than a 32.40% share, holding USD 4.18 billion in revenue.
The natural gas generator market is vital in the global distributed power generation sector, providing reliable electricity across various sectors. Their use for standby, prime, and peak-shaving power is rising due to lower emissions and better efficiency compared to diesel systems. Demand is driven by concerns over grid instability, frequent outages, urbanization, and industrial growth, alongside increasing investments in data centers, healthcare, telecom, and manufacturing for uninterrupted power supply.
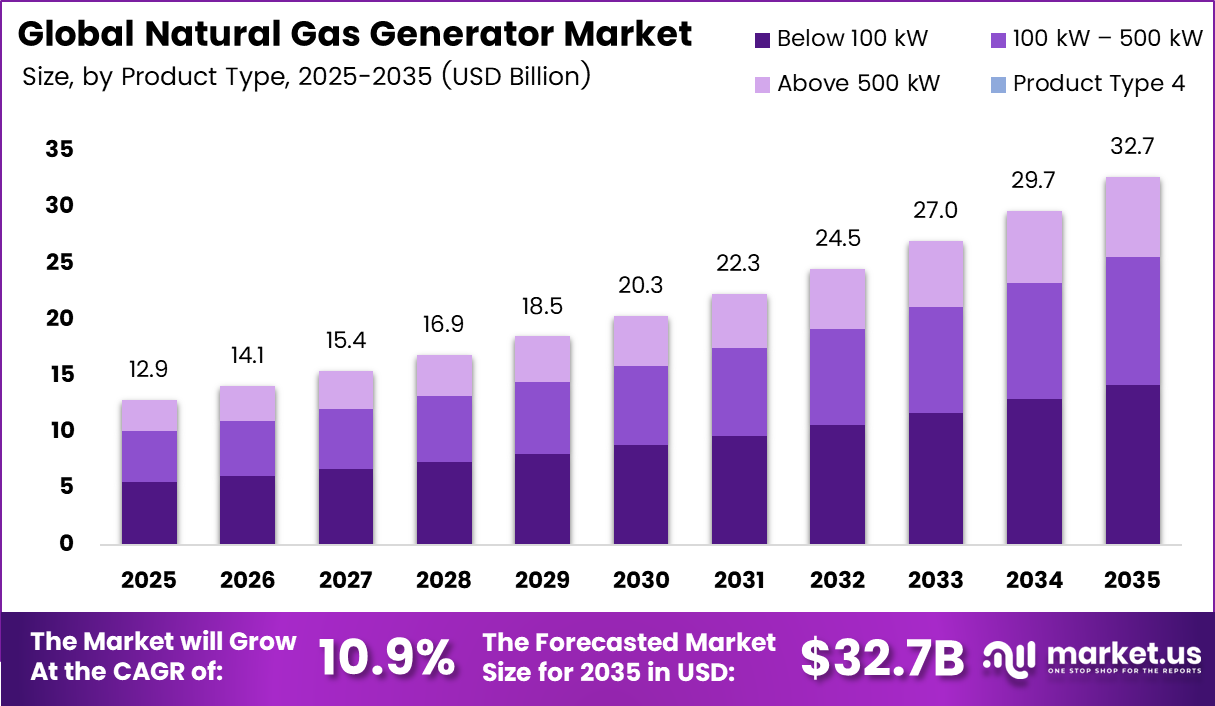
- Global electricity demand is projected to increase, with the International Energy Agency (IEA) reporting a 2.2% rise in global electricity consumption in 2023, driven by electrification, industrial growth, and expansion of digital infrastructure, which is expected to support demand for distributed backup power systems.
The market is driven by heightened government emphasis on cleaner energy and stringent environmental regulations, favoring natural gas generators. They produce less sulfur dioxide, nitrogen oxides, and particulate matter. Ample natural gas supply and expanded pipeline infrastructure further promote their adoption for low-emission power generation.
Key Takeaways
- The global natural gas generator market was valued at US$ 10.96 billion in 2025.
- The global natural gas generator market is projected to grow at a CAGR of 12.5% and is estimated to reach approximately US$ 35.59 billion by 2035.
- On the basis of power rating, the Below 100 kW segment dominated the market, constituting 43.5% of the total market share.
- Based on application, the Backup / Standby Power segment dominated the natural gas generator market, accounting for around 50.75% of the total market share.
- Based on technology, Reciprocating Engines led the market, comprising 73.8% of the total market share.
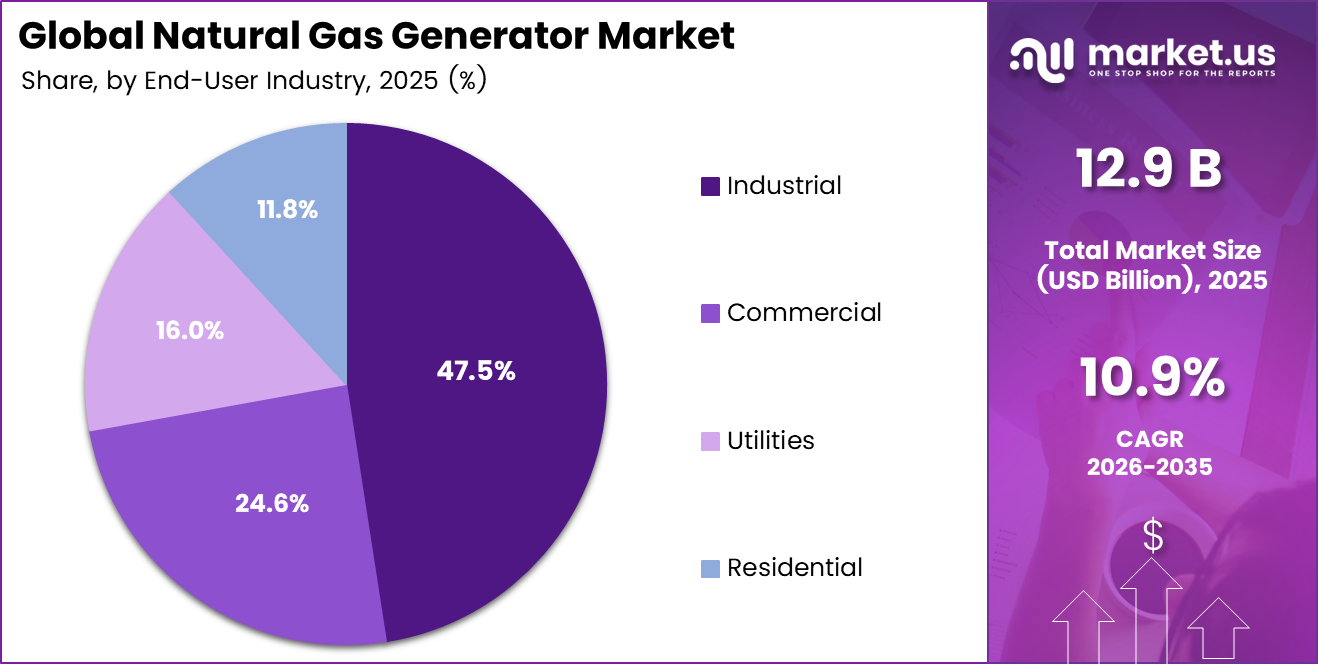
- Among the end-user industries, the Industrial sector held a major share in the natural gas generator market, accounting for 47.55% of the market share.
- In 2025, North America was the most dominant region in the natural gas generator market, accounting for 32.4% of the total global market share.
Power Rating Analysis
The Natural Gas Generator Market was dominated by the segment below 100 kW.
The Below 100 kW segment leads the global natural gas generator market with 43.5% share, favored for residential, telecom, commercial, healthcare, and retail uses. Their compact size, lower costs, fuel efficiency, and reduced emissions boost demand for backup power.
Urbanization, electricity demand, and the need for reliable power supply further drive this market. The expansion of small-scale commercial facilities, data centers, and distributed energy systems boosts the adoption of sub-100 kW generators in developed and emerging economies.
Increased investments in gas infrastructure and a focus on cleaner backup power fuel segment growth, enhancing deployment for residential and small business applications. The 100 kW–500 kW segment held about 34.8% market share, driven by medium-scale industrial and commercial use. The Above 500 kW segment comprised 21.7%, fueled by high-capacity needs in large manufacturing, utility operations, oil & gas, and commercial infrastructure.
Application Analysis
The Natural Gas Generator Market is Dominated by the Backup / Standby Power Segment.
The Backup/Standby Power segment dominated the global natural gas generator market, accounting for a 50.75% share, owing to the requirement of uninterrupted power supply in industry, commercial, domestic, and institutional applications. Such generators serve as backups for critical applications such as data centers, hospitals, and manufacturing units in case of power outages.
The Prime Power market segment constituted about 26.5% of the total market, based on the need for such systems in remote industrial areas that required electricity. On the other hand, the CHP market segment comprised 14.2% of the market and was propelled by the demand for efficient systems that produced electricity and heat energy. Finally, the peak shaving market segment made up 8.55% of the market because of its cost-effectiveness.
Technology Analysis
Reciprocating Engines Led the Natural Gas Generator Market.
The Reciprocating Engines segment led the global natural gas generator market with 73.8% share, driven by flexibility, fuel efficiency, and cost-effectiveness. Widely used in industries, commercial buildings, healthcare, telecom, and data centers, these generators excel in standby, prime, and continuous power generation due to rapid start-up and effective load management capabilities.
The Gas Turbines segment accounted for a market share of around 26.2% owing to its increasing applications in industrial facilities, utilities, and CHP systems. They like them because they can generate a lot of output, they are operationally efficient, and they are suitable for energy infrastructure. The increased investments in industrial cogeneration and commercial energy systems are driving global demand for gas turbine generators.
End-User Analysis
The Natural Gas Generator Market was dominated by the Industrial Segment.
The share of the Industrial segment in the total natural gas generator market was estimated at 47.5%, as the requirement for electricity generation in industries is increasing. Natural gas generators are highly preferred owing to their effectiveness and economic benefits. These include lower emissions and reduced operating costs compared to alternatives such as diesel generators.
The Commercial segment held about 24.6% of the market share, driven by the need for uninterrupted backup power in various sectors. The Utilities segment represented around 16.05%, fueled by the adoption of natural gas generators for distributed generation and grid stabilization. The Residential segment accounted for nearly 11.8%, supported by demand for backup power in areas with frequent outages.
Key Market Segments
By Power Rating
- Below 100 kW
- 100 kW – 500 kW
- Above 500 kW
By Application
- Backup / Standby Power
- Prime Power
- Combined Heat and Power (CHP)
- Peak Shaving
By Technology
- Reciprocating Engines
- Gas Turbines
By End-User Industry
- Commercial
- Industrial
- Residential
- Utilities
Market Dynamics
Drivers
| Driver | (~) % Impact on CAGR | Geographic Relevance | Impact Timeline |
|---|---|---|---|
| AI & Data Center Backup Power Surge | +3.2% | North America, Southeast Asia, Middle East | Short term (≤ 2 years) |
| Grid Instability & Unreliable Utility Supply | +2.1% | Sub-Saharan Africa, South Asia, Latin America | Short term (≤ 2 years) |
| Natural Gas as Coal-to-Gas Transition Bridge Fuel | +1.8% | Asia-Pacific, Eastern Europe, Southeast Asia | Medium term (2–4 years) |
| Rising U.S. Domestic Natural Gas Production & Affordability | +1.4% | North America, LNG-importing regions | Short term (≤ 2 years) |
| Industrialization & Prime Power Demand in Emerging Economies | +1.2% | India, Southeast Asia, West Africa | Medium term (2–4 years) |
| Gas Generator Emissions Advantage Over Diesel (NOx, CO, VOC) | +1.2% | Global, strongest in EU & North America | Short term (≤ 2 years) |
AI & Data Center Backup Power Surge
The exponential scaling of AI compute infrastructure has restructured demand for on-site backup and prime power generation, with natural gas generators emerging as the preferred dispatchable solution due to lower per-unit emissions and faster fuel availability versus diesel at scale. Between 2024 and 2025, new orders for gas turbines increased by approximately 27% year-on-year globally, driven directly by hyperscaler and co-location data center procurement pipelines — a dynamic reinforced by the IEA’s projection that data center electricity consumption will roughly double by 2030 to approximately 945 TWh.
In Southeast Asia alone, data center power demand is forecast to quadruple from 2.6 GW in 2025 to 10.7 GW by 2035, creating sustained, multi-year procurement cycles for standby and prime natural gas generator sets across Singapore, Malaysia, and Indonesia. At the same time, gas-fired power capacity globally in development rose 31% (adding 249 GW) in 2025, reaching a total pipeline of 1,047 GW, with the U.S. now leading the world in new gas power development overwhelmingly driven by data center load growth.
For generator OEMs and EPC contractors, this translates into a structural shift in deal structure — from one-off capex sales toward long-term service agreements, fuel management contracts, and modular capacity expansions — compressing typical project lead times from 18–24 months to under 12 months as hyperscalers demand plug-and-play power readiness. Natural gas currently supplies over 40% of U.S. data center electricity needs as of 2025, anchoring gas generator demand well into the medium term regardless of renewable buildout pace.
Restraints
| Restraint | (~) % Impact on CAGR | Geographic Relevance | Impact Timeline |
|---|---|---|---|
| High Upfront Capital Cost & Financing Barriers | -2.3% | Global, acute in emerging markets & SME segments | Short term (≤ 2 years) |
| Tightening EPA & EU Emissions Regulations (NOx, GHG) | -1.6% | North America, European Union | Medium term (2–4 years) |
| Natural Gas Price Volatility & Supply Disruption Risk | -1.4% | Europe, South Asia, LNG-dependent regions | Short term (≤ 2 years) |
| Tariffs on Steel, Aluminum & Derivative Capital Equipment | -1.1% | North America, trade-exposed manufacturing hubs | Short term (≤ 2 years) |
| Inadequate Gas Pipeline & Distribution Infrastructure | -0.9% | Sub-Saharan Africa, South & Southeast Asia | Medium term (2–4 years) |
High Upfront Capital Cost & Financing Barriers
Natural gas generator systems — spanning the genset unit, fuel handling infrastructure, acoustic enclosures, automatic transfer switches, and commissioning — carry all-in installed costs that routinely exceed $700–$1,100 per kW for industrial-grade prime power configurations, and combined cycle gas turbine plants have seen capital costs escalate sharply to $2,000/kW or more for projects scheduled beyond 2027, compared to $1,116–$1,427/kW for those completing in 2026.
This cost inflation, driven by steel and aluminum input cost escalation — with Section 232 U.S. steel and aluminum duties raised to 50% and extended to derivative capital equipment such as compressors and pumps as of late 2025 — has created a hard financing barrier particularly acute for small and medium enterprises (SMEs) and infrastructure developers in price-sensitive emerging markets.
In markets where the average commercial buyer requires third-party financing, rising interest rate environments through 2024–2025 increased the effective cost of capital by 150–250 basis points relative to the 2021 baseline, extending payback periods by 2–4 years on standard 500 kW–2 MW units and triggering project deferrals rather than cancellations.
Challenges
| Challenge | (~) % CAGR Friction Drag | Geographic Relevance | Mitigation Horizon |
|---|---|---|---|
| Skilled Technician & Workforce Deficit | -1.5% | Global, acute in North America & Middle East | Long term (≥ 4 years) |
| Supply Chain Lead-Time & Component Bottlenecks | -1.2% | Global, driven by Asia-Pacific sourcing concentration | Medium term (2–4 years) |
| Renewable Energy Substitution Pressure | -1.0% | Europe, North America, China | Long term (≥ 4 years) |
| Fuel Supply Geopolitical Disruption Risk | -0.8% | South Asia, Middle East, Europe | Medium term (2–4 years) |
| IoT Integration & Digitalization Complexity | -0.6% | Global, SME & legacy industrial segments | Medium term (2–4 years) |
Skilled Technician & Workforce Deficit
The global energy industry’s structural talent deficit — estimated at a shortfall of up to 40,000 competent workers as of 2025 according to Accenture-sourced analysis published by industry bodies — is acutely concentrated in the sub-specializations most critical to natural gas generator deployment and lifecycle management: rotating equipment maintenance, combustion controls calibration, advanced emissions monitoring, and high-voltage transfer system commissioning.
This shortage is compounded by a demographic exit wave: a disproportionate share of field-qualified gas generation technicians are in the 50–65 age cohort in North America and the Gulf Cooperation Council (GCC), while new workforce entrants have increasingly gravitated toward renewable energy roles that are perceived as more career-forward — creating a generational handover gap that cannot be resolved by training programs alone within a 2–3 year window.
Strategically, leading manufacturers are responding by shifting to factory-built, pre-commissioned modular generator skids that reduce site-level technical labor requirements by an estimated 30–40%, investing in remote diagnostics and predictive maintenance platforms to offset field technician scarcity, and entering long-term managed service partnerships that internalize workforce risk — all of which structurally raise the operating cost base for service delivery and compress after-sales margins by an estimated 4–7 percentage points versus pre-2022 norms.
Opportunities
| Opportunity | (~) % Potential CAGR | Geographic Relevance | Execution Window |
|---|---|---|---|
| Generator-as-a-Service (GaaS) & Energy-as-a-Service Models | +2.4% | Global, highest uptake in North America & GCC | Short term (≤ 2 years) |
| Hydrogen-Ready & Dual-Fuel Generator Platforms | +1.8% | Europe, North America, Japan, South Korea | Medium term (2–4 years) |
| Off-Grid & Microgrid Electrification in Underserved Regions | +1.6% | Sub-Saharan Africa, South Asia, Pacific Islands | Medium term (2–4 years) |
| Modular Distributed Prime Power for Industrial Clusters | +1.3% | Southeast Asia, India, Latin America | Medium term (2–4 years) |
| Aftermarket, Retrofit & Remanufacturing Service Revenue | +1.0% | Global, largest installed base in North America & Europe | Short term (≤ 2 years) |
Generator-as-a-Service (GaaS) & Energy-as-a-Service Models
The Generator-as-a-Service monetization model remains substantially untapped white space in the natural gas generator market: as of 2025, the power rental market — the closest proxy segment — was valued at approximately $11.4 billion globally growing toward $15 billion by 2030, yet the more sophisticated outcome-based GaaS model (where the OEM or financier retains asset ownership, guarantees uptime SLAs, bundles fuel management and predictive maintenance, and charges on a per-kWh or monthly-capacity-reservation basis) accounts for a small fraction of addressable demand relative to the still-dominant capex-purchase channel.
The unit-economic upside is compelling: an OEM transitioning a 1 MW unit from a one-time capex sale (margin typically 12–18%) to a 10-year GaaS contract capturing fuel margin, O&M fees, and financing spread can expand total contract gross margin contribution by 40–60% on a net-present-value basis, while locking in asset utilization rates above 85% versus the 55–65% typical of rental fleets.
Execution prerequisites include deploying IoT-enabled remote asset monitoring (reducing unplanned downtime by an estimated 25–35%), structuring bankable energy service agreements that qualify for infrastructure-grade financing at 6–8% cost of capital rather than commercial lending rates, and scaling dedicated service channel partnerships in high-growth geographies — priorities that represent a 2–4 year organizational build-out for most current market participants.
Geopolitical Impact Analysis
Geopolitical Strains and Energy Supply Interruptions Affecting the Natural Gas Generator Sector.
Geopolitical conflicts and global energy supply disruptions are impacting the natural gas generator market, with the Russia-Ukraine war and LNG trade instability increasing price volatility, affecting fuel procurement and operational costs for power generation.
The Russia-Ukraine war has led to investments in distributed energy infrastructure and natural gas generators, thus ensuring energy security and providing for an increased demand for reliable and uninterrupted power.
According to the International Renewable Energy Agency (IRENA, 2024), renewable energy additions have accounted for the majority of global power capacity expansion in recent years due to declining renewable technology costs and supportive government policies. Transportation costs of generators have increased due to shipping problems and political instability.
Regional Analysis
North America accounted for the largest portion of the worldwide natural gas generator market.
In 2025, North America held about 32.4% of the global natural gas generator market, generating nearly USD 4.18 billion. Factors contributing to this dominance include ample natural gas availability, robust pipeline infrastructure, and growing demand for backup power systems in industrial, commercial, and utility sectors, particularly in the US and Canada.
Asia Pacific is rapidly growing in the natural gas generator market, driven by industrialization, urban infrastructure expansion, and rising electricity demand in emerging economies like China and India. Investments in manufacturing, telecom, and energy systems, along with government emphasis on cleaner energy, are fueling market adoption and growth.
Europe, Latin America, and the Middle East & Africa are becoming key markets for natural gas generators, driven by energy security concerns, investments in backup power, and distributed energy systems. The Russia-Ukraine conflict has fast-tracked localized power generation investments, enhancing industrial and utility infrastructure for future growth in these regions.
Key Regions and Countries Covered in this Report
- North America
- The US
- Canada
- Europe
- Germany
- France
- The UK
- Spain
- Italy
- Russia & CIS
- Rest of Europe
- APAC
- China
- Japan
- South Korea
- India
- ASEAN
- Rest of APAC
- Latin America
- Brazil
- Mexico
- Rest of Latin America
- Middle East & Africa
- GCC
- South Africa
- Rest of MEA
Key Players Analysis
The international natural gas generators industry has a moderate level of consolidation in terms of competition since only a few multinationals have managed to capture an important share of revenues and manufacturing capacities across the world.
This market is dominated by a presence of well-established power equipment suppliers that operate based on product dependability, energy savings, technological innovations, international presence, and post-sale services. The most successful firms emphasize cooperation, product development, plant enlargement, and low-emission power generation technologies.
The industry is experiencing intense competition due to the growing need for distributed energy systems and clean technology. The companies invest in hybrid generation equipment, monitoring technology, and low emissions. Despite this, considerable entry barriers exist due to the high capital investment needed, skills needed, established technology, and stringent regulation.
Major Players in the Industry
- Caterpillar Inc.
- Cummins Inc.
- INNIO Group (Jenbacher & Waukesha)
- Generac Power Systems
- Wärtsilä Corporation
- Rolls-Royce Power Systems (MTU Onsite Energy)
- MAN Energy Solutions SE
- Siemens Energy AG
- GE Vernova (Baker Hughes Gas Tech.)
- Kohler Co.
- Mitsubishi Heavy Industries (MHI)
- Kawasaki Heavy Industries
- Yanmar Holdings Co., Ltd.
- Himoinsa S.L. (Yanmar Group)
- Mahindra Powerol
Key Development
- In March 2025, Caterpillar Inc. expanded its Cat CG natural gas generator portfolio with upgraded high-efficiency generator sets designed for industrial facilities, data centers, and distributed energy applications, focusing on lower emissions and improved fuel optimization.
- In February 2025, Cummins Inc. introduced advanced natural gas-powered generator systems integrated with digital monitoring and remote diagnostics technologies to strengthen its presence in backup and standby power applications globally.
- In November 2024, Wärtsilä Corporation announced strategic collaborations focused on hybrid gas-powered and renewable energy projects to support energy transition and flexible power generation infrastructure globally.
Report Scope
| Report Features | Description |
|---|---|
| Market Value (2025) | USD 12.9 Billion |
| Forecast Revenue (2035) | USD 32.7 Billion |
| CAGR (2026-2035) | 10.9% |
| Base Year for Estimation | 2025 |
| Historic Period | 2020-2024 |
| Forecast Period | 2026-2035 |
| Report Coverage | Revenue Forecast, Market Dynamics, Competitive Landscape, Recent Developments |
| Segments Covered | By Power Rating (Below 100 kW, 100 kW – 500 kW, Above 500 kW), By Application (Backup / Standby Power, Prime Power, Combined Heat and Power (CHP), Peak Shaving), By Technology (Reciprocating Engines, Gas Turbines), By End-User Industry (Commercial, Industrial, Residential, Utilities) |
| Regional Analysis | North America – The US & Canada; Europe – Germany, France, The UK, Spain, Italy, Russia & CIS, Rest of Europe; APAC- China, Japan, South Korea, India, ASEAN & Rest of APAC; Latin America- Brazil, Mexico & Rest of Latin America; Middle East & Africa- GCC, South Africa, & Rest of MEA |
| Competitive Landscape | Caterpillar Inc., Cummins Inc., INNIO Group (Jenbacher & Waukesha), Generac Power Systems, Wärtsilä Corporation, Rolls-Royce Power Systems (MTU Onsite Energy), MAN Energy Solutions SE, Siemens Energy AG, GE Vernova (Baker Hughes Gas Tech.), Kohler Co., Mitsubishi Heavy Industries (MHI), Kawasaki Heavy Industries, Yanmar Holdings Co., Ltd., Himoinsa S.L. (Yanmar Group), Mahindra Powerol |
| Customization Scope | Customization for segments and region/country-level will be provided. Moreover, additional customization can be done based on the requirements. |
| Purchase Options | We have three licenses to opt for: Single User License, Multi-User License (Up to 5 Users), Corporate Use License (Unlimited Users and Printable PDF) |





































