
Quick Navigation
Report Overview
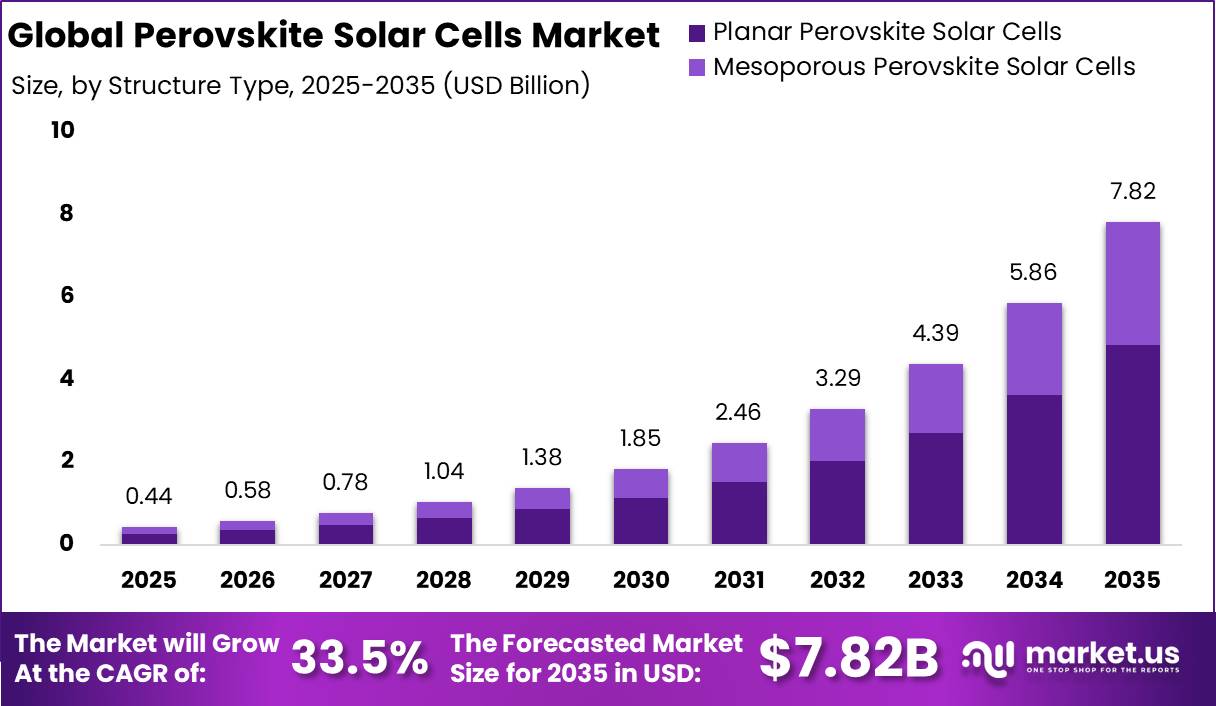
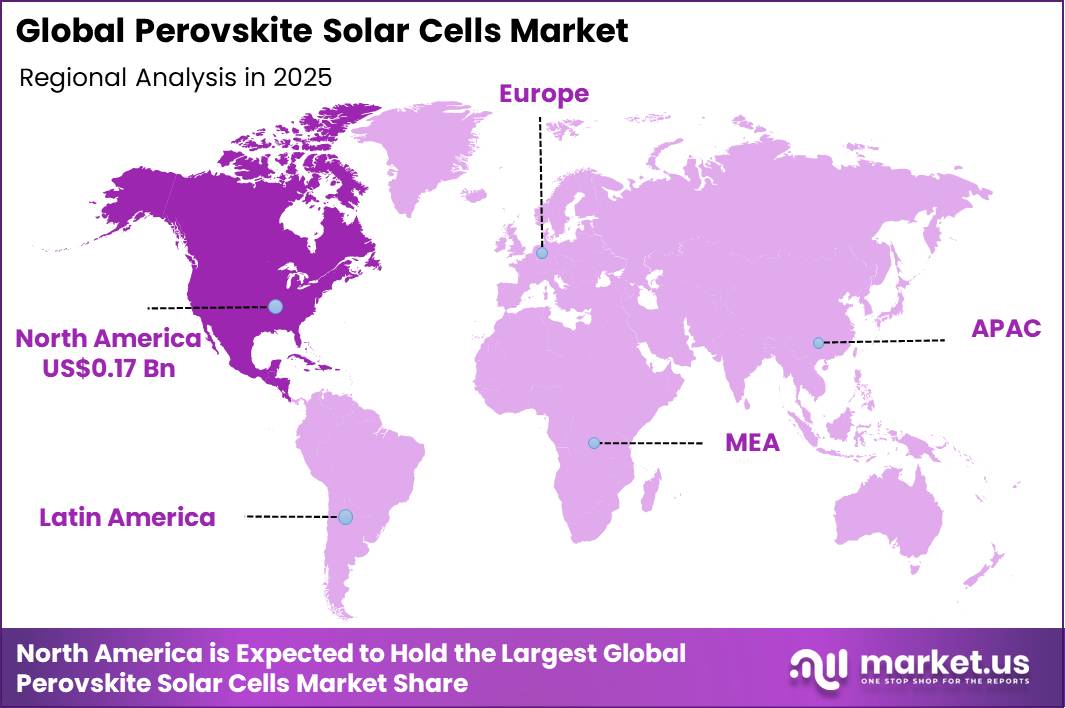
The Global Perovskite Solar Cells Module market is expected to witness a valuation hike from USD 0.44 billion in 2025 to USD 7.82 billion in 2035, backed by a healthy 33.5% CAGR. In 2025, North America led the market, achieving over 38% share with a revenue of USD 0.17 billion.
The global market of perovskite solar cells is expanding at a rapid pace owing to high efficiency standards, reduced manufacturing costs, and increased demands for clean energy sources worldwide. Perovskite-silicon tandem solar cells have attained an efficiency rating greater than 33.9%, which is beyond the efficiency capacity of conventional silicon cells.
- Moreover, costs associated with perovskite cell manufacturing have been greatly reduced to US$ 0.30 – 0.40 per Watt. Government policies encouraging use of renewable energy through subsidies in the Asia-Pacific region, EU Green Deal, and U.S. federal clean energy policies are also playing a major role.
Some major drivers are fuelling the significant rise in the Global Perovskite Solar Cells Market during the forecast period 2025 to 2035. New and improved encapsulation methods are extending the lifetime of modules up to the 25-year industrial norm, decreasing risks for investors while opening up new avenues for utility-scale orders. Increasing BIPV installations and increased usage of portable power units will also drive demand for flexible modules.
Key Takeaways
- The global perovskite solar cells market was valued at USD 0.44 billion in 2025 and is forecast to reach USD 7.82 billion by 2035.
- The market is expected to register robust growth with a significant CAGR of 33.5% during the forecasted years between 2025 and 2035.
- Planar perovskite solar cells accounted for the majority of the structure segment, having around 62% of the overall global market share.
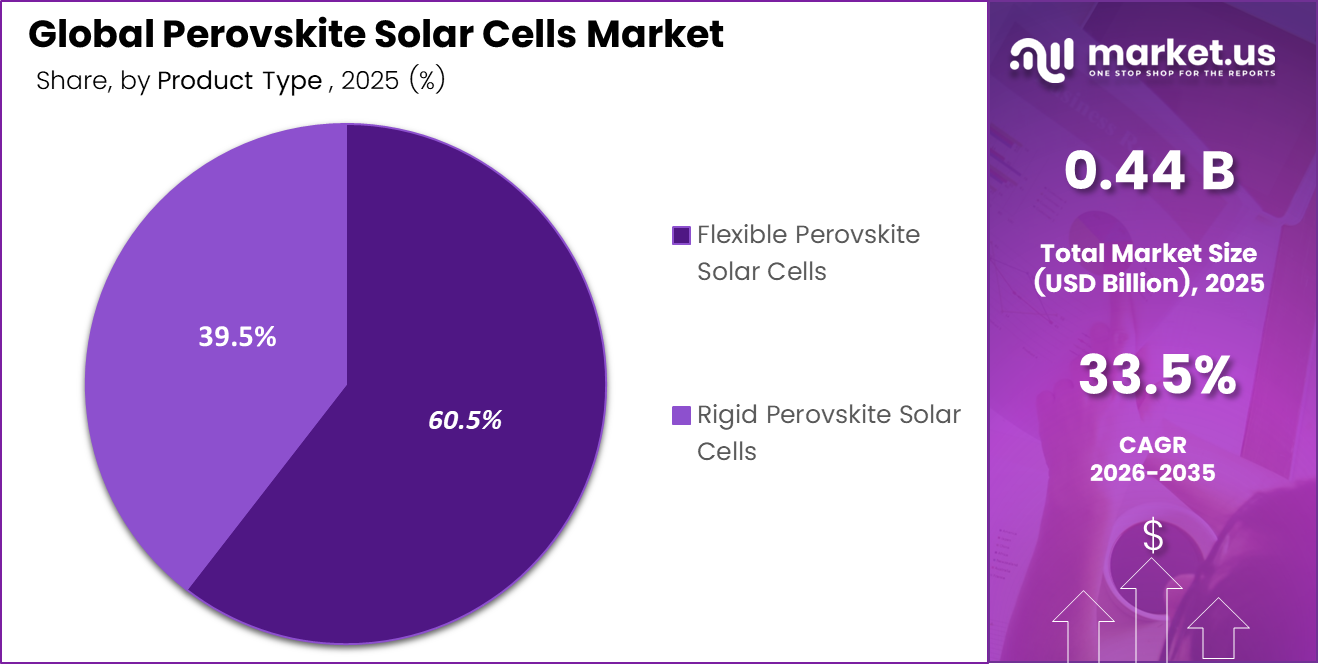
- Flexible perovskite solar modules were observed to have captured the top market share in the product segment with 60.5% share because of their portable nature.
- Single-junction perovskite solar cells claimed the highest technology market share of 58% due to easy and efficient production processes.
- The utilities segment claimed the largest application market share of 45% on account of increasing investments in renewable energy projects.
- Direct sales and OEM sales were the two most popular distribution channels for the global industry with a share of 62% each.
- High efficiency standards, such as tandem cell efficiencies of more than 33.9%, serve as important catalysts for global adoption.
- North America dominated the Global Perovskite Solar Cells Market with the largest share of 38% in 2025.
Structure Type Analysis
Planar Perovskite Solar Cells Type Dominated the Market Owing to Its Scalable Manufacturing and Commercial Compatibility
Global Perovskite Solar Cells Market Segmentation is based on both Planar and Mesoporous (Mesoscopic) architectures. The planar perovskite solar cells are more dominant, having 62.0% of market share in 2025 due to their simplistic design that involves a scaffold-free structure, reducing the manufacturing process by 40-60%.
Examples of companies using planar perovskite solar cells that can produce up to 100MW through roll-to-roll include UtmoLight. However, while mesoporous architecture accounts for 38.0%, it is relatively stable at high temperatures but less preferable due to higher cost of manufacturing and higher LCOE compared to planar architecture.
Product Type Analysis
The market was led by Flexible Perovskite Solar Cells Due to Their Light Weight Design and Increasing Portable Energy Applications
The Global Perovskite Solar Cells Market is divided into two types: flexible and Rigid modules, with Flexible Perovskite Solar Cells holding the larger share at 60.5%. This domination is supported by the shift towards “unconventional” energy production, where their lightness and flexibility enable easy embedding in BIPV applications and portable devices.
In terms of analysis, emphasize the role of roll-to-roll (R2R) printing technology used in flexible PSCs, resulting in 30-50% lower installation weight and CAPEX costs. Although the Rigid module section accounts for 39.5%, the predominance of the Flexible segment is explained by its capability to unlock vast urban markets, attaining a forecasted valuation of USD 7.82 billion by 2035.
Technology Analysis
Single-Junction Technology Leads the Market Due to Easy Manufacturing and Wide Commercial Use
The global market is segmented into Single-Junction, Multi-Junction (Tandem), and Bifacial technologies. The category of Single-Junction accounts for a 58.0% share of the market in 2025 since these types have fewer complexities involved in their manufacture and are immediately applicable in consumer electronics.
Nevertheless, the Multi-junction/Tandem category (30.0%) is the one that grows faster than other sectors since its Compound Annual Growth Rate is expected to surpass 37%. Tandem cells have achieved unprecedented efficiency levels in 2026, amounting to 34.85%, thus breaking through silicon’s physical limitations. The trend suggests that the need for high-power density along with low LCOE is behind such evolution.
Application Analysis
Utilities Segment Dominates the Market Due to Large-Scale Solar Power Deployment
The Utilities sector leads the Global Perovskite Solar Cells Market in terms of market share, accounting for 45.0% of the market in 2025, owing to solar energy projects with capacities measured in gigawatts. The popularity of tandem solar panels with potential efficiency beyond the Shockley–Queisser limit of 29.4% makes the segment prominent. The low cost-per-watt value of USD 0.051 per kWh makes solar energy competitive with coal and other forms of energy.
Commercial & Industrial follows the Utilities segment in the second place with 28.0% of the market. Rooftop solar installation and the need for lightweight flexible solar cells in homes make up the Residential sector’s share of 18.0%.
Distribution Channel Analysis
Direct Sales / OEM Dominates the Market Due to Strong Industrial Partnerships and Large-Scale Project Demand
Leading in the Global Perovskite Solar Cells Market is Direct Sales & OEMs, with the greatest market share of 62.0%, and acts as the primary means of mass adoption. The leadership position can be attributed to the long-term purchase agreement between perovskite manufacturers and large-scale utilities.
As a result of the removal of intermediaries, OEMs are able to use perovskite thin film directly in BIPV and automotive solar skins. Despite the growth in demand for residential consumers and hobbyists through Distributors (27.0%) and Online Retail (11.0%), respectively, direct sales remain the fastest-growing segment.
Key Market Segments
By Structure Type
- Planar Perovskite Solar Cells
- Mesoporous Perovskite Solar Cells
By Product Type
- Flexible Perovskite Solar Cells
- Rigid Perovskite Solar Cells
By Technology Type
- Single Junction
- Multi Junction/Tandem
- Bifacial
By Application
- Utilities
- Commercial & Industrial
- Residential
- Others
By Distribution Channel
- Direct Sales / OEM
- Distributors & Resellers
- Online Retail
Drivers
| Driver | (~) % Impact on CAGR | Geographic Relevance | Impact Timeline |
|---|---|---|---|
| Perovskite-Silicon Tandem Efficiency Breakthroughs | +6.2% | China, USA, South Korea, Germany | Short term (≤ 2 years) |
| Surging Global Solar PV Deployment | +5.1% | Global China, USA, India, EU | Short term (≤ 2 years) |
| Low-Cost Solution-Processable Manufacturing | +4.8% | China, Southeast Asia, USA | Short term (≤ 2 years) |
| Accelerating Private Capital & VC Inflows | +4.3% | USA, UK, Germany, Japan | Short term (≤ 2 years) |
| Bandgap Tunability for Multi-Application Versatility | +3.9% | Global EU, Asia-Pacific, USA | Medium term (2–4 years) |
| Renewable Energy Policy Mandates & Net-Zero Targets | +3.4% | EU, India, China, USA | Short term (≤ 2 years) |
Perovskite-Silicon Tandem Efficiency Breakthroughs
The step-change in certified power conversion efficiency is the single most commercially decisive driver reshaping the perovskite solar module market today. LONGi’s two-terminal crystalline silicon-perovskite tandem cell achieved 34.85% efficiency NREL-certified in April 2025 surpassing silicon’s theoretical single-junction Shockley-Queisser limit of ~29% and demolishing the 30% barrier that had long defined commercial feasibility for tandem architectures.
Qcells further extended the large-area record to 28.6% on a full-area M10-sized (330.56 cm²) tandem cell in December 2024, critically demonstrating that high efficiency is achievable at dimensions compatible with mass manufacturing. Oxford PV’s commercial shipment of 72-cell tandem panels to a US utility-scale installation in September 2024, with module efficiency of 24.5% and a roadmap to gigawatt-scale production, converted this from a laboratory phenomenon to an active revenue-generating commercial event.
These milestones are compressing levelized cost of electricity (LCOE) trajectories, with tandem modules delivering roughly 15–18% more annual energy output per installed watt than standard c-Si at equivalent BOS costs, directly improving project IRR by an estimated 2–3 percentage points and making developers accelerate procurement timelines.
Restraints
| Restraint | (~) % Impact on CAGR | Geographic Relevance | Impact Timeline |
|---|---|---|---|
| Lead Toxicity Regulatory Barriers | -4.8% | EU, USA, Japan, South Korea | Short term (≤ 2 years) |
| Absence of Standardized IEC Module Certification | -4.2% | Global EU, USA, India, Australia | Short term (≤ 2 years) |
| US-China Trade Tariff Disruption | -3.6% | USA, Southeast Asia, India | Short term (≤ 2 years) |
| Limited Commercial Warranty & Bankability | -3.1% | Global USA, EU, Australia | Medium term (2–4 years) |
| Capital Scarcity for Gigawatt-Scale Fab Investment | -2.7% | USA, EU, India | Short term (≤ 2 years) |
Lead Toxicity Regulatory Barriers
The dominant high-efficiency perovskite absorber material methylammonium lead iodide (MAPbI₃) and its mixed-cation derivatives contains lead at concentrations typically in the range of 400–600 mg per module, placing it in direct conflict with the EU’s RoHS Directive, which sets a 1,000 ppm threshold for lead in electronic components and has been under active review for tightening.
Environmental impact assessments published in peer-reviewed literature have identified lead leakage risk during module breakage and end-of-life degradation as a commercially material liability, particularly in outdoor rooftop deployments across high-rainfall jurisdictions in Northern Europe and East Asia. This regulatory overhang is not a future risk but an active commercial impediment utility procurement officers in the EU and Japanese markets are applying precautionary-principle clauses in tender specifications that effectively exclude unencapsulated lead-halide modules from bidding pools, blocking near-term revenue capture in markets representing an estimated 18–22% of global perovskite module TAM.
The lead-free alternative class tin-based and bismuth-based perovskites has achieved a maximum certified PCE of only approximately 15% as of 2025, a ~12 percentage-point efficiency penalty versus lead-halide architectures, making substitution commercially non-viable at present and effectively freezing this market segment until either encapsulation standards or lead-free efficiency gaps narrow simultaneously.
Challenges
| Challenge | (~) % CAGR Friction Drag | Geographic Relevance | Mitigation Horizon |
|---|---|---|---|
| Module-Scale Stability & Degradation | -4.5% | Global | Medium term (2–4 years) |
| Large-Area Deposition Uniformity | -3.8% | Global China, EU, USA | Medium term (2–4 years) |
| Specialized Thin-Film Talent Deficit | -3.2% | EU, USA, India, Southeast Asia | Long term (≥ 4 years) |
| Encapsulation Material Supply Constraints | -2.8% | Global EU, Japan, USA | Medium term (2–4 years) |
| Investor Perception & Insurance Underwriting Gap | -2.4% | USA, EU, Australia | Long term (≥ 4 years) |
| Indium Scarcity in Transparent Electrodes | -1.9% | Global China-dominant supply | Long term (≥ 4 years) |
Perovskite Solar Cell Degradation and Stability Challenges
Perovskite solar cells face significant stability limitations at the module level compared to lab-scale devices (~0.09–1 cm²), where record efficiencies are typically measured. Intrinsic degradation mechanisms such as ion migration in the crystal lattice, light-induced phase segregation, and thermal decomposition of organic components above 85°C lead to annual power losses of 10–20% in real outdoor conditions involving humidity and UV exposure. This is substantially higher than crystalline silicon modules, which typically degrade at around 0.5% per year.
Standard reliability qualification under IEC 61215-1:2021 includes damp heat testing at 85°C / 85% RH, UV exposure, and thermal cycling. Early perovskite modules generally fail or show significant performance decline within 96–350 hours under these stress tests, far below the ~1,000-hour benchmark commonly used by banks and insurers to assess long-term durability. This creates a gap between laboratory efficiency results and bankable commercial performance.
Recent improvements have demonstrated progress but not full commercialization readiness. For example, KTU fully inorganic perovskite mini-modules maintained stable operation for more than 950 hours at 85°C under continuous illumination as of October 2025. However, this still falls short of commercial durability requirements, as long-term deployment demands sustained performance over many years.
Achieving market viability requires simultaneous improvements in thermal stability, moisture resistance, and interfacial engineering, without sacrificing optical absorption efficiency. This multi-factor optimization challenge typically extends development and qualification timelines by 18–36 months, delaying large-scale commercial deployment despite strong efficiency gains at the laboratory level.
Opportunities
| Opportunity | (~) % Potential CAGR Upside | Geographic Relevance | Execution Window |
|---|---|---|---|
| BIPV & Zero-Energy Building Integration | +5.4% | EU, China, UAE, USA | Medium term (2–4 years) |
| Agrivoltaics & Floating Solar Deployment | +4.7% | India, Japan, EU, Southeast Asia | Medium term (2–4 years) |
| Ambient & Indoor IoT Photovoltaics | +4.2% | Global USA, EU, Japan, South Korea | Short term (≤ 2 years) |
| Perovskite IP Licensing & White-Label Models | +3.6% | USA, EU, South Korea, Japan | Medium term (2–4 years) |
| Space & Aerospace Photovoltaic Applications | +3.1% | USA, EU, China, Japan | Long term (≥ 4 years) |
| Emerging Market Off-Grid Energy Leapfrogging | +2.8% | Sub-Saharan Africa, South Asia, LATAM | Medium term (2–4 years) |
Indoor Perovskite Solar Cells for IoT Energy Harvesting
The combination of perovskite solar cells and the expanding IoT ecosystem creates a distinct high-growth opportunity focused on indoor energy harvesting rather than traditional outdoor photovoltaic deployment. Under indoor lighting conditions of approximately 1,000 lux (typical LED lighting), perovskite cells have achieved certified power conversion efficiencies of up to 45.5%, with strong electrical performance metrics including a 1.15 V open-circuit voltage and 85.2% fill factor. This significantly outperforms conventional silicon-based indoor photovoltaics, which typically achieve around ~22% efficiency in similar conditions.
This efficiency advantage positions perovskite technology as a strong candidate for powering low-energy devices such as wireless sensor nodes, smart building automation systems, and wearable health monitoring devices. The global IoT installed base is projected to exceed 30 billion devices by 2030, and ongoing operational costs associated with battery replacement and maintenance for distributed sensor networks are estimated in the range of USD 2–5 billion annually. Ambient energy harvesting solutions directly address this cost burden by enabling self-powered operation and reducing lifecycle maintenance requirements.
Early entrants in indoor energy harvesting can secure design wins with smart building integrators, industrial automation providers, and wearable electronics manufacturers before the market becomes highly competitive. Depending on deployment scale and sensor density, contract values in industrial IoT implementations may range from USD 50,000 to 500,000 per project, with strong potential for recurring revenue through system expansion and replacement cycles.
Geopolitical Impact Analysis
Geopolitical Tensions Significantly Impacted the Growth of the Perovskite Solar Cells Module Market
The Global Perovskite Solar Cells Market is facing a challenging geopolitical landscape of trade wars, which acts both as a restraint and driver in promoting localization innovations. The geopolitical tensions in Eastern Europe are affecting the supply chain of specialty chemicals and noble gases used in the production of perovskites with high purity.
The world is shifting towards Energy Sovereignty where countries are investing in their own supply chains of perovskites in order to avoid reliance on imports. The dominant player in terms of solar materials at the upstream level is China, hence driving other countries including India and America to invest in subsidies like the PLI in order to build their own PSC industry. The latest 2026 guidelines from the European Commission support clean technology sovereignty by promoting BIPV made within the region’s trade bloc. Export duties on silver and its increasing price levels are leading the shift to silver free metallization, making PSC indispensable until 2035.
Regional Analysis
North America Dominates the Market through Strong R&D and Strategic Investments
North America enjoys the leading position in the Global Perovskite Solar Cells Market with its dominating regional share estimated at 38% for 2025. Such an advantage can be explained by the well-developed research and development infrastructure of the countries like the USA and Canada with the government financial support for innovations in the sector combined with the participation of universities and venture capitalists into the production process.
North America is characterized by the largest number of breakthrough inventions related to solar technology efficiency, as well as favorable federal incentives for clean energy utilization.Europe holds the second place with a 28% share thanks to mandatory requirements of the EU Green Deal, while Asia-Pacific shares 22% of the market.
It is also the region with the fastest growth rates due to the rapid expansion of Chinese and Japanese industries producing perovskite modules. Latin America and the Middle East & Africa occupy relatively small shares amounting to 7% and 5%, respectively, but they become increasingly interested in flexible and low-cost perovskite-based solar cells applications.
Key Regions and Countries
- North America
- The US
- Canada
- Europe
- Germany
- France
- The UK
- Spain
- Italy
- Russia & CIS
- Rest of Europe
- APAC
- China
- Japan
- South Korea
- India
- ASEAN
- Rest of APAC
- Latin America
- Brazil
- Mexico
- Rest of Latin America
- Middle East & Africa
- GCC
- South Africa
- Rest of MEA
Key Players Analysis
In 2026, the Global Perovskite Solar Cells Market features a growing competitive trend towards gigawatt capacity in manufacturing by market innovators and major companies. The efficiency revolution is being spearheaded by the two industry leaders, JinkoSolar and LONGi, which achieved perovskite-silicon tandem cell efficiency certification of 34.85%, surpassing the boundaries of standard silicon-based cells.
In Asia, GCL Suzhou Nanotechnology and Hangzhou Microquanta are committed to scaling up production, with GCL acquiring a recent order for its products amounting to 1.2 MW, whereas Microquanta boasts the largest production line for grid-tied modules.
Technology providers like Fujifilm, Fujikura, and Kyocera use their extensive knowledge in thin film coatings and electronics to build BIPV and flexible modules that can help smart cities thrive. By using roll-to-roll technology and water-resistant encapsulation, cost-effective manufacturing is ensured, with costs plummeting to as low as USD 0.29 per Watt.
Market Key Players
- BASF
- Dyenamo
- Energy Materials Corp.
- Frontier Energy Solution
- Fujifilm
- Fujikura
- GCL Suzhou Nanotechnology Co., Ltd.
- Greatcell Energy
- Hangzhou Microquanta
- Heiking PV Technology Co., Ltd.
- Hubei Wonder Solar
- Hunt Perovskite Technologies (HPT)
- InfinityPV
- Jinkosolar
- Kyocera
Recent Development
- In May 2026, BASF launched a specialized high-efficiency light-conversion material designed to optimize solar manufacturing environments by blocking harmful short wavelengths while converting them into useful light to improve process stability and energy efficiency.
- In April 2026, JinkoSolar Reported in its Q1 results a milestone lab efficiency of 34.76% for TOPCon-based perovskite tandem cells, while shifting its commercial strategy to prioritize high-margin, next-generation Tiger Neo 3.0 modules.
- In February 2026, Fujifilm expanded its PSC materials portfolio by launching a new series of battery-grade precursors and high-purity molecular spacers. This development focuses on enhancing the moisture resistance of flexible perovskite layers, specifically targeting the growing wearable electronics and smart building markets.
Report Scope
| Report Features | Description |
|---|---|
| Market Value (2025) | USD 0.44 Billion |
| Forecast Revenue (2035) | USD 7.82 Billion |
| CAGR (2026-2035) | 33.5% |
| Base Year for Estimation | 2025 |
| Historic Period | 2020–2024 |
| Forecast Period | 2025–2035 |
| Report Coverage | Revenue Forecast, Market Dynamics, Competitive Landscape, Geopolitical Impact, and Recent Developments |
| Segments Covered | Global Perovskite Solar Cells Market Report By Structure (Planar and Mesoporous), By Product Type (Flexible and Rigid), By Technology (Single-Junction, Multi-Junction/Tandem, and Bifacial), By Application (Utilities, Commercial & Industrial, Residential, and Others), By Distribution Channel (Direct Sales/OEM, Distributors & Resellers, and Online Retail) |
| Regional Analysis | North America – The US & Canada; Europe – Germany, France, The UK, Spain, Italy, Russia & CIS, Rest of Europe; APAC– China, Japan, South Korea, India, ASEAN & Rest of APAC; Latin America– Brazil, Mexico & Rest of Latin America; Middle East & Africa– GCC, South Africa, & Rest of MEA |
| Competitive Landscape | BASF, Dyenamo, Energy Materials Corp., Frontier Energy Solution, Fujifilm, Fujikura, GCL Suzhou Nanotechnology Co., Ltd., Greatcell Energy, Hangzhou Microquanta, Heiking PV Technology Co., Ltd., Hubei Wonder Solar, Hunt Perovskite Technologies (HPT), InfinityPV, Jinkosolar, Kyocera. |
| Customization Scope | Segment, country, and regional customization, along with company profiling, pricing trends, CAGR updates, competitive benchmarking, and additional application or technology segmentation, can be provided as per client requirements. |
| Purchase Options | We have three licenses to opt for: Single User License, Multi-User License (Up to 5 Users), and Corporate User License (Unlimited Users and Printable PDF) |


