
Quick Navigation
Report Overview
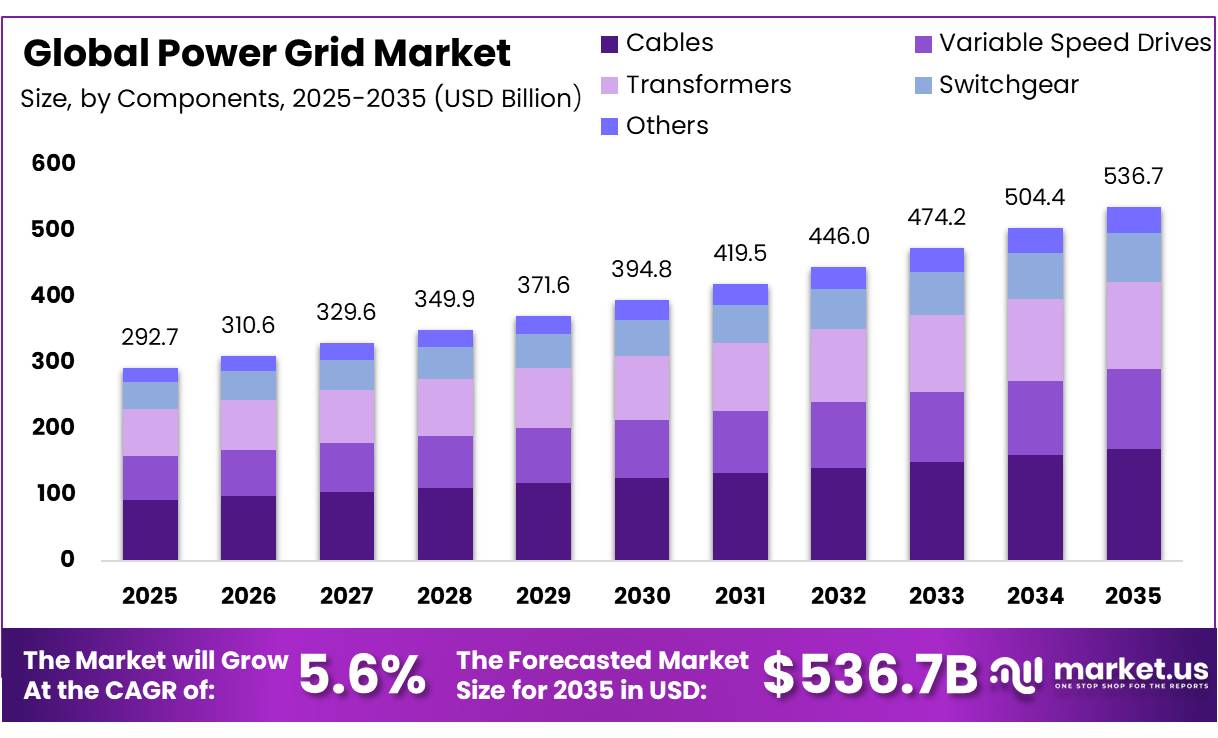
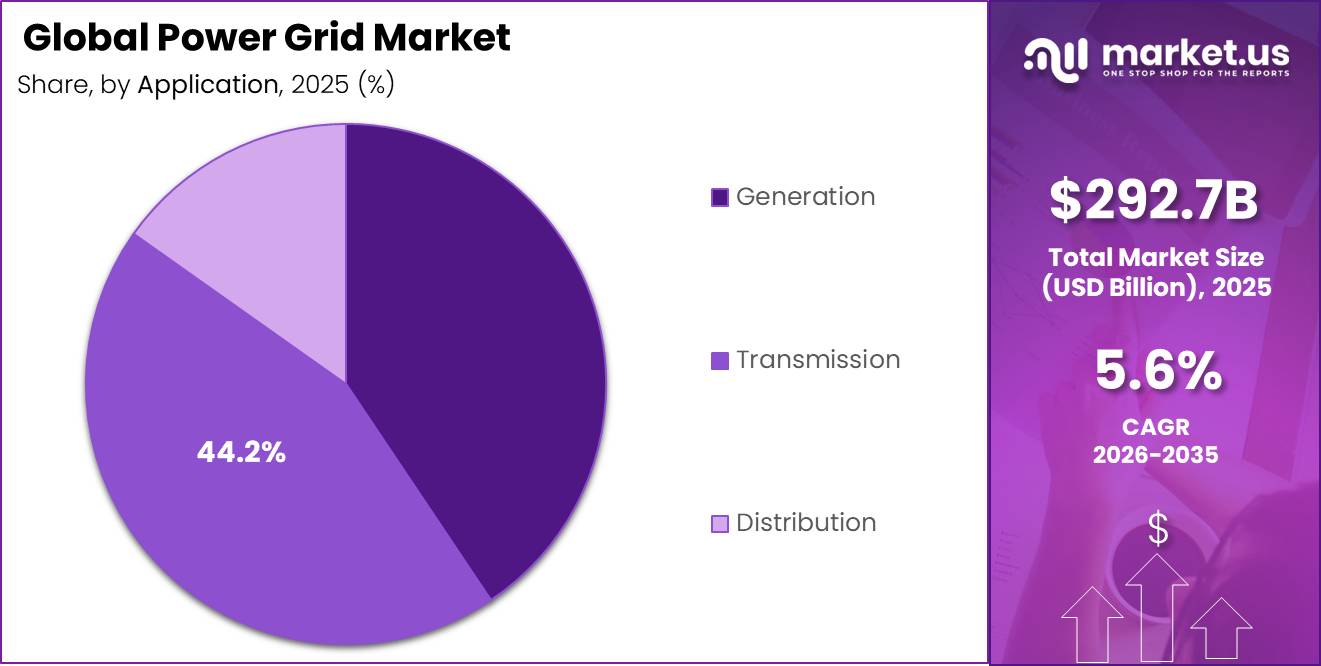
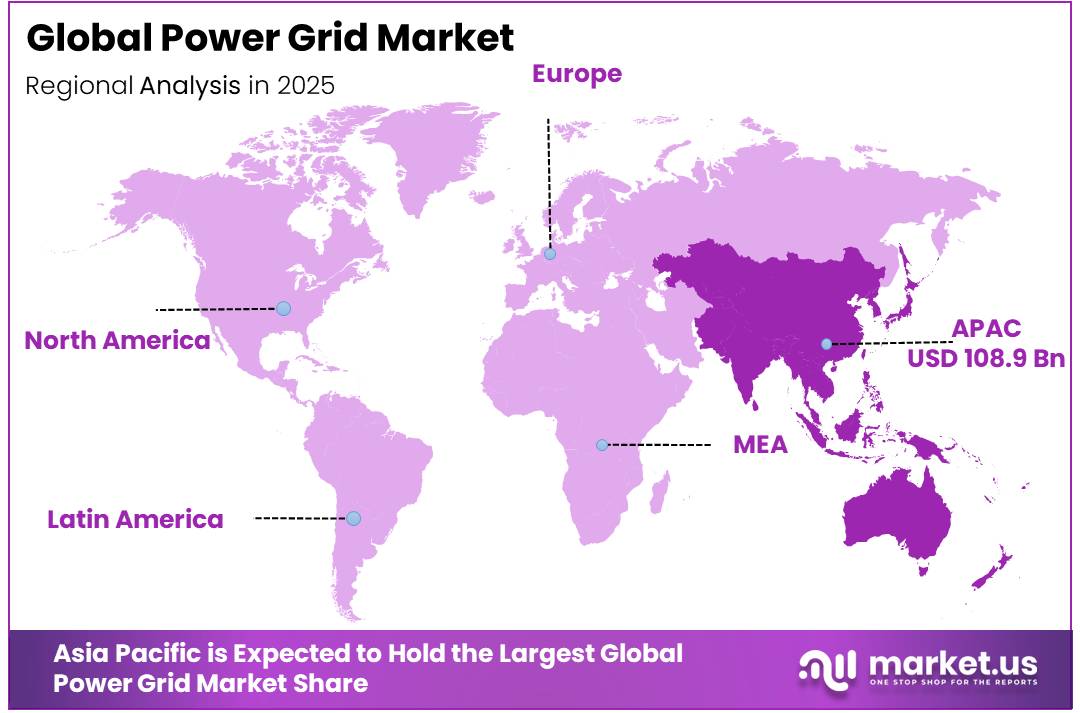
The Global Power Grid Market size is expected to be worth around USD 536.7 Billion by 2035, from USD 292.7 Billion in 2025, growing at a CAGR of 5.6% during the forecast period from 2026 to 2035. In 2025, Asia-Pacific held a dominant market position, capturing more than a 37.2% share, holding USD 108.94 Billion revenue.
The power grid industry is moving from a traditional electricity delivery system to a smarter, more flexible and digital network. Rising electricity use, renewable energy growth, grid reliability needs, and electrification of transport, buildings, industries, and data centers are pushing utilities to invest in stronger transmission and distribution systems.
- According to the International Energy Agency (IEA), global electricity demand grew by 4.3% in 2024, adding around 1,080 TWh in a single year. The generation mix is also shifting, with renewables and nuclear together accounting for nearly 40% of global electricity output, while coal still represents about 35%, indicating a gradual but clear transition in power systems. This evolving structure is increasing pressure on transmission and distribution networks to become more flexible, resilient, and digitally enabled.
Key Takeaways
- The power grid market was valued at USD 292.7 billion in 2025.
- The global power grid market is projected to grow at a CAGR of 5.6% and is estimated to reach USD 536.7 billion by 2035.
- On the basis of component, the cables segment dominated the market, constituting 31.7% of the total market share.
- Based on the power source, natural gas dominated the market, with a substantial market share of around 32.8%.
- Based on the application, transmission emerged as the leading segment, accounting for 44.2% of the total market share.
- In 2025, Asia Pacific was the most dominant region in the market, accounting for 37.2% of the total global market share.
The industrial scenario reflects strong investment momentum in grid expansion, modernization, and digital transformation. Solar photovoltaic alone contributed nearly 480 TWh of new electricity generation in 2024, making it the largest source of incremental supply. More than 80% of global electricity growth came from clean energy technologies, highlighting the rapid shift toward low-carbon systems. However, grid infrastructure constraints remain significant, with over 2,500 GW of generation capacity reportedly delayed in connection queues due to transmission bottlenecks. At the same time, electricity demand is increasing more than 2.5 times faster than overall energy demand, reinforcing the urgency for grid expansion and optimization.
Key driving factors include electrification of transport, industrial automation, expansion of data centers, and rising cooling demand in buildings. These structural shifts are fundamentally reshaping load profiles and increasing peak demand pressure on grid systems worldwide. Government-led decarbonization policies and net-zero commitments are further accelerating investments in smart grids, advanced metering infrastructure, and cross-border interconnections.
Looking ahead, the global power grid industry is expected to witness sustained expansion driven by long-term energy transition needs. Global electricity demand is projected to grow at an average rate of 3.6% annually between 2026 and 2030, reaching approximately 33,600 TWh by 2030. This will require massive investment in transmission upgrades, smart grid deployment, and digital control systems.
In 2025, Siemens Smart Infrastructure also targeted 6–9% revenue growth and a 17–18% profit margin, supported by electrification, decarbonization, AI, resilience, and digital infrastructure demand. This reflects the wider industry shift toward intelligent power distribution, grid analytics, cybersecurity, and automated energy systems.
Component Analysis
Cables represents dominant Segment in the Power Grid Market.
In 2025, Cables held a dominant market position, capturing more than a 31.7% share of the global power grid market by component. Their leadership was primarily attributed to their fundamental role in transmitting electricity across generation, transmission, and distribution infrastructure. Growing investments in grid expansion projects, replacement of aging electrical networks, and increasing deployment of underground and submarine transmission systems continued to support demand for advanced cable solutions.
Transformers accounted for 24.6% of the power grid market in 2025, supported by their critical function in voltage regulation and efficient electricity transfer across transmission and distribution networks. The increasing need to integrate renewable energy generation, modernize aging substations, and strengthen grid resilience contributed to sustained demand for transformer installations.
Power Source Analysis
Natural Gas leads with 38.2% as utilities continue to value its reliability and operational flexibility.
In 2025, Natural Gas held a dominant market position, capturing more than a 38.2% share of the global power grid market by power source. Its leading position was supported by its ability to provide stable and dispatchable electricity generation, making it an important balancing source within increasingly diversified energy systems. Power producers continued to rely on natural gas-fired facilities due to their relatively lower emissions compared to conventional coal-based generation and their capability to respond quickly to fluctuations in electricity demand.
Hydroelectric power represented 14.3% of the market in 2025 and emerged as the fastest-growing segment within the power source category. Its growth was driven by increasing emphasis on low-carbon electricity generation and the long operational life associated with hydropower facilities. Grid operators continued to recognize the value of hydroelectric plants for their ability to provide dependable baseload generation while also offering flexibility through rapid ramp-up capabilities.
Application Analysis
Transmission dominates with 44.2% as expanding grid networks require stronger long-distance power delivery.
In 2025, Transmission held a dominant market position, capturing more than a 44.2% share of the global power grid market by application. Its leading position was largely driven by the growing need to transport electricity efficiently across long distances from generation sites to consumption centers. The expansion of renewable energy projects, particularly those located far from urban and industrial demand hubs, increased the importance of robust transmission infrastructure.
Generation accounted for 40.6% of the market in 2025 and emerged as the fastest-growing application segment. Growth was supported by continuous investments in new power generation capacity to meet rising global electricity demand. The increasing deployment of renewable energy facilities, modernization of conventional power plants, and growing focus on energy security encouraged utilities to expand generation assets.
Key Market Segments
By Component
- Cables
- Variable Speed Drives
- Transformers
- Switchgear
- Others
By Power Source
- Oil
- Natural Gas
- Coal
- Hydroelectric
- Others
By Application
- Generation
- Transmission
- Distribution
Driver Analysis
Electrification load growth from EVs, cooling, industry, and buildings
Electrification has become a major growth driver for the power grid industry as utilities increasingly plan for higher and more sustained electricity demand rather than stable consumption levels. According to the IEA, global electricity demand is projected to increase by 3.3% in 2025 and 3.7% in 2026, marking one of the strongest growth periods in over a decade, supported by expanding industrial activity, EV adoption, cooling demand, appliances, and data centers. JPMorgan further projects global power demand to grow at a 3.6% CAGR during 2026–2030, around 50% faster than the previous decade, with EVs and heat pumps contributing nearly 25% of incremental demand growth.
Drivers Impact Analysis
| Driver | (~) % Impact on CAGR | Geographic Relevance | Impact Timeline |
|---|---|---|---|
| Electrification load growth from EVs, cooling, industry, and buildings | +2.2% | North America core, EU, China, India, Southeast Asia | Short term (≤ 2 years) |
| Data center and AI power demand accelerating substation and transmission upgrades | +1.8% | US core, Nordics, Ireland, Western Europe, selected APAC corridors | Short term (≤ 2 years) |
| Grid modernization funding and regulated capex programs scaling asset replacement | +2.0% | US core, EU, China, UK, Japan | Medium term (2-4 years) |
| Renewable integration and cross-border transmission build-out | +2.4% | China core, EU, US ISOs/RTOs, Australia, MENA corridors | Medium term (2-4 years) |
| Resilience, extreme weather hardening, and cybersecurity-driven network investment | +1.5% | US, Canada, Southern Europe, Australia, climate-exposed APAC | Short term (≤ 2 years) |
| Permitting and long-horizon planning reforms improving project conversion | +1.1% | US, EU, UK | Long term (≥ 4 years) |
Restraint Analysis
Queue and permitting delays
Interconnection backlogs and transmission permitting delays are becoming a major restraint for the power grid market because they slow the conversion of planned projects into actual infrastructure spending and equipment orders.
According to Lawrence Berkeley National Laboratory, more than 2,060 GW of generation and storage capacity remained in grid interconnection queues at the end of 2025, highlighting a significant execution gap between project announcements and deployment. Although FERC’s long-term transmission planning framework supports 20-year planning horizons and stronger regional coordination, approval timelines remain lengthy.
Restraint Impact Analysis
| Restraint | (~) % Impact on CAGR | Geographic Relevance | Impact Timeline |
|---|---|---|---|
| Transformer shortage | -2.4% | North America core, EU, India, Middle East | Short term (≤ 2 years) |
| Metal cost and tariffs | -1.6% | US core, North America supply chain, selected EU exporters | Short term (≤ 2 years) |
| Queue and permitting delays | -2.1% | US core, EU, UK, Australia | Medium term (2–4 years) |
| Utility capital strain | -1.4% | US, EU, Latin America, emerging APAC | Medium term (2–4 years) |
| Skilled labor bottlenecks | -1.2% | US, Canada, EU, Australia | Short term (≤ 2 years) |
| Cyber and compliance burden | -0.9% | North America core, EU, advanced APAC | Long term (≥ 4 years) |
Opportunity Analysis
Distribution flexibility markets
Distribution flexibility markets represent a high-value opportunity for the power grid industry by enabling utilities to manage demand response, distributed energy resources (DERs), EV charging, and localized energy storage as ongoing grid services rather than relying only on physical infrastructure expansion. With renewable energy already contributing around one-third of global electricity supply and electricity’s share of final energy consumption expected to increase from approximately 23% today to 35% by 2035 according to IRENA, utilities are under pressure to improve grid coordination and efficiency.
Opportunity Impact Analysis
| Opportunity | (~) % Impact on CAGR | Geographic Relevance | Execution Window |
|---|---|---|---|
| Grid-enhancing tech retrofits | +1.8% | North America core, EU, India, Australia | Short term (≤ 2 years) |
| Data center power-as-a-service | +2.4% | US, Nordics, Ireland, GCC, India | Short term (≤ 2 years) |
| Interregional HVDC corridors | +2.1% | EU, US, China, India, Brazil | Medium term (2-4 years) |
| Distribution flexibility markets | +1.6% | North America, EU, Japan, Korea | Medium term (2-4 years) |
| Mini-grid to main-grid hybrids | +1.9% | Sub-Saharan Africa, South Asia, ASEAN | Medium term (2-4 years) |
| Transformer and cable roll-up platforms | +1.3% | US, EU, India, MENA, LatAm | Long term (≥ 4 years) |
Challenges Analysis
Transformer Backlog Intensity
Transformer backlog intensity remains a major operational challenge for the power grid market because equipment demand continues to grow while supply capacity remains limited. According to the IEA, lead times for large power transformers have nearly doubled since 2021, with procurement timelines now extending up to four years. Global transformer trade reached only USD 13.5 billion in 2023, with China, Korea, Türkiye, and Italy accounting for nearly 50% of exports, creating supply concentration risks. In addition, average transformer prices have increased by around 75% since 2019, driven by raw material costs. This has resulted in 6–12 months of project delays, 8–15% higher substation budgets, and reduced project returns until utilities adopt longer-term procurement strategies.
| Challenge | (~) % Impact on CAGR | Geographic Relevance | Mitigation Horizon |
|---|---|---|---|
| Transformer backlog intensity | -1.7% | North America core, EU, LatAm importers, Africa | Medium term (2-4 years) |
| Cable and HVDC scarcity | -1.5% | EU offshore hubs, US, China-adjacent trade routes, North Sea | Medium term (2-4 years) |
| Grid skills deficit | -1.4% | US, EU, Australia, India, select EMDE | Long term (≥ 4 years) |
| Permitting cycle drag | -1.9% | North America core, EU regulatory hubs | Long term (≥ 4 years) |
| Interconnection queue congestion | -1.3% | US, EU, India, Australia | Medium term (2-4 years) |
| Digital-cyber integration burden | -1.0% | North America, EU, Japan, Korea, GCC | Medium term (2-4 years) |
Geopolitical Impact Analysis
Energy Security Priorities Reshape Global Power Grid Investments
The power grid market is increasingly shaped by geopolitical developments that influence energy security, infrastructure investment, and supply chain stability. Governments across North America, Europe, and other developed regions are prioritizing grid modernization to reduce dependence on imported energy and strengthen domestic energy resilience. This has accelerated investments in transmission networks, interconnections, and grid reliability projects, making power infrastructure a strategic national asset.
Geopolitical tensions have also exposed vulnerabilities in global supply chains for critical grid components such as transformers, cables, switchgear, and power electronics. Trade restrictions, raw material shortages, and transportation disruptions have increased procurement costs and extended project timelines. In response, utilities and governments are diversifying suppliers, promoting domestic manufacturing, and building more resilient supply chains to reduce future risks.
At the same time, international decarbonization commitments are creating new opportunities for grid development. Many countries are expanding transmission infrastructure to support renewable energy integration and cross-border electricity trading. These initiatives are encouraging investments in high-voltage networks and smart grid technologies capable of handling more complex power flows.
Regional Analysis
Asia Pacific Held the Largest Share of the Global Power Grid Market.
In 2025, Asia-Pacific held a dominant position in the global power grid market, accounting for 37.2% of the total market and generating approximately USD 108.94 billion in revenue. The region’s leadership is supported by large-scale investments in transmission and distribution infrastructure, increasing electricity consumption, and continuous expansion of renewable energy capacity. Rapid industrialization, urban development, and growing electrification across several economies have created strong demand for reliable and resilient power networks. Utilities across the region are actively modernizing grid systems to accommodate higher electricity loads and improve network efficiency.
The region also benefits from its significant role in global power generation and energy infrastructure development. According to the International Energy Agency (IEA), Asia-Pacific continues to account for the largest share of global electricity demand growth, supported by expanding industrial activity and increasing adoption of electric technologies. Many countries within the region are investing in ultra-high-voltage transmission networks, smart grid technologies, and renewable energy integration projects to strengthen long-term energy security. Large-scale deployment of solar and wind power has further increased the need for advanced grid infrastructure capable of managing variable power generation.
Key Regions and Countries
- North America
- The US
- Canada
- Europe
- Germany
- France
- The UK
- Spain
- Italy
- Russia & CIS
- Rest of Europe
- APAC
- China
- Japan
- South Korea
- India
- ASEAN
- Rest of APAC
- Latin America
- Brazil
- Mexico
- Rest of Latin America
- Middle East & Africa
- GCC
- South Africa
- Rest of MEA
Key Players Analysis
The global power grid market is characterized by the presence of several multinational electrical equipment manufacturers, transmission infrastructure providers, and grid technology companies competing to strengthen their market positions. Market participants are increasingly focusing on grid modernization projects, transmission network expansion, renewable energy integration, and digital power management solutions to address the growing demand for reliable electricity infrastructure. The rising deployment of smart grids, high-voltage transmission systems, and advanced monitoring technologies has intensified competition among leading companies. In addition, utilities and governments worldwide are investing heavily in upgrading aging power networks, creating significant opportunities for equipment suppliers and technology providers.
Companies are actively pursuing strategic partnerships, acquisitions, research and development initiatives, and capacity expansion projects to enhance their competitive advantages. The increasing integration of renewable energy sources into national grids has further encouraged investments in transformers, switchgear, transmission cables, and automation solutions capable of improving grid stability and efficiency. Furthermore, expanding electrification programs and cross-border power transmission projects continue to support long-term market growth. As a result, innovation, operational efficiency, and comprehensive grid infrastructure capabilities remain key competitive factors within the industry.
The Major Players in The Industry
- State Grid Corporation of China
- Siemens AG
- General Electric
- Hitachi Energy
- Elsewedy Electric
- Aker Solutions ASA
- Tata Power Company Ltd
- Mitsubishi Electric
- WEG Industries
- General Electric
- Actom
- S&C Electric Company
Key Development
- In November 2025, Siemens and Delta signed a global partnership for prefabricated modular power solutions for data centers, aiming to cut deployment time by up to 50%, reduce CAPEX by up to 20%, and lower carbon emissions by up to 27%. In 2026, Siemens advanced Gridscale X with AI-powered transmission planning through next-generation PSS E, supporting faster grid planning and operations. Separately, Siemens Energy announced a €2 billion investment by 2028 to expand transformer and switchgear factories, showing strong grid-sector capacity expansion.
- In 2025, GE Vernova signed an agreement with Amazon Web Services to support global data center electrification across North America, Europe, and Asia. It also announced the sale of its Proficy industrial software business to TPG for USD 600 million, with proceeds planned for reinvestment into grid software. For expansion, GE Vernova planned USD 11 billion in capex and R&D during 2025–2028, including a USD 5.3 billion acquisition of Prolec GE to expand transformer production.
Report Scope
| Report Features | Description |
|---|---|
| Market Value (2025) | USD 292.7 Bn |
| Forecast Revenue (2035) | USD 536.7 Bn |
| CAGR (2026-2035) | 5.6% |
| Base Year for Estimation | 2025 |
| Historic Period | 2020-2024 |
| Forecast Period | 2026-2035 |
| Report Coverage | Revenue Forecast, Market Dynamics, Competitive Landscape, Recent Developments |
| Segments Covered | Market By Component Type (Cables, Variable Speed Drives, Transformers, Switchgear, Others), By Power Source (Oil, Natural Gas, Coal, Hydroelectric, Others), By Application (Generation, Transmission, Distribution) |
| Regional Analysis | North America – The US & Canada; Europe – Germany, France, The UK, Spain, Italy, Russia & CIS, Rest of Europe; APAC– China, Japan, South Korea, India, ASEAN & Rest of APAC; Latin America– Brazil, Mexico & Rest of Latin America; Middle East & Africa– GCC, South Africa, & Rest of MEA |
| Competitive Landscape | State Grid Corporation of China, Siemens AG, General Electric, Hitachi Energy, Elsewedy Electric, Aker Solutions ASA, Tata Power Company Ltd, Mitsubishi Electric, WEG Industries, General Electric, Actom, S&C Electric Company. |
| Customization Scope | Customization for segments, region/country-level will be provided. Moreover, additional customization can be done based on the requirements. |
| Purchase Options | We have three licenses to opt for: Single User License, Multi-User License (Up to 5 Users), Corporate Use License (Unlimited Users and Printable PDF) |


