


Report Overview
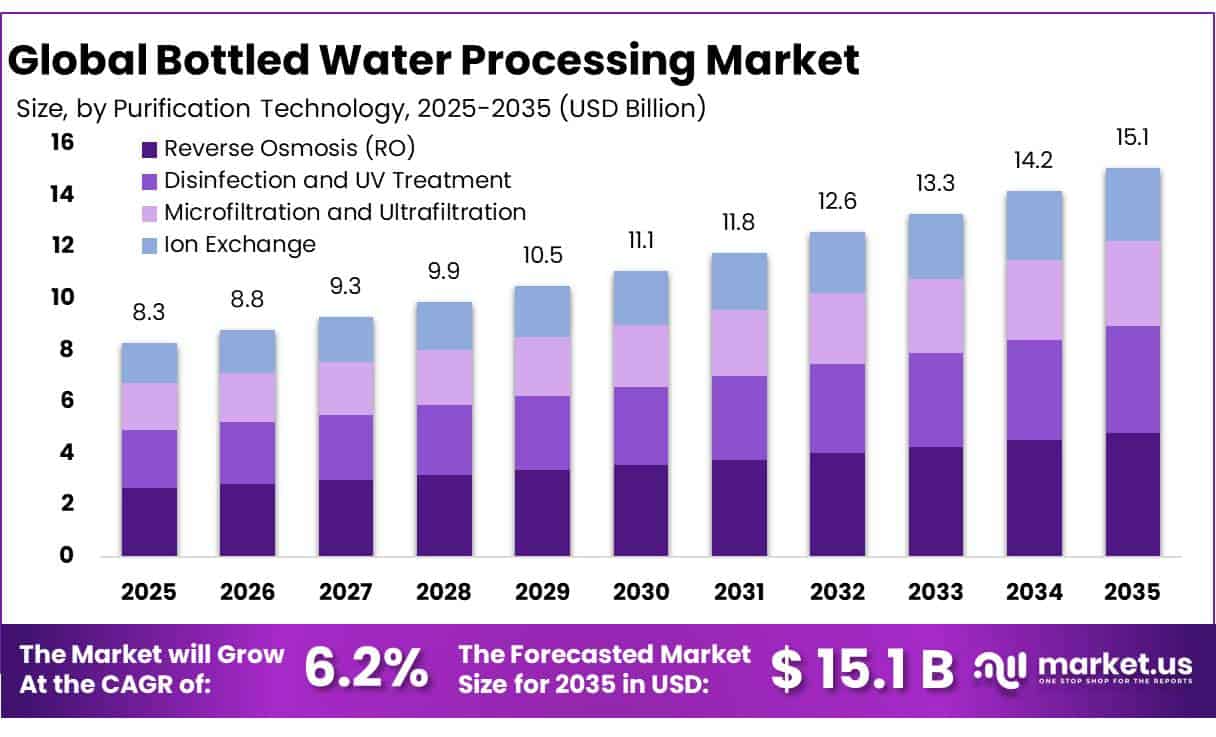
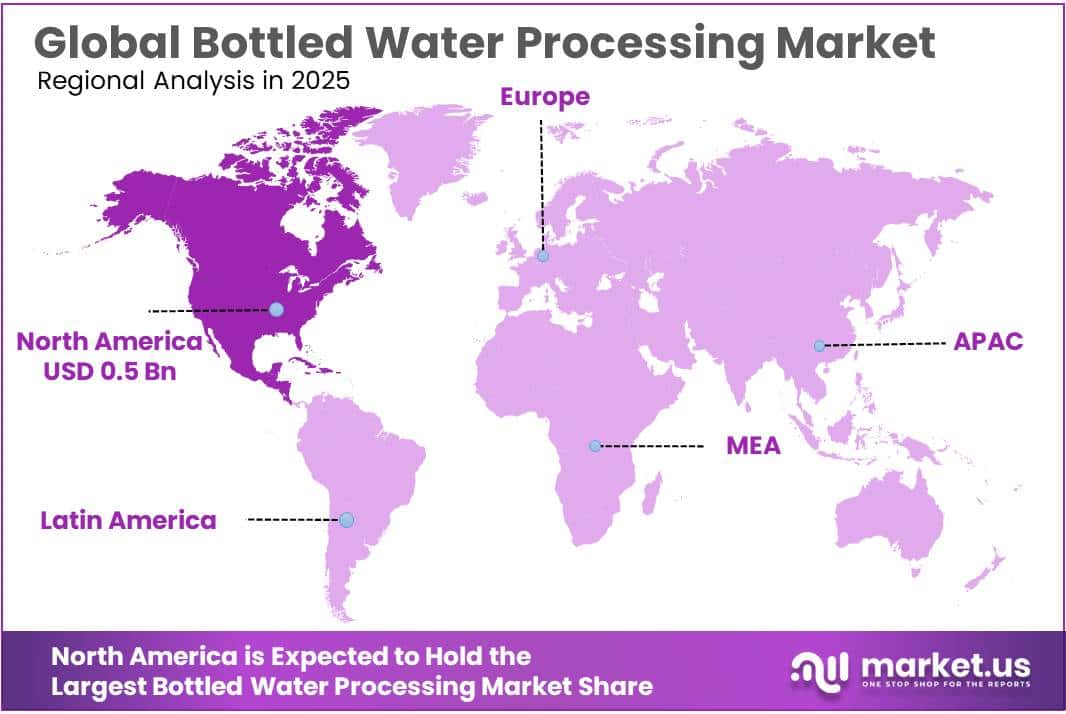
The Global Bottled Water Processing Market size is expected to be worth around USD 15.1 Billion by 2035, from USD 8.3 Billion in 2025, growing at a CAGR of 6.2% during the forecast period from 2026 to 2035. In 2025, North America held a dominant market position, capturing more than a 29.6% share, holding USD 0.5 Billion revenue.
The bottled water processing industry operates at the intersection of drinking-water safety, purification technology, packaging, and regulated food production. Demand for reliable processed drinking water remains supported by persistent gaps in safe-water access. In 2024, 2.1 billion people lacked safely managed drinking water worldwide, including 106 million people using untreated surface water.
- The U.S. FDA states that mineral water contains at least 250 parts per million of total dissolved solids, while absolute 1-micron filtration can remove particles larger than one micron. FDA also limits lead in bottled water to 5 parts per billion, creating strict requirements for source control and treatment performance.
Key Takeaways
- Bottled Water Processing Market size is expected to be worth around USD 15.1 Billion by 2035, from USD 8.3 Billion in 2025, growing at a CAGR of 6.2%.
- Filters and Membrane System held a dominant market position, capturing more than a 32.00% share.
- Reverse Osmosis (RO) held a dominant market position, capturing more than a 28.00% share.
- Still Water held a dominant market position, capturing more than a 57.40% share.
- Medium Capacity (10,000–30,000 BPH) held a dominant market position, capturing more than a 45.30% share.
- Plastic (PET / rPET) held a dominant market position, capturing more than a 79.60% share.
- North America remained the dominant regional market in 2025, accounting for 29.60% of the bottled water processing market, equal to about USD 0.59 billion.
Quality assurance remains one of the industry’s most important operating requirements. FDA guidance requires representative finished bottled-water samples to be tested for total coliform at least once every week, while chemical contaminant testing is generally required once annually and radiological testing of applicable source water is required at least once every four years.
- The U.S. EPA drinking-water standard sets maximum contaminant levels of 4.0 parts per trillion for PFOA, 4.0 parts per trillion for PFOS, and 10 parts per trillion for PFHxS. Although public-water and bottled-water regulations are administered separately, these stricter benchmarks are increasing attention toward granular activated carbon, ion exchange, nanofiltration and reverse-osmosis technologies throughout the water-treatment supply chain.
Packaging sustainability is also changing bottled-water processing lines. European Union rules establish a 77% separate-collection target for plastic bottles, rising to 90%, while PET beverage bottles are required to incorporate 25% recycled plastic under the applicable sustainability framework. These requirements are pushing processors toward lightweight bottles, recycled PET compatibility, improved bottle inspection and more efficient blow-moulding systems.
- UN-Water estimates that around 4 billion people experience severe water scarcity for at least one month annually, approximately 720 million people live in countries with high or critical water stress, and industry accounts for around 12% of global water withdrawals. This environment strengthens the business case for water recovery, lower-rinse filling lines and source-efficiency monitoring.
Government investment is strengthening the wider water-treatment technology base. The U.S. EPA announced USD 7.2 billion for State Revolving Fund programs in fiscal 2026, while federal infrastructure legislation provides more than USD 35 billion in dedicated safe-drinking-water funding. Such investment supports treatment-system modernization and helps expand expertise in membranes, contaminant monitoring, filtration, pumps, sensors and water-quality automation that can also benefit bottled-water processors. EPA Drinking Water State Revolving Fund EPA infrastructure resources
By Equipment Type Analysis
Filters and Membrane Systems lead the equipment category with more than a 32.00% share
In 2025, Filters and Membrane System held a dominant market position, capturing more than a 32.00% share. The segment benefits from its central role in removing suspended particles, dissolved minerals, microorganisms and emerging contaminants before water reaches the filling line.
Technology requirements are also becoming stronger as processors focus on contaminants that conventional treatment may not fully address. In its information updated in 2025, the U.S. EPA identified granular activated carbon, ion-exchange systems and reverse-osmosis filtration as technologies capable of substantially reducing PFAS in drinking water. EPA also recognizes reverse osmosis and other high-pressure membrane systems as important treatment options for difficult contaminants.
Government enforcement in 2025 further highlighted the importance of filling and sealing controls. During an FDA bottled-water facility inspection conducted on March 17–18, 2025, regulators emphasized that containers and closures must be sampled and inspected at least once each quarter, including bacteriological testing of at least four containers and closures selected immediately before filling and sealing.
By Purification Technology Analysis
Reverse Osmosis (RO) leads the purification technology category with more than a 28.00% share.
In 2025, Reverse Osmosis (RO) held a dominant market position, capturing more than a 28.00% share. RO remains widely suited to bottled-water processing because it forces water through a membrane to separate minerals and unwanted contaminants, helping processors maintain consistent purified-water quality.
Supporting the need for advanced purification, the U.S. FDA reported in 2025 that it tested 197 bottled-water samples for 18 types of PFAS, with PFAS detected in 10 samples.
Disinfection and UV Treatment continues to hold an important position in bottled-water purification because it helps control bacteria, viruses and other microorganisms without significantly changing the taste of treated water. In 2025, the U.S. CDC stated that ultraviolet light can kill parasites, bacteria and viruses in clear water and recommended filtration before UV treatment because suspended particles can reduce UV effectiveness.
By Application/Water Type Analysis
Still Water leads the bottled water processing market with more than a 57.40% share
In 2025, Still Water held a dominant market position, capturing more than a 57.40% share. The segment benefits from its simple product format, broad consumer acceptance and suitability for high-volume bottling lines. Still water processing typically focuses on filtration, purification, disinfection, hygienic filling and secure packaging without requiring a carbonation stage. Government health guidance continues to support regular consumption of plain water.
Consumer-health guidance also provides a favorable background for this segment. In 2026, the U.S. CDC specifically recommended water as an alternative to sugary drinks and included unsweetened bottled or sparkling water among suitable choices.
CDC data also indicate that about 30% of Americans aged 2 and older consume high levels of added sugar, while a typical 12-ounce regular soda contains about 42 grams of added sugar. This creates room for unsweetened sparkling water as processors expand low-calorie and no-added-sugar beverage portfolios.
Plant Capacity Analysis
Medium Capacity (10,000–30,000 BPH) leads with more than a 45.30% share
In 2025, Medium Capacity (10,000–30,000 BPH) held a dominant market position, capturing more than a 45.30% share. These production lines are well suited to bottled-water companies that need higher output without moving into very large, capital-intensive plants. Medium-capacity facilities can integrate water treatment, bottle rinsing, filling, capping, labeling and inspection while maintaining flexibility across bottle formats.
Low Capacity (Under 10,000 BPH) remains an important plant category for regional bottlers, new production facilities and companies serving limited geographic markets. These systems can offer simpler installation, easier product changeovers and lower infrastructure requirements while still supporting filtration, treatment, filling and capping operations. Regulatory standards, however, remain important regardless of production scale.
Packaging Material Analysis
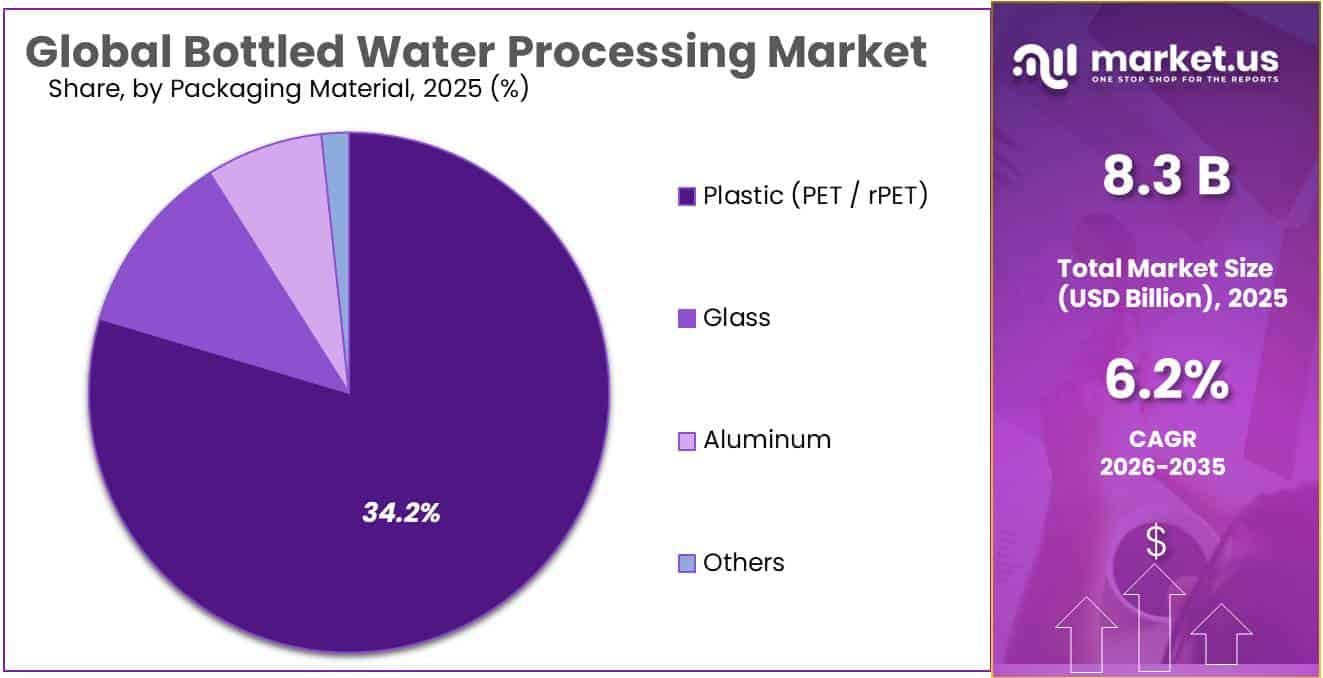
Plastic (PET / rPET) dominates the packaging material segment with more than a 79.60% share
In 2025, Plastic (PET / rPET) held a dominant market position, capturing more than a 79.60% share. PET remains the preferred material for bottled-water processing because it is lightweight, easy to transport and well suited to high-speed blowing, filling and capping lines.
Glass continues to hold an important position in bottled-water processing, particularly for premium mineral water, hospitality channels and reusable bottle systems. The material provides a rigid and chemically stable container and can support brands seeking a distinctive premium presentation. Government packaging policy is also strengthening the value of highly recyclable materials.
For 2025–2026, the UK Government set the Extended Producer Responsibility base fee for glass packaging at £192 per tonne, compared with £423 per tonne for plastic packaging. Looking toward the 2026–2027 EPR framework, government data indicate that around 91% of reported glass packaging tonnage falls within the higher-recyclability “green” category.
Key Market Segments
By Equipment Type
- Filters and Membrane Systems
- Fillers and Cappers
- Bottle Washers and Rinsers
- Blow Molders
- Shrink Wrappers and Packaging
By Purification Technology
- Reverse Osmosis (RO)
- Disinfection and UV Treatment
- Microfiltration and Ultrafiltration
- Ion Exchange
By Application / Water Type
- Still Water
- Sparkling / Carbonated Water
- Flavored and Functional Water
By Plant Capacity
- Low Capacity (Under 10,000 BPH)
- Medium Capacity (10,000–30,000 BPH)
- High Capacity (Over 30,000 BPH)
By Packaging Material
- Plastic (PET / rPET)
- Glass
- Aluminum
- Others
Driver Analysis
PFAS-Compliant Treatment Upgrades
PFAS regulation is converting water treatment from a standard filtration cost center into a high-value compliance-capex category: EU Member States began harmonized PFAS monitoring on 12 January 2026 under the recast Drinking Water Directive, using limits of 0.5 micrograms per liter for “PFAS total” and 0.1 micrograms per liter for the sum of 20 specified PFAS; meanwhile, FDA is developing bottled-water PFAS limits under 21 CFR 165.110 following EPA’s April 2024 drinking-water regulation and its May 2026 proposal to amend portions of that rule.
The processing implication is a move beyond conventional multimedia, activated-carbon, and UV treatment toward treatment trains combining reverse osmosis, granular activated carbon, ion exchange, ultraviolet oxidation, continuous conductivity control, and laboratory-grade sampling capability.
A medium-scale bottler processing 20-40 million liters annually can require an estimated USD 0.8-3.0 million for a compliance-grade retrofit when RO skids, polishing, reject-water management, online instrumentation, and validation costs are included; smaller operators face a 200-400 basis-point margin penalty if their production volumes cannot absorb this fixed cost.
Drivers Impact Analysis
| Driver | (~) % Impact on CAGR | Geographic Relevance | Impact Timeline |
|---|---|---|---|
| PFAS-compliant treatment upgrades | +1.4% | EU, North America, APAC export hubs | Medium term (2-4 years) |
| Functional hydration line expansion | +1.6% | North America, EU, APAC urban markets | Long term (≥ 4 years) |
| APAC high-throughput capacity buildout | +1.5% | China, India, Southeast Asia, South America | Short term (≤ 2 years) |
| rPET and PPWR line conversion | +1.1% | EU core, North America, APAC premium bottlers | Medium term (2-4 years) |
| Smart automation and digital QA | +0.9% | North America, EU, China, Japan, South Korea | Medium term (2-4 years) |
| Sparkling and aseptic premium formats | +0.8% | North America, EU, APAC premium channels | Long term (≥ 4 years) |
Restraint Analysis
Single-Use Bottle Bans
Institutional, government, airport, hospitality, and event-level bans on single-use plastic water bottles are directly reducing access to traditionally high-margin, impulse-purchase channels rather than merely altering packaging preferences. Himachal Pradesh banned 500 mL PET water bottles in government programmes and hotels from 1 June 2025, while San Francisco International Airport’s concession-wide restriction on single-use plastic water bottles applies to restaurants, cafés, and vending machines, forcing demand into refillable aluminum or glass alternatives.
These bans can remove nearly 100% of small-format PET volume from an affected institutional channel, disproportionately affecting processors optimized for 250-750 mL high-throughput PET formats, where rapid filling, cap application, shrink-labeling, and convenience distribution create the highest production velocity. The market impact is not a full loss of hydration demand, but a shift toward public refill systems, reusable bottles, glass, aluminum, and larger multi-serve formats; this reduces unit sales, disrupts PET-line utilization, and adds 6-18 months of retooling and packaging-validation work for operators pivoting to compliant formats.
A 10,000-20,000 bottles-per-hour line that loses even one major airport, university, government, or hospitality account can see annualized volume utilization fall by 3-8%, raising fixed conversion cost per bottle and compressing EBITDA margins by an estimated 100-250 basis points until alternative channels or package formats are secured.
Restraint Impact Analysis
| Restraint | (~) % Impact on CAGR | Geographic Relevance | Impact Timeline |
|---|---|---|---|
| Single-use bottle bans | -1.3% | North America, EU, India, APAC public channels | Short term (≤ 2 years) |
| PPWR packaging compliance | -1.1% | EU core, EU-linked exporters | Medium term (2-4 years) |
| PET/rPET cost volatility | -1.0% | Global; Europe, North America, APAC | Short term (≤ 2 years) |
| PFAS and microplastics CapEx | -0.8% | North America, EU, APAC export plants | Medium term (2-4 years) |
| Water-source access constraints | -0.7% | India, APAC, MENA, water-stressed regions | Long term (≥ 4 years) |
| Tap-water substitution pressure | -0.5% | North America, EU, Australia, developed APAC | Long term (≥ 4 years) |
Opportunity Analysis
Hospitality Water-as-a-Service
The economics can be compelling: one hotel dispenser program can reduce water-program cost and associated CO2 emissions by roughly 86% versus pre-bottled water while avoiding an average 1,115 pounds of waste annually per dispenser, shifting the value proposition from product volume to operating-cost and sustainability-KPI savings.
For a 150-room hotel using 1.0-1.5 liters per occupied room-night, an onsite system can displace roughly 55,000-82,000 liters of packaged-water demand annually; at a USD 0.20-0.50 per-liter delivered-cost differential, the customer payback can fall within 12-30 months, while the processing-equipment supplier earns installation revenue plus a three-to-five-year service annuity.
This is strategic white space because many conventional bottlers still treat hospitality as a distribution channel to defend rather than an installed-base opportunity to monetize; companies that offer lease, usage-based, or per-room subscription models can achieve 15-25% higher lifetime gross profit per account, lower customer-acquisition cost through multi-property hotel-chain contracts, and build switching costs through proprietary cartridges, telemetry, service records, and reusable-bottle logistics.
Opportunity Impact Analysis
| Opportunity | (~) % Potential CAGR Upside | Geographic Relevance | Execution Window |
|---|---|---|---|
| Hospitality water-as-a-service | +1.5% | EU, North America, MENA, APAC hotels | Medium term (2-4 years) |
| Reuse/refill processing networks | +1.3% | EU core, North America, developed APAC | Medium term (2-4 years) |
| PFAS-certified contract processing | +1.1% | North America, EU, APAC export hubs | Short term (≤ 2 years) |
| Decentralized micro-bottling systems | +1.0% | MENA, Africa, India, island markets | Long term (≥ 4 years) |
| Carbonation-as-a-service platforms | +0.8% | EU, North America, APAC premium markets | Long term (≥ 4 years) |
| Regional bottler M&A roll-ups | +0.7% | India, Southeast Asia, Africa, Latin America | Short term (≤ 2 years) |
Challenges Analysis
Water-Treatment Talent Shortage
Bottled-water plants increasingly require hybrid technical capability across hydrogeology, reverse-osmosis optimization, membrane chemistry, CIP/SIP sanitation, microbiological sampling, PFAS/trace-contaminant validation, PLC/SCADA troubleshooting, and food-safety documentation, yet the qualified operator base is aging faster than it is being replaced: about 30-50% of the water-sector workforce is expected to retire within the next decade, 88% of treatment-plant operators were already aged 45 or older in the cited U.S. workforce analysis, and the U.S. labor market still expects roughly 10,700 water-treatment-operator openings annually through 2034 despite projected net employment decline.
This produces a measurable operating penalty because plants must use higher-paid contract technicians, maintain more conservative preventive-maintenance intervals, and carry greater redundancy in critical RO, UV, ozone, and filling-equipment roles; a 24/7 medium-scale facility can face an estimated USD 80,000–250,000 annual incremental payroll and contractor burden when it cannot fill two to four specialized positions.
Challenges Impact Analysis
| Challenge | (~) % CAGR Friction | Geographic Relevance | Mitigation Horizon |
|---|---|---|---|
| Water-treatment talent shortage | -0.9% | North America, EU, Australia, developed APAC | Long term (≥ 4 years) |
| Resin and component logistics | -0.8% | EU, MENA, APAC shipping corridors | Medium term (2-4 years) |
| Source-water quality volatility | -0.7% | India, MENA, Africa, APAC | Long term (≥ 4 years) |
| OT cybersecurity exposure | -0.6% | North America, EU, China, Japan, South Korea | Medium term (2-4 years) |
| Multi-SKU changeover complexity | -0.5% | Global premium bottling hubs | Medium term (2-4 years) |
| Wastewater and reject handling | -0.5% | Water-stressed APAC, MENA, EU | Long term (≥ 4 years) |
Geopolitical Impact Analysis
Ongoing conflict in the Middle East, together with the continuing Russia–Ukraine war, is increasing cost pressure across the bottled water processing industry. The main impact comes through energy, shipping, packaging materials, and imported processing equipment. PET resin production, bottle blowing, filtration, refrigeration, filling, and transport all depend heavily on stable fuel and electricity costs.
- In July 2026, the U.S. Energy Information Administration reported that Brent crude averaged USD 85 per barrel in June, after reaching a 2026 peak that was USD 32 per barrel higher, showing how quickly conflict-related supply disruption can affect industrial operating costs.
The IMF reported in April 2026 that Bab el-Mandeb transits remained at roughly half of pre-attack levels, highlighting continuing pressure on maritime logistics. For bottled water processors, these conditions encourage local sourcing, larger safety stocks, energy-efficient equipment, lightweight packaging, and diversified suppliers.
Regional Insights
North America remained the dominant regional market in 2025, accounting for 29.60% of the bottled water processing market, equal to about USD 0.59 billion. The region benefits from established bottled-water production, automation, quality standards, and investment in filtration, filling, inspection, and packaging systems.
- In 2025, the U.S. EPA made USD 6.5 billion available through WIFIA, with another USD 550 million for state infrastructure financing. EPA also identified USD 107 billion in treatment-related drinking-water infrastructure needs. These investments strengthen the water-treatment technology ecosystem and support demand for advanced purification and processing equipment across North America.
Asia Pacific is emerging as the fastest-growing regional opportunity as urban populations expand, packaged-water consumption rises, and governments improve access to safe drinking water. The region has beverage manufacturers adding automated treatment, bottling, and packaging capacity.
UNICEF reported in 2026 that 95% of the East Asia and Pacific population had access to basic drinking water, yet the remaining 5%, or 112 million people, still lacked access. In the Pacific, the urban population with safely managed drinking water increased from 715,000 to 1.2 million. These gaps create opportunities for purification, membrane, disinfection, filling, and water-quality monitoring technologies.
Key Regions and Countries Insights
- North America
- US
- Canada
- Europe
- Germany
- France
- The UK
- Spain
- Italy
- Rest of Europe
- Asia Pacific
- China
- Japan
- South Korea
- India
- Australia
- Rest of APAC
- Latin America
- Brazil
- Mexico
- Rest of Latin America
- Middle East & Africa
- GCC
- South Africa
- Rest of MEA
Key Players Analysis
Prysmian S.p.A. is primarily a global cable and electrification solutions company rather than a direct bottled water processing equipment supplier. In 2025, the group generated €19.65 billion in revenue, with adjusted EBITDA of €2.398 billion and net profit of €1.270 billion. Its workforce reached 32,608 employees at year-end. The company also reported a transmission backlog of about €17 billion.
Nexans S.A. is an electrification and cable systems manufacturer and is not a core supplier of bottled water processing machinery. In 2025, the company recorded €7.81 billion in current sales and €6.10 billion in standard sales, while adjusted EBITDA reached €728 million. Net income stood at €358 million and free cash flow reached €344 million.
NKT A/S operates in high-voltage and power cable solutions rather than bottled water processing equipment. In 2025, the company generated €2.722 billion in revenue at standard metal prices, representing 6% organic growth, while operational EBITDA reached €390 million. NKT employed 6,627 people and ended the year with a high-voltage order backlog of €10.2 billion.
Top Key Players Outlook
- Prysmian S.p.A.
- Nexans S.A.
- NKT A/S
- Sumitomo Electric Industries, Ltd.
- LS Cable & System Ltd.
- Southwire Company, LLC
- TE Connectivity Ltd.
- Hitachi Energy Ltd.
- TBEA Co., Ltd.
- Hengtong Group Co., Ltd.
- ZTT Group
- Taihan Cable & Solution Co., Ltd.
- Elsewedy Electric Co. S.A.E.
- Furukawa Electric Co., Ltd.
- Brugg Kabel AG
Recent Developments
- May 2026 Sumitomo Electric Industries, Ltd announced plans to invest a cumulative ¥1 trillion during FY2026–FY2028, targeting ¥6 trillion in sales and ¥600 billion in operating profit by FY2028. Sumitomo Electric had already reported FY2025 net sales of ¥5.11 trillion and operating income of ¥418.2 billion.
- June 2026 Hitachi Energy began construction of a USD 457 million large-transformer facility in Virginia that is expected to create about 825 jobs.
Report Scope
| Report Features | Description |
|---|---|
| Market Value (2025) | USD 8.3 Bn |
| Forecast Revenue (2035) | USD 15.1 Bn |
| CAGR (2026-2035) | 6.2% |
| Base Year for Estimation | 2025 |
| Historic Period | 2020-2024 |
| Forecast Period | 2026-2035 |
| Report Coverage | Revenue Forecast, Market Dynamics, Competitive Landscape, Recent Developments |
| Segments Covered | By Equipment Type (Filters and Membrane Systems, Fillers and Cappers, Bottle Washers and Rinsers, Blow Molders, Shrink Wrappers and Packaging), By Purification Technology (Reverse Osmosis (RO), Disinfection and UV Treatment, Microfiltration and Ultrafiltration, Ion Exchange), By Application / Water Type (Still Water, Sparkling / Carbonated Water, Flavored and Functional Water), By Plant Capacity (Low Capacity (Under 10,000 BPH), Medium Capacity (10,000–30,000 BPH), High Capacity (Over 30,000 BPH)), By Packaging Material ((Plastic (PET / rPET), Glass, Aluminum, Others)) |
| Regional Analysis | North America – US, Canada; Europe – Germany, France, The UK, Spain, Italy, Rest of Europe; Asia Pacific – China, Japan, South Korea, India, Australia, Singapore, Rest of APAC; Latin America – Brazil, Mexico, Rest of Latin America; Middle East & Africa – GCC, South Africa, Rest of MEA |
| Competitive Landscape | Prysmian S.p.A., Nexans S.A., NKT A/S, Sumitomo Electric Industries, Ltd., LS Cable & System Ltd., Southwire Company, LLC, TE Connectivity Ltd., Hitachi Energy Ltd., TBEA Co., Ltd., Hengtong Group Co., Ltd., ZTT Group, Taihan Cable & Solution Co., Ltd., Elsewedy Electric Co. S.A.E., Furukawa Electric Co., Ltd., Brugg Kabel AG |
| Customization Scope | Customization for segments, region/country-level will be provided. Moreover, additional customization can be done based on the requirements. |
| Purchase Options | We have three licenses to opt for: Single User License, Multi-User License (Up to 5 Users), Corporate Use License (Unlimited User and Printable PDF) |





































