


Report Overview
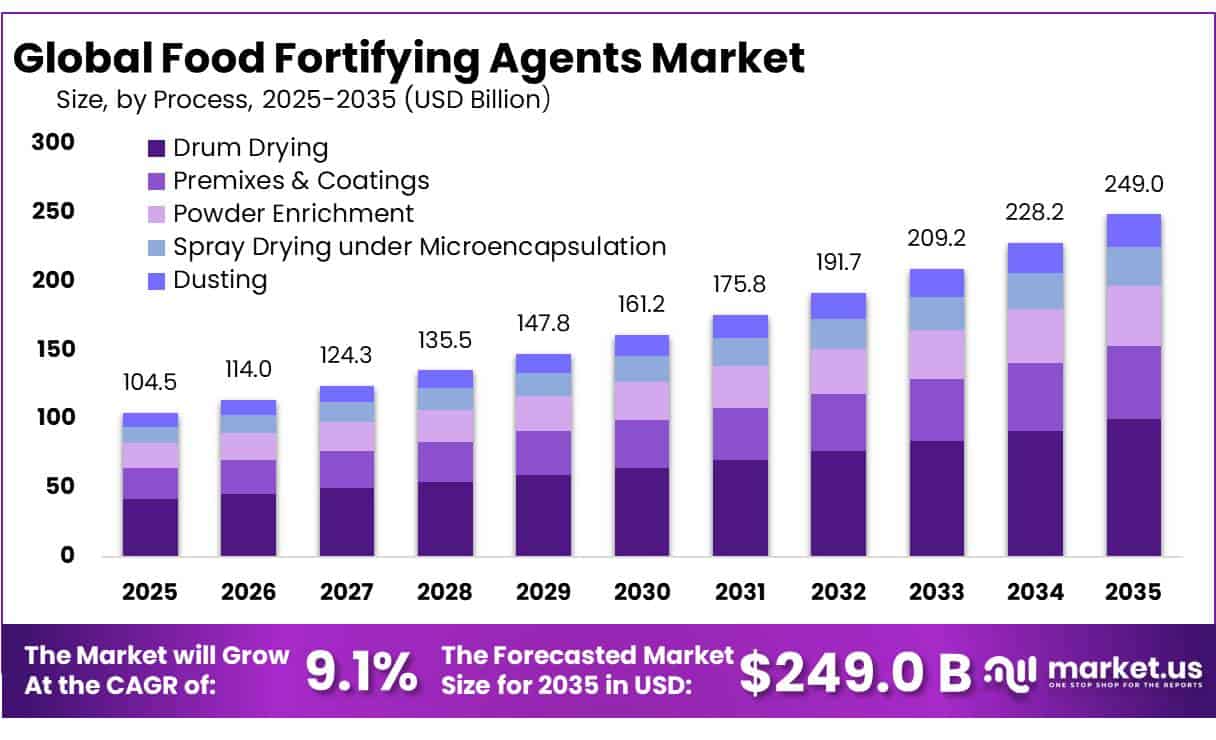
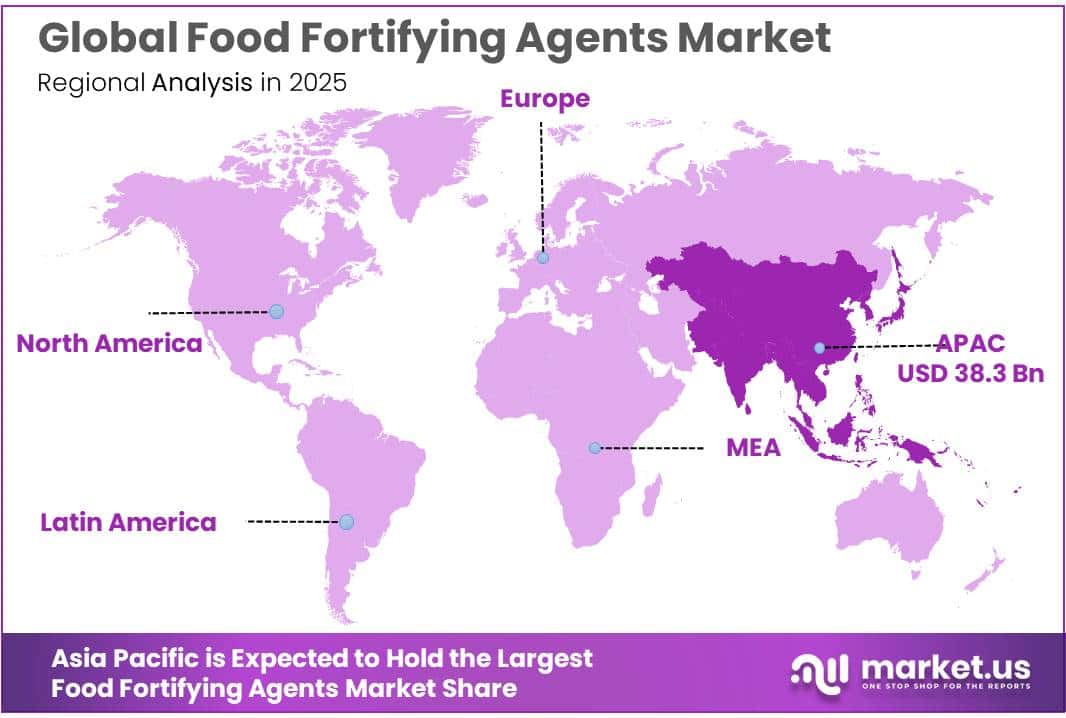
In 2025, the Global Food Fortifying Agents Market valued at USD 104.5 billion, and between 2026 and 2035, this market is estimated to register a CAGR of 9.1%, reaching about USD 249.0 billion by 2035. Asia Pacific held a dominant market position, capturing more than a 36.7% share, holding USD 38.3 billion in revenue.
The food fortifying agents industry is an important part of the global nutrition and food-processing supply chain. Fortifying agents include vitamins, minerals, amino acids and micronutrient premixes added to flour, rice, salt, edible oil, dairy products and cereals. WHO notes that the human body requires about 30 essential micronutrients, including 13 vitamins and 16 minerals, supporting demand for iron, iodine, zinc, calcium, folic acid and vitamin-based ingredients.
- WHO reported in 2025 that anaemia affected 40% of children aged 6–59 months, 37% of pregnant women and 30% of women aged 15–49 worldwide. These figures strengthen the role of iron, folate and vitamin fortification in staple foods and create steady demand from food processors and public nutrition programs.
Key Takeaways
- Food Fortifying Agents Market valued at USD 104.5 billion, and between 2026 and 2035, this market is estimated to register a CAGR of 9.1%, reaching about USD 249.0 billion by 2035.
- Vitamins held a dominant market position, capturing more than a 31.4% share in the Food Fortifying Agents Market.
- Drum Drying held a dominant market position, capturing more than a 40.1% share in the Food Fortifying Agents Market.
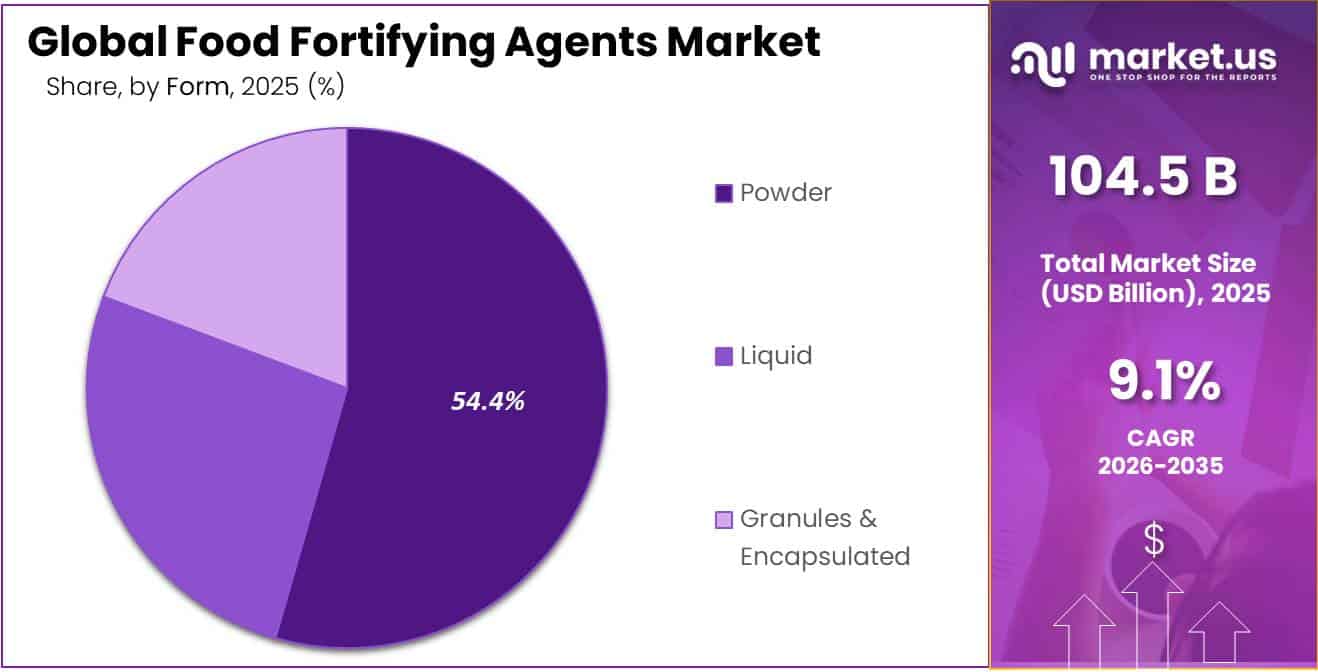
- Powder held a dominant market position, capturing more than a 55.4% share in the Food Fortifying Agents Market.
- Dairy & Dairy-Based Products held a dominant market position, capturing more than a 30.1% share in the Food Fortifying Agents Market.
- Asia Pacific held the dominant position in the Food Fortifying Agents Market in 2025, accounting for 36.7% of global revenue and generating USD 38.36 billion.
Food affordability is another major demand driver. FAO’s 2025 food-security assessment estimated that around 645 million people faced hunger and about 2.7 billion people could not afford a healthy diet. Fortification therefore gives manufacturers and governments a practical way to increase nutrient density without major changes in eating patterns. WHO also recognizes large-scale fortification as a cost-effective intervention against vitamin and mineral deficiencie.
- Government action is supporting market development. The United Kingdom requires non-wholemeal wheat flour to contain 0.25 milligrams of folic acid per 100 grams from 13 December 2026, with the policy expected to reduce neural-tube-defect rates by around 20%. The government states that more than 60 countries already use wheat-flour folic acid fortification through mandatory or voluntary programs. Egypt also revived its national wheat-flour fortification program in March 2025, focusing on iron and folic acid.
Global regulatory coverage provides a strong industrial base. The Food Fortification Initiative reported in August 2026 that 86 countries had legislation requiring fortification of at least one industrially milled cereal grain, including 85 countries with wheat-flour mandates alone or combined with other grains. This supports recurring demand for micronutrient compounds, premix formulation, blending technologies and compliance-testing services.
Future growth opportunities are expected from better fortification quality, wider staple-food coverage and improved processing stability. The Micronutrient Forum’s Fortification Collaborative is targeting at least 90% compliance for mandated food vehicles and 100% quality-assured premixes through 2030. Africa also offers expansion potential, where 29 countries already mandate wheat-flour fortification.
By Type Analysis
Vitamins lead the Food Fortifying Agents Market with a 31.4% share, supported by expanding staple-food fortification
In 2025, Vitamins held a dominant market position, capturing more than a 31.4% share in the Food Fortifying Agents Market. Their leading position is supported by the widespread use of folic acid, vitamin D, vitamin A, thiamin and other vitamins in flour, cereals, dairy products and nutritional foods. Government-backed fortification is strengthening this demand.
- In 2026, the UK government confirmed that non-wholemeal wheat flour will contain 0.25 mg of folic acid per 100 g of flour, while government data show that 99% of UK households buy bread, giving vitamin fortification broad consumer reach. This regulatory approach encourages food manufacturers to use standardized vitamin ingredients that can maintain nutrient stability during processing and storage.
Minerals represent an important segment of the Food Fortifying Agents Market, supported mainly by the use of iron, calcium, zinc and iodine in flour, cereals, dairy products, salt and other everyday foods. Their demand is closely connected with public-health efforts to address mineral deficiencies through widely consumed food products. In its 2025 update, the World Health Organization reported that anaemia affects around 40% of children aged 6–59 months, 37% of pregnant women, and 30% of women aged 15–49 years worldwide.
By Process Analysis
Drum Drying leads the Food Fortifying Agents Market with a 40.1% share due to efficient conversion of liquid formulations into stable powders
In 2025, Drum Drying held a dominant market position, capturing more than a 40.1% share in the Food Fortifying Agents Market. The process remains important because it can convert food slurries and nutrient-containing formulations into dry powders or fine flakes that are easier to blend, store and transport.
The U.S. Department of Agriculture’s 2025 Handling Sunset Review explains that drum drying applies a puree or slurry onto one or two heated cylinders, where the rotating surface removes moisture and produces powder or fine flakes. The same review recognizes mono- and diglycerides specifically for use in drum drying of food, highlighting the process’s established role in commercial food manufacturing.
In March 2025, Egypt launched a national flour fortification program using premixes containing iron and folic acid. The World Food Programme reported that more than 600 millers were trained to support the program, while fortified subsidized bread was planned for 13 governorates. The program also secured fortification premix supplies for its initial phase, showing how government-backed nutrition programs can directly support demand for standardized premix systems and reliable micronutrient incorporation technologies.
By Form Analysis
Powder dominates the Food Fortifying Agents Market with a 55.4% share, supported by easy blending and stable nutrient delivery
In 2025, Powder held a dominant market position, capturing more than a 55.4% share in the Food Fortifying Agents Market. Powdered fortifying agents are widely preferred because they can be accurately measured, evenly mixed with dry foods, stored for longer periods, and transported efficiently. Their use is particularly important in flour, cereals, bakery ingredients, powdered beverages, and nutritional premixes.
- Government fortification rules also support their industrial use. Under UK government requirements taking effect in 2026, non-wholemeal wheat flour must contain at least 2.10 mg of iron per 100 g, while folic acid must be added at 0.250 mg per 100 g. These mandatory nutrient levels support consistent demand for powdered iron compounds, folic acid, and micronutrient premixes that can be accurately incorporated during large-scale flour processing.
Liquid fortifying agents represent an important form in the Food Fortifying Agents Market, particularly for edible oils, dairy drinks, nutritional beverages, syrups, and other products where nutrients need to disperse uniformly through a fluid base. Liquid formulations can simplify dosing during continuous processing and are especially useful for fat-soluble nutrients that need effective distribution throughout oil-based foods.
By Application Analysis
Dairy & Dairy-Based Products dominate the Food Fortifying Agents Market with a 30.1% share, supported by their strong nutritional role and large processing base
In 2025, Dairy & Dairy-Based Products held a dominant market position, capturing more than a 30.1% share in the Food Fortifying Agents Market. Dairy products provide a practical base for adding vitamins, minerals, calcium, vitamin D, and other micronutrients because milk, yogurt, cheese, and dairy beverages are consumed regularly across a broad population. The large scale of dairy processing also supports continuous demand for fortifying ingredients.
- According to the U.S. Department of Agriculture, U.S. milk production reached 232 billion pounds in 2025, increasing 2.6% from the previous year. USDA’s July 2026 outlook further forecast milk production at 236.6 billion pounds for 2026. This sizeable processing volume creates a strong industrial platform for fortified milk, nutritional dairy beverages, and other value-added dairy foods.
Cereals & Cereal-Based Products represent an important application area for food fortifying agents because flour, bread, breakfast cereals, and other grain foods provide an efficient route for delivering nutrients to large populations. Government fortification requirements are strengthening this application.
UK rules require non-wholemeal common wheat flour to contain at least 2.10 mg of iron per 100 g, 2.40 mg of niacin, and 0.24 mg of thiamin. Calcium carbonate must be present between 300 mg and 455 mg per 100 g, while folic acid must be added at 0.250 mg per 100 g. These defined nutrient levels create consistent demand for vitamin and mineral fortifying agents, premixes, precision dosing systems, and quality-control solutions across commercial flour and cereal processing.
Key Market Segments
By Type
- Vitamins
- Minerals
- Prebiotics & Probiotics
- Proteins & Amino Acids
- Lipids
- Carbohydrates & Dietary Fibers
- Others
By Process
- Drum Drying
- Premixes & Coatings
- Powder Enrichment
- Spray Drying under Microencapsulation
- Dusting
By Form
- Powder
- Liquid
- Granules & Encapsulated
By Application
- Dairy & Dairy-Based Products
- Cereals & Cereal-Based Products
- Dietary Supplements
- Beverages
- Infant Formula
- Bulk Food Items (Flour, Rice, Salt, Sugar)
- Fats & Oils
- Animal Feed
- Others
Driver Analysis
Anti-anaemia staple fortification mandates
Anaemia and micronutrient deficiency remain the central volume catalyst for iron, folic acid, vitamin B12, vitamin A, iodine, zinc, and related premix demand. WHO estimates indicate that anaemia affects roughly 40% of children under five and 37% of pregnant women globally, while 2019 estimates placed the number of anaemic children aged 6–59 months at 269 million and women aged 15–49 years at more than 500 million.
This converts food fortification from a discretionary health-positioning tool into a population-scale intervention embedded in staples—wheat flour, maize flour, rice, edible oils, sugar, and salt. More than 150 countries had voluntary or mandatory food-fortification legislation by July 2024, expanding the addressable regulatory base for nutrient suppliers and premix blenders.
Evidence supports long-run adoption: Kenya’s mandatory wheat- and maize-flour fortification was associated with a 10% fall in anaemia among women of reproductive age over four years, strengthening the policy case for replicating such programs in high-burden markets.
Drivers Impact Analysis
| Driver | (~) % Impact on CAGR | Geographic Relevance | Impact Timeline |
|---|---|---|---|
| Anti-anaemia staple fortification mandates | +2.3 pp | South Asia, Sub-Saharan Africa, SE Asia | Medium term (2–4 years) |
| Public nutrition procurement for fortified rice and flour | +1.9 pp | India core, Indonesia, Africa corridors | Short term (≤ 2 years) |
| Vitamin D expansion in dairy and plant-based foods | +1.4 pp | North America, Europe, Oceania | Short term (≤ 2 years) |
| Functional foods and healthy-aging formulations | +1.7 pp | North America, EU, Japan, China, GCC | Medium term (2–4 years) |
| Premium bioavailable and clean-label nutrient forms | +1.2 pp | North America, EU, developed APAC | Medium term (2–4 years) |
| Compliance, analytics, and premix standardization | +0.9 pp | Global, led by regulated markets | Long term (≥ 4 years) |
Restraint Analysis
Vitamin supply concentration
The strongest near-term restraint is concentrated upstream vitamin capacity, particularly for vitamins A, E, D3, selected B vitamins, and amino-acid intermediates, which leaves food-premix producers exposed to outages, environmental inspections, plant incidents, and export disruptions in a limited number of manufacturing geographies. Industry reporting in early 2026 indicated that more than 73% of vitamins used in the United States originate in China, while the July 2024 disruption at BASF’s Ludwigshafen complex constrained global vitamins A and E availability and contributed to estimated price increases of roughly 30–60% in affected categories.
For a fortifying-agent blender, a 30% increase in the price of a high-potency vitamin does not translate linearly to total premix cost, but it can raise the cost of vitamin-heavy formulations by an estimated 8–18%, particularly in dairy, edible-oil, beverage, infant-nutrition, and multinutrient applications. Customers with annual supply contracts may defer launches, reformulate downward, or replace premium nutrient forms with lower-cost alternatives, reducing volume growth and compressing premix gross margins where price pass-through lags by one to two procurement cycles.
Restraint Impact Analysis
| Restraint | (~) % Impact on CAGR Forecast | Geographic Relevance | Impact Timeline |
|---|---|---|---|
| Vitamin supply concentration | -2.1 pp | North America, EU, India, MEA | Short term (≤ 2 years) |
| Freight, tariffs, FX volatility | -1.6 pp | Import-dependent APAC, MEA, LatAm | Short term (≤ 2 years) |
| Premix cost pressure | -1.4 pp | India, Africa, SE Asia | Medium term (2–4 years) |
| Fragmented regulations | -1.2 pp | EU, UK, North America, APAC | Medium term (2–4 years) |
| Quality-control gaps | -1.3 pp | South Asia, Africa, LatAm | Medium term (2–4 years) |
| Sensory and stability losses | -0.9 pp | Global, especially staples | Long term (≥ 4 years) |
Opportunity Analysis
Plant-based nutrition premixes
Plant-based beverages, yogurts, meat alternatives, and high-protein foods remain underpenetrated as a structured fortification channel because many brands still formulate nutrition reactively, using isolated calcium or vitamin B12 additions rather than complete, shelf-stable nutrition systems.
Canada’s 2026 framework illustrates the gap: cow’s milk and margarine must contain higher vitamin D levels, while plant-based beverages are permitted to match milk’s level of 2 µg per 100 mL, or 5 µg per 250 mL serving, but are not required to do so; yogurt and kefir may also be fortified voluntarily, with plain dairy yogurt permitted at 5 µg per 100 g and plain kefir at 2.7 µg per 100 mL.
A supplier that converts a conventional single-nutrient sale into a calcium–vitamin D–B12–iodine–zinc turnkey premix can increase nutrient value per customer formulation by an estimated 2.0–3.5 times, reduce a brand’s formulation-development cycle from 12–16 weeks to 4–8 weeks, and establish recurring specification-based revenue across multiple stock-keeping units.
Opportunity Impact Analysis
| Opportunity | (~) % Potential CAGR | Geographic Relevance | Execution Window |
|---|---|---|---|
| Plant-based nutrition premixes | +2.0 pp | North America, EU, APAC metros | Short term (≤ 2 years) |
| Digital compliance-as-a-service | +1.6 pp | Africa, South Asia, SE Asia | Medium term (2–4 years) |
| Fermentation-derived nutrients | +1.8 pp | EU, North America, Japan, Korea | Medium term (2–4 years) |
| Oil and fat fortification platforms | +1.5 pp | MEA, South Asia, LatAm | Medium term (2–4 years) |
| Food-to-food fortification blends | +1.3 pp | Africa, India, SE Asia | Medium term (2–4 years) |
| Local premix M&A roll-ups | +1.1 pp | Africa, LatAm, ASEAN | Long term (≥ 4 years) |
Challenges Analysis
Weak enforcement and monitoring capacity
Regulatory enforcement across large-scale fortification programs remains structurally under-resourced, with compliance rates for mandatory maize-flour fortification reported to range from below 5% in some markets to 70–86% in others such as Mozambique and South Africa, reflecting a systemic gap between legislated standards and field-level verification.
This friction translates into an estimated 1.8 percentage-point drag on the market’s realizable CAGR because uncertain enforcement discourages millers and processors from consistently reordering premix at prescribed dosing levels, generating irregular procurement cycles rather than steady-state industrial demand.
Challenges Impact Analysis
| Challenge | (~) % CAGR Friction | Geographic Relevance | Mitigation Horizon |
|---|---|---|---|
| Weak enforcement and monitoring capacity | -1.8 pp | Sub-Saharan Africa, South Asia, SE Asia | Long term (≥ 4 years) |
| Laboratory and testing infrastructure gaps | -1.4 pp | Africa, South Asia, LatAm | Medium term (2–4 years) |
| Skilled technical talent shortages | -1.1 pp | Nigeria, East Africa, South Asia | Long term (≥ 4 years) |
| Premix reconciliation and coverage data gaps | -1.0 pp | ECSA/SADC Africa, South Asia | Medium term (2–4 years) |
| Cold-chain and last-mile distribution friction | -0.9 pp | Rural Africa, South Asia, LatAm | Medium term (2–4 years) |
| Over/under-fortification calibration risk | -0.7 pp | Global, high-volume staple programs | Long term (≥ 4 years) |
Geopolitical Impact Analysis
The continuing Russia–Ukraine war and renewed Middle East tensions are creating fresh cost and supply risks for the Food Fortifying Agents market. Producers of vitamins, mineral salts, iron compounds, folic acid and micronutrient premixes depend on energy-intensive manufacturing, international shipping and reliable food-processing demand.
- The pressure is visible in current commodity markets. The World Bank expects overall commodity prices to increase 16% in 2026, with energy prices rising 24% and fertilizer prices about 31% because of major Middle East supply disruptions. U.S. Energy Information Administration data show oil flows through the Strait of Hormuz averaged only 4.9 million barrels per day in the second quarter of 2026, compared with 21.6 million barrels per day in the fourth quarter of 2025.
For fortifying-agent suppliers, these disruptions can mean higher freight, packaging and processing expenses, longer delivery times and greater inventory requirements. At the same time, the situation encourages manufacturers to diversify sourcing, establish regional premix capacity and hold strategic stocks of key micronutrients for large food processing customers. These shifts create opportunities for suppliers offering stable, traceable and locally available fortification ingredients.
Regional Insights
Asia Pacific Leads the Food Fortifying Agents Market with a 36.7% Share and USD 38.36 Billion Value
Asia Pacific held the dominant position in the Food Fortifying Agents Market in 2025, accounting for 36.7% of global revenue and generating USD 38.36 billion. The region benefits from a large food-processing base, rising consumption of fortified packaged foods, and micronutrient concerns.
- USDA reported in 2026 that China had more than 100,000 registered food-processing companies in 2025, with sector revenue estimated at USD 2.5 trillion. WHO’s Western Pacific data also show anaemia prevalence of 18.6% among pregnant women and 16.5% among women of reproductive age, supporting continued use of iron, folate, vitamins, and mineral premixes across staple and processed foods.
Latin America is positioned as a fast-growing regional market for food fortifying agents as processors expand capacity and demand more high-value ingredients. USDA’s 2026 Brazil food-processing report stated that sector revenue reached USD 248 billion in 2025, increasing 8% from the previous year. The report also noted that the industry relies on imported high-value micro-ingredients, supporting opportunities for vitamin blends, mineral salts, premixes, and functional fortification systems.
Key Regions and Countries Insights
- North America
- US
- Canada
- Europe
- Germany
- France
- The UK
- Spain
- Italy
- Rest of Europe
- Asia Pacific
- China
- Japan
- South Korea
- India
- Australia
- Rest of APAC
- Latin America
- Brazil
- Mexico
- Rest of Latin America
- Middle East & Africa
- GCC
- South Africa
- Rest of MEA
Key Players Analysis
Koninklijke DSM-Firmenich AG remains a major supplier of vitamins, nutritional premixes, taste systems, and health-focused food ingredients. In 2025, continuing operations generated €9.034 billion in sales and €1.772 billion in adjusted EBITDA. Its Taste, Texture & Health business recorded €3.146 billion in sales, while Health, Nutrition & Care generated €2.102 billion. Taste, Texture & Health achieved 4% organic sales growth and a 20.6% adjusted EBITDA margin, supporting its strong position in fortified foods and nutrition applications across global consumer markets.
BASF SE supports the Food Fortifying Agents market through vitamins, carotenoids, nutritional ingredients, and formulation solutions supplied by its Nutrition & Health activities. In 2025, the Nutrition & Care segment generated €6.509 billion in sales, including €1.744 billion from Nutrition & Health. Segment EBITDA before special items reached €649 million, while research and development expenses totaled €137 million. BASF also reported that vitamin A, vitamin E, and carotenoid production largely normalized by the end of 2025 after earlier supply disruption.
Archer Daniels Midland Company (ADM) serves the Food Fortifying Agents market through human nutrition, specialty ingredients, flavors, health and wellness solutions, and food formulation capabilities. In 2025, ADM’s Nutrition segment delivered $417 million in operating profit, rising 8% year over year. Human Nutrition contributed $319 million, while Animal Nutrition generated $98 million. Specialty Ingredients continued its recovery during the year, and stronger flavor performance supported the portfolio, giving ADM a broad platform for fortified foods, beverages, and functional nutrition products.
Top Key Players Outlook
- Koninklijke DSM-Firmenich AG
- BASF SE
- Archer Daniels Midland Company (ADM)
- Cargill, Incorporated
- Kerry Group plc
- Ingredion Incorporated
- Tate & Lyle PLC
- Glanbia plc
- Corbion N.V.
- Nutreco N.V.
- Chr. Hansen Holding A/S
- Arla Foods Ingredients Group P/S
- Barentz International B.V.
- Watson Inc.
- Bühler Group
Recent Developments
- In June 2026, Cargill, Incorporated announced approximately €56 million of investment across Belgian food manufacturing and R&D facilities, including a new extrusion pilot plant.
- In February 2026, Kerry reported 2025 revenue of €6.758 billion, EBITDA of €1.208 billion, and nutritional reach of 1.46 billion consumers, showing the scale of its nutrition-focused business.
- In June 2026, Ingredion announced a recommended all-cash acquisition of Tate & Lyle, a major supplier of sweetening, mouthfeel and fortification solutions, at an enterprise value of about £3.7 billion (USD 5.0 billion).
Report Scope
| Report Features | Description |
|---|---|
| Market Value (2025) | USD 104.5 Bn |
| Forecast Revenue (2035) | USD 249.0 Bn |
| CAGR (2026-2035) | 9.1% |
| Base Year for Estimation | 2025 |
| Historic Period | 2020-2024 |
| Forecast Period | 2026-2035 |
| Report Coverage | Revenue Forecast, Market Dynamics, Competitive Landscape, Recent Developments |
| Segments Covered | By Type (Vitamins, Minerals, Prebiotics & Probiotics, Proteins & Amino Acids, Lipids, Carbohydrates & Dietary Fibers, Others), By Process (Drum Drying, Premixes & Coatings, Powder Enrichment, Spray Drying under Microencapsulation, Dusting), By Form (Powder, Liquid, Granules & Encapsulated), By Application (Dairy & Dairy-Based Products, Cereals & Cereal-Based Products, Dietary Supplements, Beverages, Infant Formula, Bulk Food Items (Flour, Rice, Salt, Sugar), Fats & Oils, Animal Feed, Others) |
| Regional Analysis | North America – US, Canada; Europe – Germany, France, The UK, Spain, Italy, Rest of Europe; Asia Pacific – China, Japan, South Korea, India, Australia, Singapore, Rest of APAC; Latin America – Brazil, Mexico, Rest of Latin America; Middle East & Africa – GCC, South Africa, Rest of MEA |
| Competitive Landscape | Koninklijke DSM-Firmenich AG, BASF SE, Archer Daniels Midland Company (ADM), Cargill, Incorporated, Kerry Group plc, Ingredion Incorporated, Tate & Lyle PLC, Glanbia plc, Corbion N.V., Nutreco N.V., Chr. Hansen Holding A/S, Arla Foods Ingredients Group P/S, Barentz International B.V., Watson Inc., Bühler Group |
| Customization Scope | Customization for segments, region/country-level will be provided. Moreover, additional customization can be done based on the requirements. |
| Purchase Options | We have three licenses to opt for: Single User License, Multi-User License (Up to 5 Users), Corporate Use License (Unlimited User and Printable PDF) |





































