


Report Overview
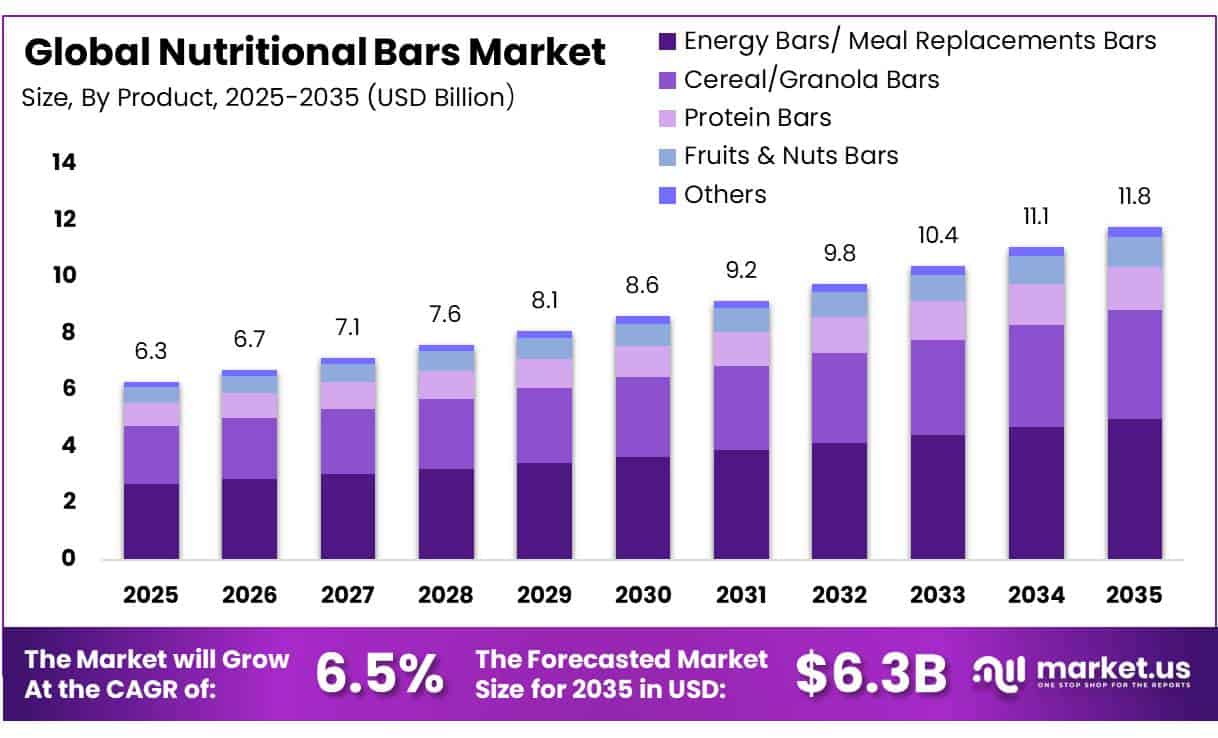
In 2025, the Nutritional Bars Market was valued at USD 6.3 Billion, and between 2026 and 2035, this market is estimated to register a CAGR of 6.5%, reaching about USD 11.8 Billion by 2035. North America held a dominant market position, capturing more than a 43.67% share, holding USD 2.75 Billion in revenue.
The nutritional bars market encompasses protein bars, granola and cereal bars, meal replacement bars, and energy bars formulated to deliver convenient, portion-controlled nutrition. Rising preference for on-the-go snacking, combined with interest in functional ingredients such as added protein, fiber, and vitamins, shapes product development across the category. Manufacturers increasingly position nutritional bars as substitutes for traditional meals and snacks among health-conscious, time-constrained consumers.
- The United States Food and Drug Administration proposed a Front-of-Package Nutrition Labeling rule on January 16, 2025, requiring standardized disclosure of saturated fat, sodium, and added sugar levels on packaged foods. In its economic analysis of that proposal, the agency estimated annualized relabeling costs across the packaged food industry at a primary estimate of 105 million dollars per year, alongside annualized reformulation costs with a primary estimate of 227 million dollars, directly affecting bar formulation and labeling budgets.
Health-related driving factors remain prominent. The Centers for Disease Control and Prevention reported that obesity prevalence among United States adults aged 20 and older reached 41.9%, affecting more than 100 million adults, reinforcing demand for portion-controlled, nutrient-dense snacking options. The World Health Organization reported that 31% of adults worldwide do not meet recommended physical activity levels, supporting demand for protein-fortified, energy-replenishing bars among fitness-oriented consumers.
Growth opportunities are reinforced by evolving government initiatives. The Food and Drug Administration finalized an updated “healthy” nutrient content claim rule on December 19, 2024, with the effective date delayed to April 28, 2025 and full compliance required by 2028, expanding eligibility for nuts, seeds, and whole grain-based bars to carry the “healthy” label. In Canada, the Canadian Food Inspection Agency confirmed that front-of-package labelling regulations, introduced by Health Canada in July 2022, complete their transition period on December 31, 2025, encouraging reformulation toward lower sodium, sugar, and saturated fat content.
Key Takeaways
- The Global Nutritional Bars Market was valued at USD 6.3 billion in 2025.
- The global market is projected to grow at a CAGR of 6.5% and is estimated to reach USD 11.8 billion by 2035.
- On the basis of product, Energy Bars/Meal Replacements Bars dominated the market, constituting 42.34% of the total market share.
- Based on the category, Conventional products dominated the market, accounting for 64.56% of the total market share.
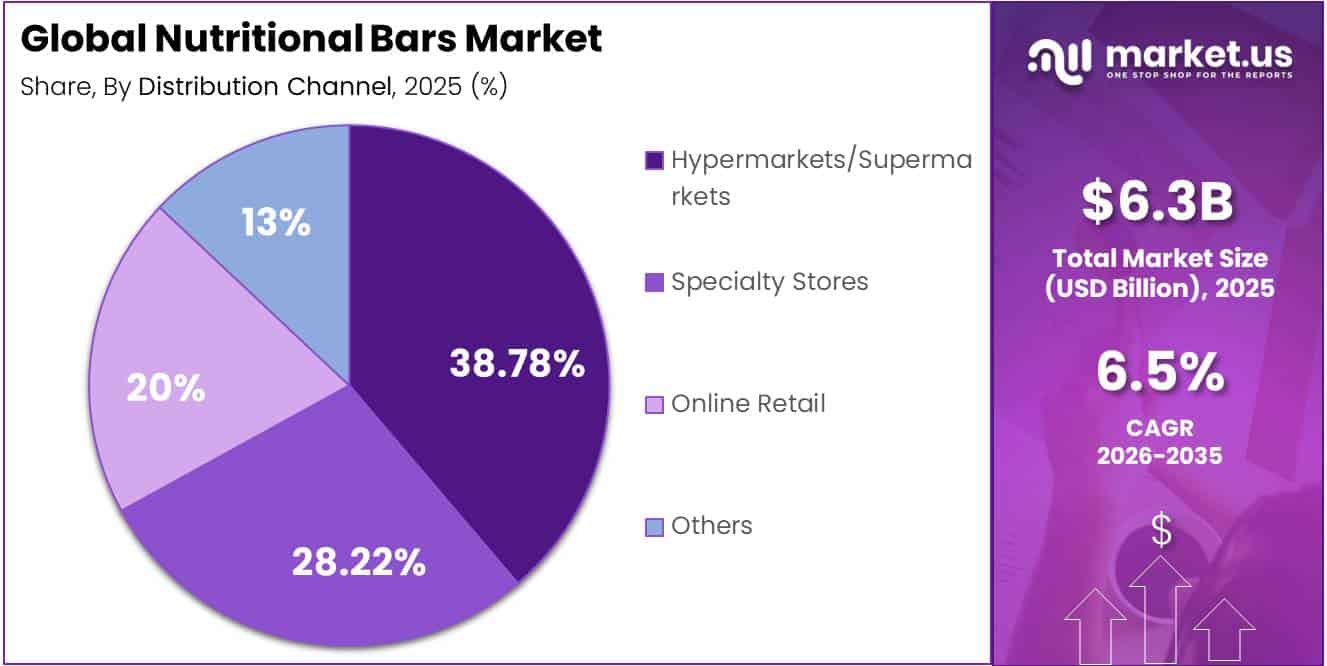
- Based on the distribution channel, Hypermarkets/Supermarkets dominated the market, accounting for 38.78% of the total market share.
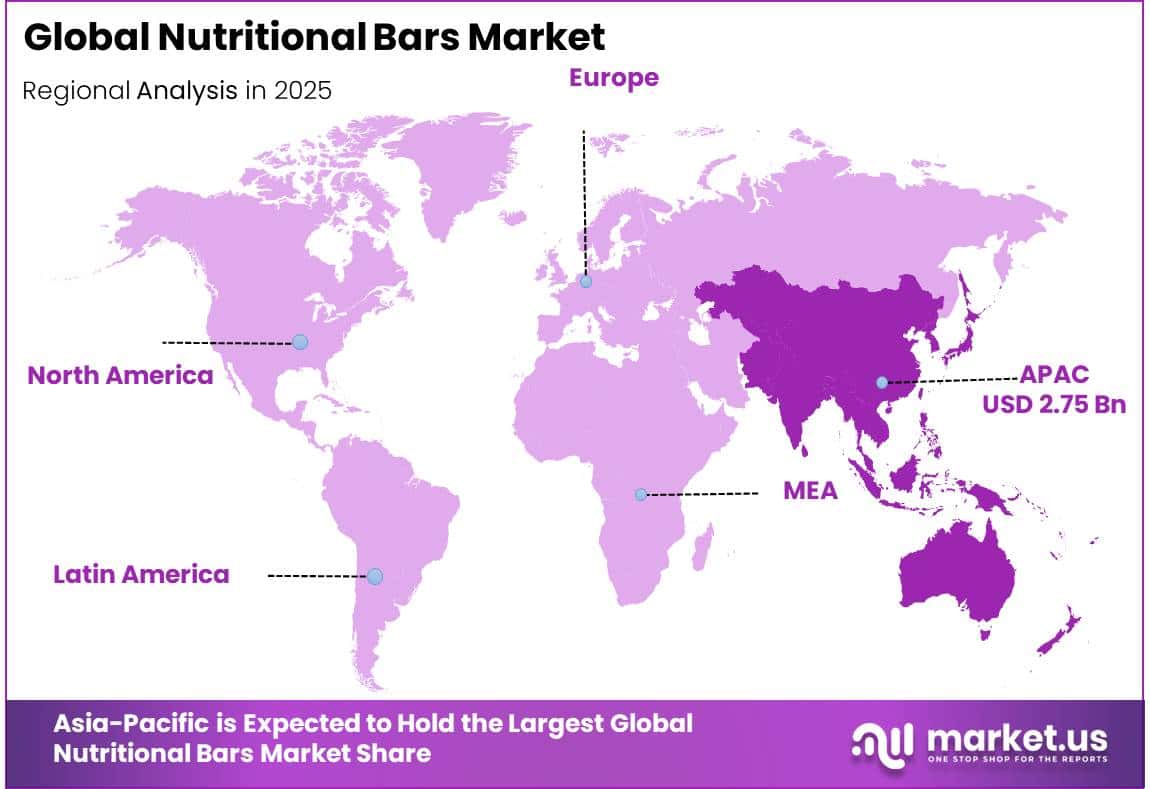
- In 2025, Asia-Pacific was the most dominant region in the nutritional bars market, accounting for 43.67% of the global market.
By Product
Energy Bars/Meal Replacement Bars dominate with 42.34% due to their strong role as convenient food options.
In 2025, Energy Bars/Meal Replacement Bars held a dominant market position, capturing more than a 42.34% share of the Nutritional Bars Market by product. Their leading position reflects their use as convenient food products that can serve as quick meal alternatives or energy-focused snacks. Their established presence within the nutritional bars category supports their position as the largest product segment in 2025.
In 2025, Cereal/Granola Bars were identified as the growing segment in the Nutritional Bars Market by product. Their growth is supported by their positioning as convenient, ready-to-eat food products that fit easily into everyday snacking occasions. The segment continues to gain attention within the nutritional bars category as consumers seek simple and convenient food choices.
By Category
Conventional products dominate with 64.56% due to their established market presence.
In 2025, Conventional held a dominant market position, capturing more than a 64.56% share of the Nutritional Bars Market by category. The segment maintained its leading position due to its established presence across the nutritional bars category and continued consumer acceptance of conventional products. This strong share made Conventional the dominant category in 2025.
In 2025, Gluten-free was the fastest-growing segment in the Nutritional Bars Market by category. The segment continued to gain attention as gluten-free nutritional bars became a growing part of the category. Its faster growth compared with the other category segment indicates increasing market momentum in 2025.
By Distribution Channel
Hypermarkets/Supermarkets dominate with 38.78% due to their broad retail reach.
In 2025, Hypermarkets/Supermarkets held a dominant market position, capturing more than a 38.78% share of the Nutritional Bars Market by distribution channel. Their leading position reflects the strong role of large-format retail outlets in making nutritional bars readily available to consumers. The segment remained the leading distribution channel in 2025.
In 2025, Specialty Stores were the growing segment in the Nutritional Bars Market by distribution channel. The segment continued to gain market attention as a focused retail channel for nutritional bar products. Its growth indicates increasing importance within the distribution landscape during 2025.
Key Market Segments
By Product
- Cereal/Granola Bars
- Protein Bars
- Energy Bars/ Meal Replacements Bars
- Fruits & Nuts Bars
- Others
By Category
- Gluten-free
- Conventional
By Distribution Channel
- Hypermarkets/Supermarkets
- Specialty Stores
- Online Retail
- Others
Driver Analysis
GLP-1 Drug Adoption and the Satiety Economy
The rapid scale-up of GLP-1 receptor agonists such as semaglutide and tirzepatide has become the single most disruptive demand-side variable for packaged snacking since 2024, with US adult usage climbing toward the 13-21% penetration band that EY-Parthenon projects will materialize over the next decade, translating into roughly USD 12 billion of at-risk snacking revenue. GLP-1 users reduce caloric intake by an estimated 21% and cut grocery spend by close to a third according to KPMG-sourced analysis cited by CNBC, while about 70% of users report snacking less frequently, and JPMorgan has floated a USD 30-55 billion annual hit to food and beverage sales industry-wide as early as 2030.
Crucially for nutritional bars specifically, Circana’s 2025-2026 tracking shows snack bars are among the categories gaining share within GLP-1 households precisely because they deliver high satiety per calorie in a portion-controlled format, unlike chips or sweet baked goods per Numerator’s January 2025 study.
This is forcing an unambiguous SKU-architecture pivot: legacy 250-300 kcal indulgence bars are being re-engineered into 120-180 kcal, 15g+ protein formats, and majors including Nestlé and Conagra have already launched GLP-1-adjacent bar lines, signaling that formulation R&D budgets are being reallocated from flavor innovation toward satiety-engineering and glycemic-response claims.
Drivers Impact Analysis
| Driver | (~) % Impact on CAGR | Geographic Relevance | Impact Timeline |
|---|---|---|---|
| GLP-1 weight-loss drug adoption reshaping snack portfolios toward high-protein, portion-controlled formats | +2.2% | North America core, EU spill-over | Medium term (2-4 years) |
| Clean-label and short-ingredient-list reformulation replacing artificial additives and added sugar | +1.6% | Global, led by North America and Western Europe | Medium term (2-4 years) |
| Plant-based and vegan protein diversification away from whey-dominant formulations | +1.4% | Global, fastest in North America and APAC urban corridors | Medium term (2-4 years) |
| E-commerce, D2C and subscription-based distribution replacing traditional retail shelf economics | +1.3% | Global, accelerating in APAC (India, South Korea, China) | Short term (≤ 2 years) |
| Regulatory front-of-pack labeling and health-claim substantiation costs (FSSAI, FDA, EFSA) | -0.6% | India, EU core, North America | Short term (≤ 2 years) |
| Premiumization and functional fortification (fiber, adaptogens, gut-health actives) commanding higher price realization | +1.1% | Global, EU and North America core, APAC emerging | Long term (≥ 4 years) |
Restraint Analysis
Ingredient-Cost Volatility
Nutritional-bar input costs are unusually volatile because the category uses several weather-sensitive and globally traded materials simultaneously—cocoa, dairy or plant proteins, nuts, seeds, oats, vegetable oils, dates, sweeteners, and multilayer barrier packaging—so a disruption in even one component can force reformulation or absorb gross-margin loss; this creates an estimated 1.4 percentage-point CAGR restraint in 2026-2028, particularly for chocolate-coated and nut-heavy SKUs in Europe and North America. Food-cost inflation remains elevated rather than linear: the FAO Food Price Index averaged 127.2 points in 2025, 4.3% above 2024, while the vegetable-oil index rose 17.1% to a three-year high; by July 2026, the broader index had returned to 131.1 points, a 0.6% monthly increase.
Cocoa illustrates the risk: futures fell below USD 8,000 per tonne during 2025 after extreme 2024 highs, yet medium-term price expectations remained around USD 6,000 per tonne and exposed manufacturers to substantial repricing risk as West African recovery, Ecuadorian expansion, weather, and currency movements evolve. For a bar in which ingredients comprise roughly 45-60% of ex-factory cost, a 20% increase in cocoa, almonds, protein concentrate, or nut-butter costs can add approximately 4-9% to finished-product cost depending on recipe loading; since retail price changes lag procurement cycles by 2-3 quarters, branded manufacturers either sacrifice 150-350 basis points of gross margin, shrink pack weight, or pass through pricing that reinforces the affordability restraint.
Restraint Impact Analysis
| Restraint | (~) % Impact on CAGR Forecast | Geographic Relevance | Impact Timeline |
|---|---|---|---|
| Premium price gap | -1.7% | APAC, Latin America, MEA | Medium term (2-4 years) |
| Ingredient-cost volatility | -1.4% | Global; EU, North America | Short term (≤ 2 years) |
| Sugar-label scrutiny | -1.1% | North America, EU, India | Medium term (2-4 years) |
| Taste and digestive friction | -0.9% | Global; India, APAC | Short term (≤ 2 years) |
| Substitute-snack competition | -0.8% | Global; emerging markets | Medium term (2-4 years) |
| Regulatory/SKU complexity | -0.7% | EU, India, North America | Short term (≤ 2 years) |
Opportunity Analysis
GLP-1 Clinical-Nutrition Bars
GLP-1-aligned nutritional bars represent an incremental whitespace rather than a current market driver because the category’s existing growth is still built largely on general fitness, convenience, and broad healthy-snacking demand, whereas GLP-1 users require deliberately engineered formats optimized for low appetite, muscle-mass preservation, digestive tolerance, and nutrient density; a successful 2026-2030 platform could add approximately 2.1 percentage points above baseline CAGR in North America and selected European markets. The commercial specification is materially different from a conventional protein bar: 10-20 grams protein, 5-10 grams fiber, fewer than 200-220 kcal, low added sugar, moderate fat, manageable bite size, and minimal polyol loading to reduce gastrointestinal friction.
Ingredient suppliers already identify high-protein, high-fiber, portion-controlled products as a direct formulation opportunity as GLP-1 medications alter food occasions, while Circana-linked forecasts suggest US GLP-1 user penetration could reach 35% by 2030. The upside comes from creating a clinically adjacent premium tier rather than competing for general snack occasions: a USD 2.50-3.50 mainstream bar can potentially support USD 3.50-5.00 pricing if coupled with healthcare-provider education, pharmacy-channel placement, medication-specific subscription packs, and evidence-backed satiety or protein-adequacy messaging; at a 15-25% gross-margin improvement over conventional SKUs, the model can increase value growth even when unit consumption is lower, provided claims remain within permissible structure-function and nutrition-content language rather than unsubstantiated disease-treatment positioning.
Opportunity Impact Analysis
| Opportunity | (~) % Potential CAGR | Geographic Relevance | Execution Window |
|---|---|---|---|
| GLP-1 clinical-nutrition bars | +2.1% | North America core, EU | Medium term (2-4 years) |
| Employer wellness subscriptions | +1.6% | North America, India, EU | Short term (≤ 2 years) |
| Women’s life-stage nutrition | +1.5% | North America, EU, APAC urban | Medium term (2-4 years) |
| Healthy-aging protein bars | +1.3% | Japan, EU, North America | Long term (≥ 4 years) |
| Foodservice and institutional packs | +1.2% | India, GCC, APAC, North America | Medium term (2-4 years) |
| M&A-led regional roll-ups | +1.0% | India, Southeast Asia, Europe | Short term (≤ 2 years) |
Challenges Analysis
Multi-Input Sourcing Volatility
Nutritional-bar supply chains are operationally fragile because a single SKU typically combines 8-20 input streams—protein isolate or concentrate, nuts, seeds, oats, fruit pastes, cocoa, oils, fibers, sweeteners, emulsifiers, flavors, and multilayer packaging each with distinct seasonal, geographic, quality, and freight-risk profiles, creating an estimated 1.2 percentage-point drag on maximum CAGR even when consumer demand remains intact. The Red Sea disruption has converted the Cape of Good Hope route into a continuing planning assumption through at least 2027, with diversions adding roughly 10-15 transit days and container traffic through the Suez Canal having fallen approximately 90% from March 2023 levels by early 2025.
A brand importing plant protein, cocoa derivatives, specialty fibers, or barrier films therefore faces working-capital pressure from needing 30-60 additional days of safety stock, while a 15-25% increase in landed cost for any ingredient representing 8-15% of a bar’s bill of materials can reduce gross margin by 120-300 basis points if retail price resets are delayed. Mitigation requires dual-region supplier qualification, formula-level substitution protocols, 90-180 day commodity coverage for high-volatility inputs, and integrated demand-to-procurement forecasting; however, these measures increase supplier-audit cost, minimum-order commitments, and inventory carrying expense before their resilience benefits are realized.
Challenges Impact Analysis
| Challenge | (~) % CAGR Friction | Geographic Relevance | Mitigation Horizon |
|---|---|---|---|
| Multi-input sourcing volatility | -1.2% | Global; EU, North America, APAC | Medium term (2-4 years) |
| Small-batch production inefficiency | -1.0% | India, Southeast Asia, EU challengers | Medium term (2-4 years) |
| Formulation scale-up complexity | -0.9% | Global; North America, EU, APAC | Long term (≥ 4 years) |
| Demand-planning and expiry risk | -0.8% | Global; D2C-heavy markets | Short term (≤ 2 years) |
| Food-tech talent scarcity | -0.7% | India, APAC, North America | Long term (≥ 4 years) |
| Packaging traceability transition | -0.6% | EU core, North America | Medium term (2-4 years) |
Geopolitical Impact Analysis
Geopolitical Impact Analysis: Middle East Conflict Increases Energy and Transformer Supply Risks.
The ongoing Middle East conflict is putting pressure on the Nutritional Bars Market mainly through higher energy, fertilizer, transport, and food-input costs. The World Bank reported in April 2026 that global commodity prices were forecast to rise 16% in 2026, while energy prices were projected to increase 24%, as the conflict disrupted energy supplies and shipping through the Strait of Hormuz. Since nutritional bars depend on agricultural ingredients and food processing, higher input and logistics costs can increase production expenses and put pressure on manufacturers and retailers.
- The impact is also visible in food commodity prices. The World Bank projected its food price index to increase 2% in 2026, mainly because of higher energy and fertilizer costs linked to the conflict. At the same time, FAO reported that its Food Price Index averaged 130.3 points in June 2026, while the cereal index stood at 110.2 points.
These developments can affect the cost structure of nutritional bars, particularly products using cereal-based ingredients. Overall, the current geopolitical situation is creating greater cost and supply-chain uncertainty for manufacturers while increasing the importance of efficient sourcing and production planning.
Regional Analysis
Regional Segmental Analysis: Nutritional Bars Market.
On a regional basis, Asia-Pacific emerges as the dominant region in the nutritional bars market, accounting for a 43.67% share valued at 2.75 billion dollars. This leadership reflects the region’s large population base, rising disposable incomes, and growing urban demand for convenient, on-the-go nutrition across markets such as Australia, Japan, China, and Southeast Asia.
- Diet-related health concerns are reinforcing this shift: a Lancet-informed analysis supported by the World Health Organization found that Pacific island countries account for 9 of the 10 nations with the highest adult obesity prevalence worldwide, with 43% of adults globally classified as overweight in 2022. These findings, released through WHO’s Western Pacific regional office, underscore rising regional demand for portion-controlled, nutrient-dense snacking alternatives such as nutritional bars.
Regulatory infrastructure in the Asia-Pacific region further supports category growth. Food Standards Australia New Zealand, the bi-national government agency responsible for the Australia New Zealand Food Standards Code, permits nutrition content and health claims on food labels once products meet the Nutrient Profiling Scoring Criterion, with more than 200 pre-approved food-health relationships available for general level health claims and 13 pre-approved relationships for high level health claims.
Key Regions and Countries
- North America
- The US
- Canada
- Europe
- Germany
- France
- The UK
- Spain
- Italy
- Russia & CIS
- Rest of Europe
- APAC
- China
- Japan
- South Korea
- India
- ASEAN
- Rest of APAC
- Latin America
- Brazil
- Mexico
- Rest of Latin America
- Middle East & Africa
- GCC
- South Africa
- Rest of MEA
Key Players Analysis
Nutritional bars manufacturers focus on product innovation, ingredient quality, and changing consumer preferences to strengthen their market position. Key players such as Active Nutrition International GmbH, anona GmbH, Artenay Bars, B.V. Vurense Snack Industrie, Bedouin S.A.S., Frankonia Schokoladenwerke GmbH, General Mills Inc., and Glanbia Plc. compete by expanding product offerings across protein, energy, cereal, granola, fruit, nut, and meal replacement bars.
Competition also depends on manufacturing scale, distribution strength, and the ability to serve different retail channels. Halo Foods Ltd., Leader Foods OY, Mars Incorporated, Mondelez International, Nutrition & Santé SAS, Prinsen Food Group B.V., and SternLife GmbH & Co. KG strengthen their positions through broad product portfolios, retail relationships, and production capabilities. Companies are also focusing on private-label production, customized formulations, and channel-specific products to reach a wider customer base.
The Major Players in The Industry
- Active Nutrition International GmbH
- anona GmbH
- Artenay Bars
- V. Vurense Snack Industrie
- Bedouin S.A.S
- Frankonia Schokoladenwerke GmbH
- General Mills Inc.
- Glanbia Plc.
- Halo Foods Ltd.
- Leader Foods OY
- Mars Incorporated
- Mondelez International
- Nutrition & Santé SAS
- Prinsen Food Group B.V.
- SternLife GmbH & Co. KG
- Other Key Players
Key Development
- In June 2025, Glanbia Plc. introduced think! Crispy Squares, a new addition to its protein bar lineup. The product provides 15 grams of protein in a convenient grab-and-go format and is offered in three flavors, including marshmallow crunch, chocolate crunch, and toffee pretzel crunch.
- In July 2025, Mars Incorporated opened a new Nature’s Bakery manufacturing facility in Salt Lake City, Utah. The $240 million facility has the capacity to produce more than 1 billion bars annually, supporting the company’s expansion of its snack-bar production.
- In May 2026, General Mills Inc. launched LÄRABAR Protein, expanding its bar portfolio with plant-based protein options. The new bars provide 10-12 grams of protein per bar and are available in three flavors: Peanut Butter Chocolate, Cinnamon Nut, and Lemon.
Report Scope
| Report Features | Description |
|---|---|
| Market Value (2025) | USD 6.3 Bn |
| Forecast Revenue (2035) | USD 11.8 Bn |
| CAGR (2026 2035) | 6.5% |
| Base Year for Estimation | 2025 |
| Historic Period | 2020-2024 |
| Forecast Period | 2026-2035 |
| Report Coverage | Revenue Forecast, Market Dynamics, Competitive Landscape, Recent Developments |
| Segments Covered | By Product (Cereal/Granola Bars, Protein Bars, Energy Bars/Meal Replacements Bars, Fruits & Nuts Bars, Others), By Category (Gluten-free, Conventional), By Distribution Channel (Hypermarkets/Supermarkets, Specialty Stores, Online Retail, Others) |
| Regional Analysis | North America The US & Canada; Europe Germany, France, The UK, Spain, Italy, Russia & CIS, Rest of Europe; APAC China, Japan, South Korea, India, ASEAN & Rest of APAC; Latin America Brazil, Mexico & Rest of Latin America; Middle East & Africa GCC, South Africa, & Rest of MEA |
| Competitive Landscape | Active Nutrition International GmbH, anona GmbH, Artenay Bars, B.V. Vurense Snack Industrie, Bedouin S.A.S, Frankonia Schokoladenwerke GmbH, General Mills Inc., Glanbia Plc., Halo Foods Ltd., Leader Foods OY, Mars Incorporated, Mondelez International, Nutrition & Santé SAS, Prinsen Food Group B.V., SternLife GmbH & Co. KG, and Other Key Players. |
| Customization Scope | Customization for segments, region/country level will be provided. Moreover, additional customization can be done based on the requirements. |
| Purchase Options | We have three licenses to opt for: Single User License, Multi User License (Up to 5 Users), Corporate Use License (Unlimited Users and Printable PDF) |





































