


Report Overview
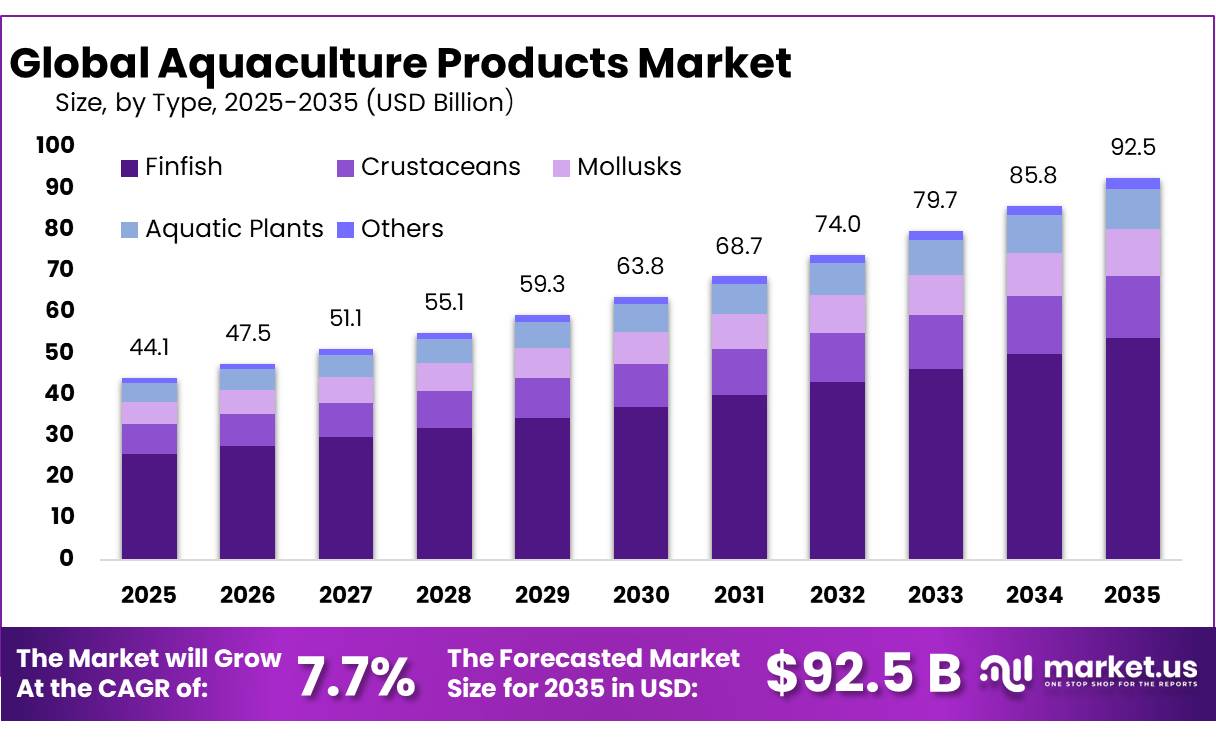
In 2025, the Global Aquaculture Products Market was valued at USD 44.1 Billion, and between 2026 and 2035, this market is estimated to register a CAGR of 7.7%, reaching about USD 92.5 Billion by 2035. Asia-Pacific held a dominant market position, capturing more than a 62.2% share, holding USD 27.45 Billion in revenue.
Aquaculture products form an important part of the modern aquatic food value chain, covering aquafeed, feed additives, fish-health products, water-treatment inputs, hatchery supplies, cages, aeration systems, sensors and farm-management equipment. The industry is expanding as farmed production becomes a larger source of seafood supply. According to FAO SOFIA 2026, aquaculture produced 103 million tonnes of aquatic animals in 2024 and supplied 53% of total aquatic animal production. Including algae, output reached 141 million tonnes, valued at USD 391 billion.
- Aquafeed remains a major input because commercial farms require balanced nutrition and improved feed conversion. IFFO, The Marine Ingredients Organisation estimated global 2025 production at 5.6 million tonnes of fishmeal and 1.2–1.3 million tonnes of fish oil. Supply remains variable, as IFFO reported that first-quarter 2026 fishmeal production declined 28%, while fish oil output decreased 12% year on year.
Key Takeaways
- Aquaculture Products Market was valued at USD 44.1 Billion, to register a CAGR of 7.7%, reaching about USD 92.5 Billion by 2035.
- Finfish Fuel held a dominant market position, capturing more than a 58.1% share.
- Feed & Feed Additives held a dominant market position, capturing more than a 40.1% share.
- Freshwater held a dominant market position, capturing more than a 55.4% share.
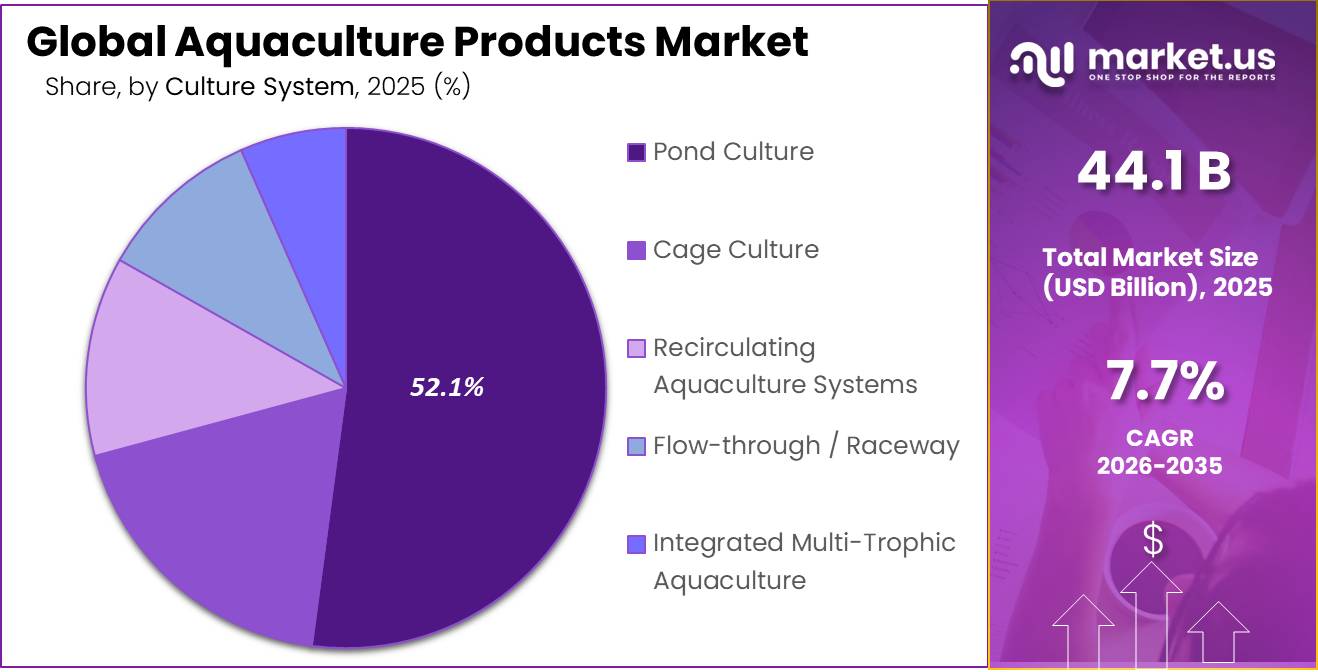
- Pond Culture held a dominant market position, capturing more than a 52.1% share.
- Residential held a dominant market position, capturing more than a 48.2% share.
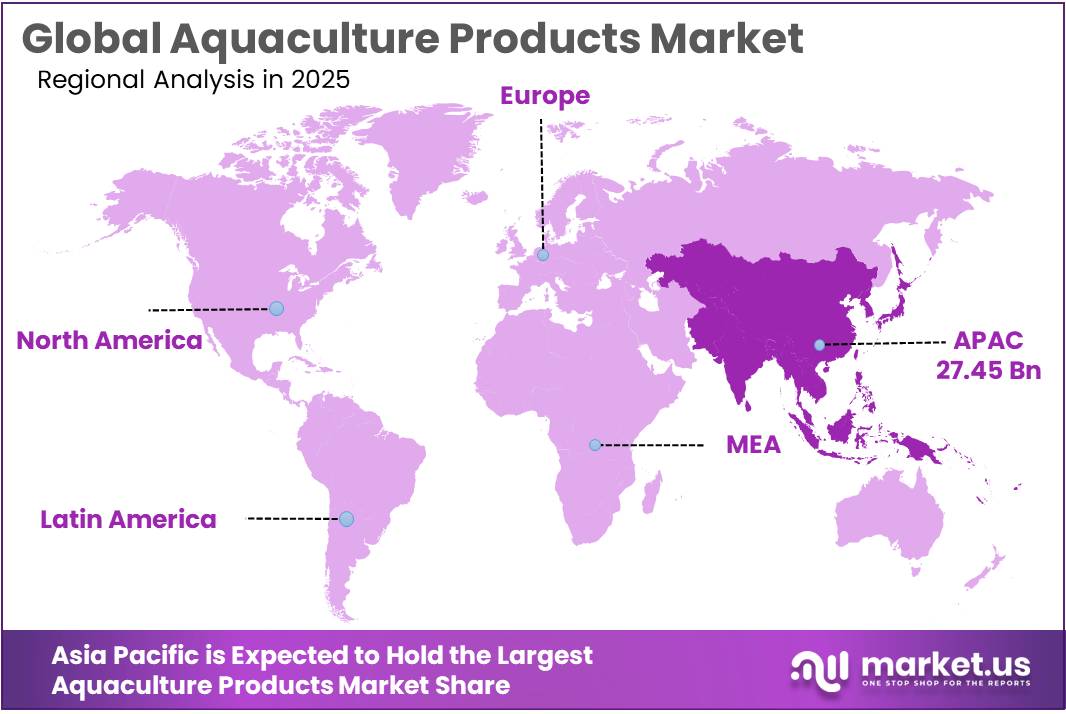
- Asia Pacific held a dominant position in the Aquaculture Products Market, capturing more than a 62.2% share and generating approximately USD 27.45 billion.
Demand for aquaculture products is also supported by rising aquatic-food consumption. FAO reported global fisheries and aquaculture production of 235 million tonnes in 2024, while aquatic animal trade reached USD 184 billion. Aquatic foods provide at least one-fifth of animal-protein intake for 3.1 billion people. This large consumption base encourages investment in feed premixes, probiotics, vaccines, water-quality products, automated feeding and disease-monitoring technologies.
- Government initiatives are strengthening the industry’s long-term development. NOAA identified 13 Aquaculture Opportunity Areas covering more than 21,000 acres in U.S. federal waters during 2025. NOAA’s Sea Grant Program also invested USD 11.9 million in 37 projects covering more than 17 farmed seafood species. Meanwhile, the European Commission established 4 strategic objectives and 13 action areas for sustainable aquaculture development.
Future opportunities are strongest in sustainable feed, health management, recirculating systems, automation and digital water monitoring. OECD-FAO projects farmed aquatic animal production to reach 118 million tonnes by 2034, representing 20% growth, while aquaculture could account for 56% of total fisheries and aquaculture production. These trends should increase demand for products that improve survival, water quality, oxygen management and traceability.
Feed innovation provides another major growth opportunity. OECD-FAO expects oilseed-meal use in aquaculture to rise 37% to 11 million tonnes, while fishmeal consumption increases 16% to 4.9 million tonnes by 2034. Fish oil used for farmed fish is projected to reach 59% of total consumption. This creates opportunities for alternative proteins, enzymes, probiotics, functional additives, precision feeding and circular marine ingredients, particularly as producers seek lower environmental impact and more reliable input supplies.
By Type Analysis
Finfish leads the Aquaculture Products Market with a 58.1% share, supported by its broad role in commercial aquaculture.
In 2025, Finfish Fuel held a dominant market position, capturing more than a 58.1% share. Finfish remains the leading product type because species such as salmon, tilapia, trout, carp and catfish are widely raised across freshwater and marine farming systems. Demand is supported by established hatchery networks, commercial feed availability, improved breeding practices and increasing use of controlled farming technologies.
- According to a 2025 U.S. Department of Agriculture Foreign Agricultural Service report, white-leg shrimp production in Vietnam reached 366,900 metric tons during the first half of the year, rising 7.3% from the previous year. Black tiger shrimp production reached another 125,100 metric tons, increasing 3.6%. The report noted that favorable weather and adoption of high-technology shrimp farming models contributed to higher production.
Crustaceans remain an important aquaculture product segment, mainly supported by strong commercial farming of shrimp and prawns. Their high consumer demand, export potential and suitability for intensive farming continue to encourage producers to adopt better feed, disease-control and water-management solutions.
By Product Type Analysis
Feed & Feed Additives dominate the Aquaculture Products Market with a 40.1% share, supported by their essential role in fish nutrition and farm productivity.
In 2025, Feed & Feed Additives held a dominant market position, capturing more than a 40.1% share. The segment remains important because feed is required throughout the commercial production cycle, while additives help farmers improve nutrition, digestion, animal health and feed utilization. Products such as vitamins, minerals, amino acids, enzymes, probiotics and functional ingredients are increasingly included in modern aquafeed formulations.
- The European Commission also allocated EUR 23.30 million in 2025 for a digital technologies and energy-transition call covering fisheries and aquaculture, with 4 projects planned for funding. The program specifically supports remote sensing, monitoring devices, Internet of Things, robotics and automation.
Equipment remains an important product segment as commercial farms increasingly use aerators, pumps, cages, feeding systems, sensors, filtration units and water-quality monitoring devices to improve production control. In 2025, NOAA Fisheries released a technical guide covering aquaculture gear such as shellfish cages, fish netpens and kelp long-line systems, while also highlighting advances in monitoring and feeding technologies.
By Culture Environment Analysis
Freshwater dominates the Aquaculture Products Market with a 55.4% share, supported by its suitability for established pond and inland farming systems.
In 2025, Freshwater held a dominant market position, capturing more than a 55.4% share. Freshwater aquaculture maintains a strong position because ponds, tanks, raceways and other inland farming systems can support large-scale production of commonly cultivated fish species. The segment also benefits from established hatchery practices, easier farm management and broad use of formulated feed, aeration and water-quality solutions.
- In 2025, the U.S. National Oceanic and Atmospheric Administration identified 13 Aquaculture Opportunity Areas covering more than 21,000 acres in federal waters, helping provide suitable locations for future commercial aquaculture development. NOAA also published more than 20 aquaculture research articles, reports and technical memoranda during 2025. Its Sea Grant Program invested USD 11.9 million in 37 aquaculture research and extension projects, covering more than 17 farmed seafood species.
Marine Water is gaining importance in the Aquaculture Products Market as producers expand offshore and coastal farming of fish, shellfish and seaweed. Marine aquaculture benefits from greater access to ocean space and growing investment in cages, net pens, monitoring equipment and environmental-management technologies.
By Culture System Analysis
Pond Culture dominates the Aquaculture Products Market with a 52.1% share, supported by its simple operation and broad suitability for freshwater farming.
In 2025, Pond Culture held a dominant market position, capturing more than a 52.1% share. Pond culture continues to lead because it provides a practical production system for finfish, crustaceans and other farmed aquatic species. Producers can manage feeding, water quality, stocking and harvesting within a controlled environment while using existing land and water resources.
- In 2025, the Scottish Government estimated Atlantic salmon production at 195,182 tonnes, compared with 192,000 tonnes in the preceding production year. This production base supports demand for stronger cages, nets, automated feeding systems, monitoring sensors and fish-health equipment. Cage farming is also benefiting from improved engineering and monitoring technologies that help farms manage offshore conditions more efficiently.
Cage Culture is gaining importance in the Aquaculture Products Market as producers increasingly use floating and submerged cages for commercial marine finfish farming. The system enables fish to grow in naturally circulating water while allowing farmers to control feeding, stocking and harvesting from dedicated production sites. The Scottish Government explains that marine fish farms typically consist of groups of cages or pens arranged in grid structures, showing the established role of cage systems in commercial salmon production.
By Production Scale Analysis
Residential dominates the Aquaculture Products Market with a 48.2% share, supported by growing interest in small-scale and controlled aquaculture systems.
In 2025, Residential held a dominant market position, capturing more than a 48.2% share. Residential-scale aquaculture benefits from increasing interest in compact aquaponic and controlled-environment systems that can be operated in urban and small-scale settings. These systems allow users to combine aquatic production with efficient water management while requiring relatively limited operating space. USDA recognizes aquaponic facilities within its support framework for urban, small-scale and innovative agricultural production, alongside indoor and other controlled production systems.
- In 2025, USDA announced USD 14.4 million in grants and technical assistance for urban agriculture and innovative production. Of this amount, USD 2.5 million was made available through Urban Agriculture and Innovative Production grants, while USD 11.9 million supported extension assistance through an interagency program. Separately, USDA’s NIFA funded 6 aquaculture research projects totaling USD 1.7 million in 2025, supporting technologies intended to improve sustainable aquaculture production.
Commercial & Public Buildings are gaining relevance in aquaculture products as aquaponic and controlled-environment systems are increasingly considered for commercial farms, educational facilities, community projects and other urban production sites. USDA confirms that its urban agriculture programs support indoor, rooftop and aquaponic facilities.
Key Market Segments
By Type
- Finfish
- Crustaceans
- Mollusks
- Aquatic Plants
- Others
By Product Type
- Feed & Feed Additives
- Equipment
- Chemicals
- Pharmaceuticals
- Fertilizers
By Culture Environment
- Freshwater
- Marine Water
- Brackish Water
By Culture System
- Pond Culture
- Cage Culture
- Recirculating Aquaculture Systems (RAS)
- Flow-through / Raceway
- Integrated Multi-Trophic Aquaculture (IMTA)
By Production Scale
- Residential
- Commercial & Public Buildings
- Industrial
Driver Analysis
Seafood Supply Gap and Protein Substitution
Aquaculture products demand is increasingly anchored in the inability of capture fisheries to expand supply sustainably, shifting incremental seafood availability toward farmed production and raising demand for seed, feed, water-treatment chemicals, cage systems, processing, cold-chain and health products. Farmed aquatic-animal production reached 103 million tonnes in 2024 and accounted for 53% of total aquatic-animal production; it supplied more than 59% of aquatic food output, demonstrating that aquaculture is now the principal scalable supply response rather than a peripheral protein category. FAO-linked 2025 projections indicate aquaculture output growth of about 2.7 million tonnes, or 2.7%, over 2024, compared with substantially slower expansion potential in wild catch.
Commercially, this improves utilization of hatchery capacity, feed mills and processing assets: each new tonne of intensive finfish or shrimp output requires recurring inputs across production cycles, unlike one-time equipment revenue. The strongest value capture should occur in China, India, Indonesia, Vietnam, Bangladesh, Ecuador, Chile and Norway, while the EU, United States and Gulf states offer higher-value demand markets for certified salmon, shrimp, seabass, seabream and ready-to-cook formats. This driver is estimated to add approximately 1.9 percentage points to the baseline CAGR through 2028–2030, primarily through volume pull for consumable farm inputs and premiumization of traceable farmed seafood.
Drivers Impact Analysis
| Driver | (~) % Impact on CAGR Forecast | Geographic Relevance | Impact Timeline |
|---|---|---|---|
| Seafood supply gap and protein substitution | +1.9 pp | APAC core, North America, EU, MENA | Medium term (2–4 years) |
| High-performance and alternative aquafeed | +1.6 pp | APAC corridors, Europe, North America, Latin America | Medium term (2–4 years) |
| Disease control, vaccines and functional nutrition | +1.3 pp | China, India, Vietnam, Norway, Chile, Ecuador | Short term (≤ 2 years) |
| RAS, automation and precision farming | +1.1 pp | North America, Europe, GCC, urban APAC | Long term (≥ 4 years) |
| Traceability, welfare and compliance products | +0.9 pp | EU, U.S., UK, Canada, export-oriented APAC | Short term (≤ 2 years) |
| Low-trophic species and circular aquaculture | +0.7 pp | EU, China, Japan, Korea, coastal APAC | Long term (≥ 4 years) |
Restraint Analysis
Disease and Mortality Shocks
Disease remains the most immediate value-destructive restraint because intensive fish and shrimp systems concentrate biomass, pathogens and operational risk inside a short production cycle, turning a local outbreak into a lost harvest, lower feed demand, emergency treatment spend and delayed restocking.
In China’s 2025 marine-fish survey, 70.7% of respondents identified frequent disease outbreaks as a major development constraint, while 77.9% identified disease prevention as a primary technical challenge, indicating that biological risk is no longer confined to isolated farms but affects system-level investment confidence. Shrimp producers face exposure to white spot disease, acute hepatopancreatic necrosis disease and bacterial Vibrio events, whereas salmon producers must manage sea lice, infectious salmon anaemia and pancreas disease; published assessments indicate pancreas disease can produce mortality as high as 60% in severely affected salmon populations.
The financial mechanism is severe: mortality reduces harvestable biomass while much of the feed, juvenile, labor, electricity, lease and depreciation cost has already been incurred, causing EBITDA margins to compress disproportionately relative to revenue decline; farms then defer feed purchases, vaccine programs, equipment replacement and capacity expansion. For 2026–2028, this restraint is estimated to remove around 2.0 percentage points from baseline CAGR across high-density shrimp and salmon corridors, unless farms materially improve pathogen surveillance, hatchery screening, stocking density discipline, vaccine coverage and water-quality control.
Restraint Impact Analysis
| Restraint | (~) % Impact on CAGR Forecast | Geographic Relevance | Impact Timeline |
|---|---|---|---|
| Disease and mortality shocks | -2.0 pp | China, India, Vietnam, Ecuador, Norway, Chile | Short term (≤ 2 years) |
| Feed ingredient scarcity | -1.7 pp | APAC, Europe, Latin America, North America | Medium term (2–4 years) |
| Climate and water instability | -1.4 pp | Coastal APAC, Nordic Europe, Chile, Canada, Australia | Long term (≥ 4 years) |
| Permitting and compliance burden | -1.0 pp | EU, U.S., Canada, Norway, UK | Medium term (2–4 years) |
| Capital intensity and high rates | -0.9 pp | North America, Europe, GCC, urban APAC | Medium term (2–4 years) |
| Weak farm economics and oversupply | -0.8 pp | Ecuador, India, Vietnam, China, Southeast Asia | Short term (≤ 2 years) |
Opportunity Analysis
Farm-Data Finance Platforms
The largest unmonetized opportunity is to convert farm operational data into an underwriting and financing product for producers that remain excluded from formal credit, crop-style insurance and equipment leasing because lenders lack verified biological performance histories; this is not a baseline driver because most small and mid-scale farms still transact through fragmented feed-credit, informal trader advances and manual farm records rather than a bankable digital-risk infrastructure.
India has already created institutional rails through its National Fisheries Digital Platform, launched in September 2024, which provides digital identities and access pathways for institutional credit, insurance, traceability and performance-linked incentives across fisheries and aquaculture stakeholders. The scalable model is to charge farms an annual software-and-service fee equivalent to 0.3%–0.8% of farm-gate revenue, earn 1%–3% from financed input transactions and reduce customer-acquisition cost by bundling finance with feed or seed distribution; where a platform lowers lender loss assumptions by even 200–400 basis points, it can unlock working capital that directly increases stocking and farm-input purchases.
Opportunity Impact Analysis
| Opportunity | (~) % Potential CAGR | Geographic Relevance | Execution Window |
|---|---|---|---|
| Farm-data finance platforms | +1.8 pp | India, APAC, Latin America, Africa | Medium term (2–4 years) |
| Traceability-as-a-service | +1.5 pp | U.S., EU, Canada, export APAC | Short term (≤ 2 years) |
| Low-trophic blue biorefineries | +1.3 pp | EU, China, Japan, Korea, North America | Long term (≥ 4 years) |
| Precision-feed outcome contracts | +1.2 pp | Ecuador, Vietnam, India, Norway, Chile | Medium term (2–4 years) |
| Integrated multi-trophic clusters | +1.0 pp | EU coasts, China, Korea, Japan, MENA | Long term (≥ 4 years) |
| Distressed-asset roll-ups | +0.9 pp | Ecuador, India, Vietnam, Southeast Asia | Short term (≤ 2 years) |
Challenges Analysis
Skilled Operator Shortage
European aquaculture skills research identifies the need for continuously updated training in ICT, innovation, digitalization, entrepreneurship, marketing, business management and supply-chain awareness, while broader blue-economy analysis identifies rising demand for digital traceability, sustainability auditing, environmental compliance and value-chain-management competencies. The economic impact is visible in asset utilization: a 2,000–3,000-tonne RAS facility contains multiple interdependent systems for pumping, filtration, oxygenation, biofiltration, alarms and temperature control, and a single poorly managed incident can destroy months of biomass accumulation; commercial installations also require approximately 3–5 years from project initiation to profitability, increasing the cost of operational learning.
Companies must build structured apprenticeships, centralize remote technical support, use multilingual digital standard operating procedures and tie operator incentives to survival, feed conversion, grading uniformity and compliance scores; absent such workforce systems, the challenge contributes an estimated 1.0-percentage-point growth drag across North America, Europe, GCC states and technology-led Asian production clusters through 2028–2030.
Challenges Impact Analysis
| Challenge | (~) % CAGR Friction | Geographic Relevance | Mitigation Horizon |
|---|---|---|---|
| Fragmented farm data | -1.3 pp | APAC, Latin America, Africa, EU | Medium term (2–4 years) |
| Seedstock quality variability | -1.2 pp | APAC, MENA, Latin America, Africa | Long term (≥ 4 years) |
| Skilled operator shortage | -1.0 pp | North America, EU, GCC, urban APAC | Medium term (2–4 years) |
| Cold-chain route volatility | -0.9 pp | Export APAC, Latin America, EU, U.S. | Short term (≤ 2 years) |
| RAS energy optimization | -0.8 pp | North America, Europe, GCC, Japan | Long term (≥ 4 years) |
| AMR surveillance gaps | -0.7 pp | APAC, Africa, Latin America | Long term (≥ 4 years) |
Geopolitical Impact Analysis
The Aquaculture Products market is facing cost and supply-chain pressure from the Russia–Ukraine war and conflict across the Middle East. Black Sea instability continues to disrupt grain and oilseed trade, affecting ingredients used in aquafeed and increasing uncertainty around feed procurement.
UN Trade and Development reported in March 2026 that the Strait of Hormuz carries around one-quarter of global seaborne oil trade, showing why disruption in this corridor affects transport and energy-intensive aquaculture operations. Higher diesel and power costs can increase expenses for pumping, aeration, water circulation, refrigeration and feed delivery.
Despite these pressures, underlying aquaculture demand remains resilient. FAO reported in 2026 that global fisheries and aquaculture production reached 235 million tonnes in 2024, while aquaculture supplied 103 million tonnes of aquatic animals. The current geopolitical environment is therefore pushing producers toward local feed sourcing, energy-efficient equipment, automated monitoring and shorter supply chains.
Regional Insights
Asia Pacific leads with a 62.2% share and USD 27.45 billion, while North America is emerging as the fastest-growing region.
In 2025, Asia Pacific held a dominant position in the Aquaculture Products Market, capturing more than a 62.2% share and generating approximately USD 27.45 billion. The region benefits from a deeply established aquaculture industry, large coastal and freshwater production networks, and extensive demand for aquafeed, aerators, cages, water-treatment products and health-management solutions.
- FAO reported in 2026 that Asia accounted for 76% of global aquatic animal and algae production, producing 179 million tonnes in 2024, with around 130 million tonnes coming from aquaculture. The region also produced 91.5 million tonnes of farmed aquatic animals and accounted for 97% of global algae production. Strong production infrastructure, processing capacity and continued investment in modern farming systems are expected to keep Asia Pacific at the center of global aquaculture product demand.
North America is positioned as the fastest-growing regional market, supported by investment in offshore farming, advanced monitoring, recirculating systems and sustainable seafood production. In 2025, NOAA identified 13 Aquaculture Opportunity Areas covering more than 21,000 acres of U.S. federal waters, expanding the potential space available for commercial aquaculture development. NOAA scientists also published more than 20 aquaculture research articles, reports and technical memoranda during the year.
Key Regions and Countries Insights
- North America
- US
- Canada
- Europe
- Germany
- France
- The UK
- Spain
- Italy
- Rest of Europe
- Asia Pacific
- China
- Japan
- South Korea
- India
- Australia
- Rest of APAC
- Latin America
- Brazil
- Mexico
- Rest of Latin America
- Middle East & Africa
- GCC
- South Africa
- Rest of MEA
Key Players Analysis
Mowi ASA remains a major aquaculture producer with an integrated salmon value chain covering feed, farming, processing and branded products. In 2025, the company generated EUR 5.73 billion in revenue and harvested 559,000 tonnes of salmon, both record levels. In Q1 2026, revenue reached EUR 1.54 billion, while harvest volume increased to 136,477 tonnes. Mowi expects 605,000 tonnes of harvest volume in 2026, showing continued production expansion supported by improved farming efficiency and biological performance.
Lerøy Seafood Group ASA operates across salmon and trout farming, wild catch, processing, sales and distribution. In 2025, operating revenue reached approximately NOK 34.36 billion, while salmon and trout harvest volume increased to 195,555 tonnes, compared with 171,228 tonnes previously. The group also recorded 57,675 tonnes of wild catch. In Q1 2026, salmon and trout harvest volume reached around 39,900 tonnes. Its integrated operations and continued focus on farming efficiency strengthen its position within aquaculture products.
Bakkafrost P/F operates an integrated salmon value chain across the Faroe Islands and Scotland, covering feed, freshwater production, farming, harvesting and processing. In 2025, operating revenue reached DKK 7.0 billion, while operational EBIT totaled DKK 888 million. Harvest volume increased to 106,823 tonnes, compared with 90,656 tonnes previously. Freshwater operations produced 18.7 million large smolt, while average harvest weight in Scotland reached 5.3 kg. These improvements strengthened biological performance and supported Bakkafrost’s long-term aquaculture expansion strategy.
Top Key Players Outlook
- Mowi ASA
- SalMar ASA
- Lerøy Seafood Group ASA
- Bakkafrost P/F
- Grieg Seafood ASA
- Cermaq Group AS
- Cooke Aquaculture Inc.
- Thai Union Group PCL
- Nissui Corporation
- Maruha Nichiro Corporation
- Charoen Pokphand Foods PCL
- Cargill, Inc.
- Skretting
- BioMar Group A/S
- AKVA Group ASA
Recent Developments
- In May 2026, Thai Union Feedmill announced an expansion into Ecuador through a local joint venture, with investment of up to USD 55 million for a new aquafeed factory and machinery expected to raise production capacity by around 80%.
- In July 2025, Cermaq agreed to acquire Grieg Seafood’s farming operations in Finnmark, British Columbia and Newfoundland for NOK 10.2 billion enterprise value, and the transaction was completed in December 2025. The acquired businesses represented production of 26,000 tonnes in Finnmark, 12,000 tonnes in western Canada and 11,000 tonnes in eastern Canada.
Report Scope
| Report Features | Description |
|---|---|
| Market Value (2025) | USD 44.1 Bn |
| Forecast Revenue (2035) | USD 92.5 Bn |
| CAGR (2026-2035) | 7.7% |
| Base Year for Estimation | 2025 |
| Historic Period | 2020-2024 |
| Forecast Period | 2026-2035 |
| Report Coverage | Revenue Forecast, Market Dynamics, Competitive Landscape, Recent Developments |
| Segments Covered | By Type (Finfish, Crustaceans, Mollusks, Aquatic Plants, Others), By Product Type (Feed & Feed Additives, Equipment, Chemicals, Pharmaceuticals, Fertilizers), By Culture Environment (Freshwater, Marine Water, Brackish Water), By Culture System (Pond Culture, Cage Culture, Recirculating Aquaculture Systems (RAS), Flow-through / Raceway, Integrated Multi-Trophic Aquaculture (IMTA)), By Production Scale (Residential, Commercial & Public Buildings, Industrial) |
| Regional Analysis | North America – US, Canada; Europe – Germany, France, The UK, Spain, Italy, Rest of Europe; Asia Pacific – China, Japan, South Korea, India, Australia, Singapore, Rest of APAC; Latin America – Brazil, Mexico, Rest of Latin America; Middle East & Africa – GCC, South Africa, Rest of MEA |
| Competitive Landscape | Mowi ASA, SalMar ASA, Lerøy Seafood Group ASA, Bakkafrost P/F, Grieg Seafood ASA, Cermaq Group AS, Cooke Aquaculture Inc., Thai Union Group PCL, Nissui Corporation, Maruha Nichiro Corporation, Charoen Pokphand Foods PCL, Cargill, Inc., Skretting, BioMar Group A/S, AKVA Group ASA |
| Customization Scope | Customization for segments, region/country-level will be provided. Moreover, additional customization can be done based on the requirements. |
| Purchase Options | We have three licenses to opt for: Single User License, Multi-User License (Up to 5 Users), Corporate Use License (Unlimited User and Printable PDF) |





































