


Report Overview
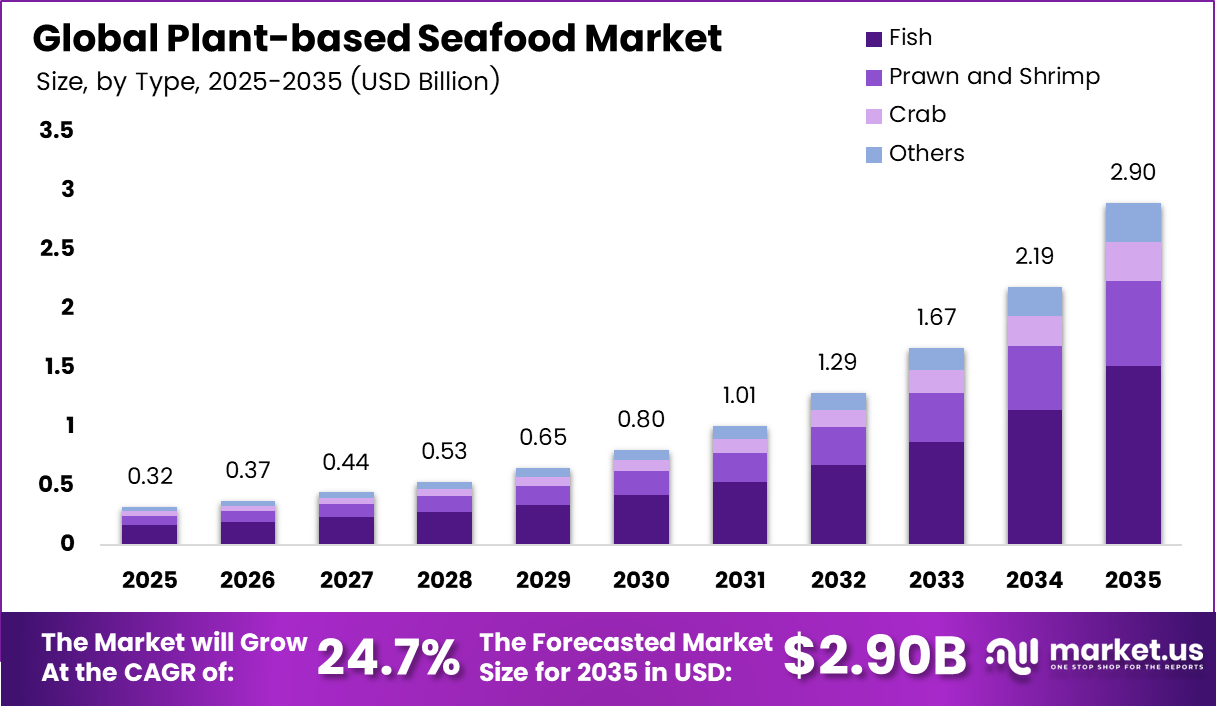
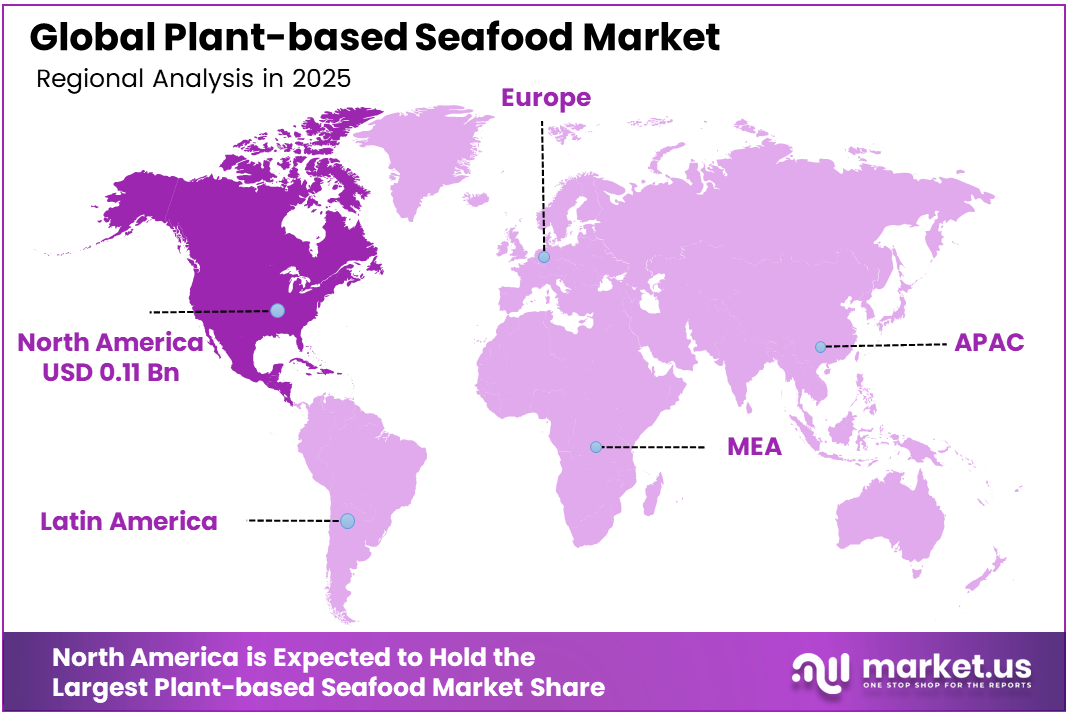
The Global Plant-based Seafood Market was valued at USD 0.32 billion, and between 2025 and 2035, this market is estimated to register a CAGR of 24.7%, reaching about USD 2.90 billion by 2035. North America held a dominant market position, capturing more than a 36.8% share, holding USD 0.11 billion in revenue.
The plant-based seafood market is a growing part of the alternative protein industry, providing sustainable alternatives to traditional seafood products while addressing issues such as overfishing, marine habitat degradation, and food security. Demand is strongly related to the growing popularity of vegan, vegetarian, and flexitarian diets, as well as rising consumer awareness of the environmental impact of traditional seafood production.
- Plant-based fish, shrimp, crab, and other seafood alternatives are gaining demand as manufacturers improve taste, texture, appearance, and nutrition. In June 2025, the FAO reported that 64.5% of global fish stocks were sustainably harvested, while 35.5% were overfished, strengthening demand for sustainable plant-based seafood.
Production and consumption are primarily concentrated in North America and Europe, where high consumer acceptance of plant-based foods, supportive retail infrastructure, and sustainability-conscious shopping behaviours are propelling industry expansion. Meanwhile, Asia Pacific is emerging as a significant growth region as a result of rising health awareness, growing urban populations, and increased interest in alternative protein sources.
Innovation is fast shifting toward the utilization of pea protein, soy protein, algae, seaweed-based additives, mycoprotein, and other novel protein sources to increase product quality and nutritional value. Manufacturers are also investing in clean-label formulas, omega-3 enrichment, and enhanced texture technologies to boost customer adoption. As environmental concerns and demand for ethical food choices develop, plant-based seafood is predicted to play an increasingly important part in the future global protein industry.
Key Takeaways
- The global plant-based seafood market was valued at USD 0.32 billion in 2025.
- The global plant-based seafood market is projected to grow at a CAGR of 24.7% and is estimated to reach USD 2.90 billion by 2035.
- On the basis of type, Fish dominated the plant-based seafood market, constituting 52.4% of the total market share.
- Based on source type, Pea Protein led the market, accounting for 31.5% of the total market share, owing to its favorable texture, nutritional profile, and widespread use in seafood alternative formulations.
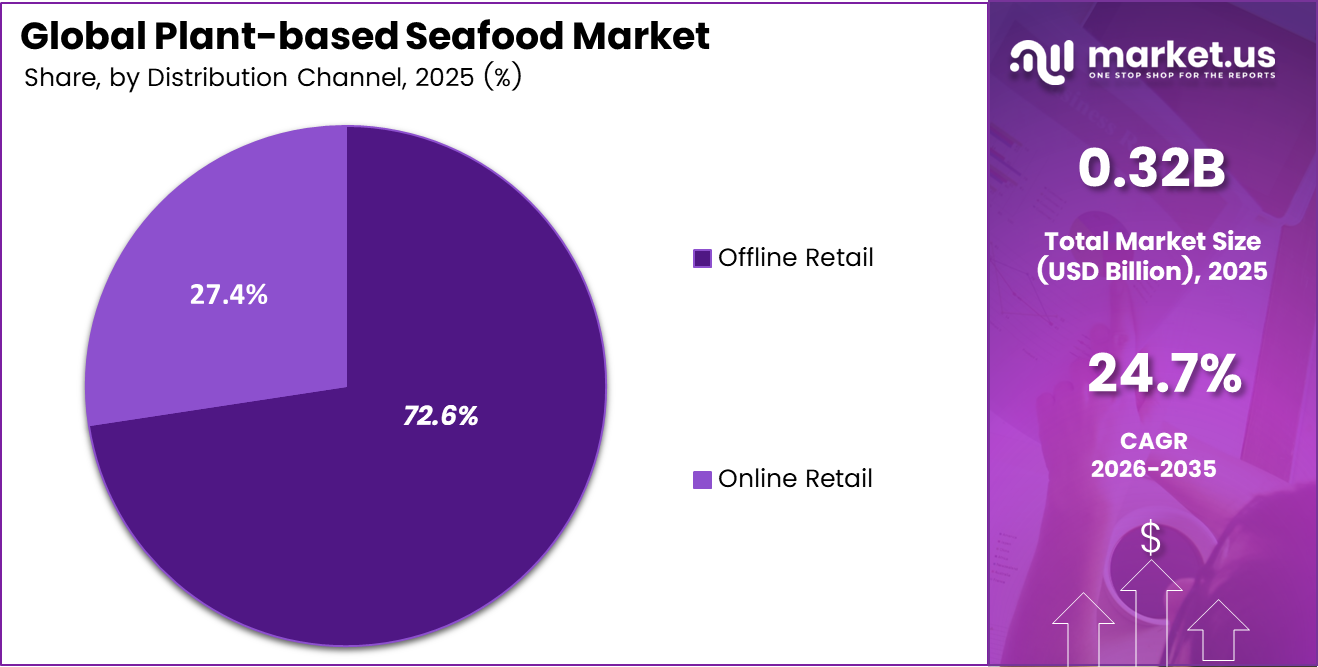
- Based on the distribution channel, Offline Retail dominated the market, representing 72.6% of the total market share, supported by strong product availability across supermarkets, hypermarkets, specialty stores, and health food outlets.
- In 2025, North America emerged as the leading regional market, accounting for 36.8% of the global plant-based seafood market share, driven by high consumer acceptance of plant-based foods, advanced retail infrastructure, and growing sustainability awareness.
Type Analysis
Fish type is a significant type.
The fish category is the biggest part of the global plant-based seafood market, making up 52.4% of the total revenue. This dominance is because people are very familiar with fish as the most common type of seafood, and there’s a growing need for eco-friendly options that replace traditional fish products. The fish segment has seen a lot of new product developments, like plant-based tuna, fish fillets, fish sticks, and fish burgers.
The prawn and shrimp industry is the second biggest in the market, thanks to more people wanting fancy seafood options and new food tech that lets makers copy the taste and feel of shrimp. At the same time, the crab industry is growing faster as companies add more unique seafood choices to attract specific groups and restaurants.
Source Analysis
Pea Protein Is the Most Widely Used Source.
The pea protein sector was the top performer in the global plant-based seafood market, making up 31.5% of the total market share. This strong position comes from several factors, including its mild taste, high protein levels, ability to be safe for people with allergies, and effectiveness in creating a texture similar to real seafood.
Also, as more consumers look for products that are clean-label, non-GMO, and free from soy, pea protein is becoming even more popular among manufacturers. Ongoing improvements in how pea protein is extracted and used in formulas are helping to make the products better and supporting its leading role in the plant-based seafood market.
Soy protein is still widely used because it has all the necessary amino acids and is cost-efficient. Wheat protein helps improve the texture and structure of seafood substitutes. Fava bean and chickpea proteins are becoming more popular as new plant-based ingredients because they are sustainable and nutritious.
Distribution Channel Analysis
Offline retail channel held a Major Share of the Plant-based seafood Market.
The offline retail sector led the global plant-based seafood market, holding 72.6% of the overall market share. This dominance is mainly because plant-based seafood products are widely available in various retail outlets like supermarkets, hypermarkets, convenience stores, specialty shops, health-focused stores, and food service locations.
Many consumers still prefer buying food in stores because they can check the quality, compare different brands, read about ingredients, and decide to buy quickly. In addition, large retailers have expanded their plant-based product ranges to meet the growing interest in sustainable and alternative protein sources.
The online retail sector, which covers e-commerce websites and brand websites, is growing steadily as more people around the world start shopping online. Online platforms give customers a wider range of products, make shopping easier, offer home delivery, and let them discover new plant-based seafood companies that might not have a lot of physical stores.
Key Market Segments
By Type
- Fish
- Prawn and Shrimp
- Crab
- Others
By Source Type
- Soy Protein
- Pea Protein
- Wheat Protein
- Fava Bean Protein
- Chickpea Protein
- Algae & Seaweed-Based
- Mycoprotein
- Others
By Distribution Channel
- Online Retail
- E-commerce Platforms
- Brand-Owned Websites
- Offline Retail
- Supermarkets & Hypermarkets
- Convenience Stores
- Specialty Stores
- Health & Organic Food Stores
- Foodservice Channels
Opportunity
Foodservice & QSR B2B Channel Expansion
Foodservice and quick-service restaurant channels offer one of the most practical near-term growth opportunities for plant-based seafood. However, institutional B2B contracts still contribute a relatively small share of category revenue compared with plant-based meat, where foodservice partnerships already account for more than 25% of total volume.
Demand is being supported by QSR operators seeking to reduce Scope 3 supply-chain emissions by 30–40% by 2030, concerns surrounding depleted marine resources, and the ability of restaurant preparation methods to improve the taste and texture experience for first-time consumers. Bulk procurement can also lower unit costs and bring plant-based seafood closer to conventional seafood pricing at order volumes above 500 kg.
In India, where category revenue reached USD 11.8 million in 2025 and is advancing at a 24.14% CAGR, a nationwide QSR agreement could generate an estimated USD 8–15 million in annual offtake. Dedicated foodservice products may deliver a 15–20% gross-margin advantage while reducing customer acquisition expenses compared with retail campaigns, which often cost USD 35–55 for each newly acquired household.
| Opportunity | (~) % Potential CAGR Upside | Geographic Relevance | Execution Window |
|---|---|---|---|
| Foodservice & QSR B2B Channel Expansion | +2.8% | North America, EU, APAC urban corridors | Short term (≤ 2 years) |
| Private-Label Retail Partnerships | +2.2% | EU (Germany, France, Spain), North America | Short term (≤ 2 years) |
| Functional & Nutraceutical Seafood Products | +1.9% | North America, Japan, ANZ | Medium term (2–4 years) |
| APAC Emerging Market Penetration (India, SE Asia) | +2.5% | India, Vietnam, Indonesia, Thailand | Medium term (2–4 years) |
| DTC Subscription & Personalized Nutrition Models | +1.5% | North America, EU, urban APAC | Medium term (2–4 years) |
| M&A Roll-Up of Ingredient & Micro-Algae Suppliers | +1.7% | Global (production hubs: India, Chile, Netherlands) | Long term (≥ 4 years) |
Drivers
Flexitarian Dietary Shift
Flexitarian consumers represent the broadest potential customer base for plant-based seafood because they reduce animal-protein intake without completely removing it from their diets. This group accounts for an estimated 40–45% of adults across developed markets, compared with only 5–10% identifying as vegan or vegetarian, expanding the realistic addressable audience by approximately four to five times.
The category has also moved beyond purely ethical positioning and is increasingly associated with convenience, health, variety, and everyday meal choices. In 2025, plant-based foods were purchased by 60% of US households, unchanged from the previous year, showing that occasional consumption has already become relatively mainstream. The next growth phase depends on converting trial into regular purchasing.
The Good Food Institute estimates that increasing average household purchase frequency from 11.7 to 23.4 units annually could create nearly USD 1 billion in additional sales. Across urban Asian markets, higher incomes, changing diets, and interest in protein diversification are further supporting flexitarian adoption. Brands should therefore prioritize sampling, restaurant exposure, meal-kit partnerships, and familiar recipes rather than relying heavily on ideology-led marketing.
| Driver | (~) % Impact on CAGR Forecast | Geographic Relevance | Impact Timeline |
|---|---|---|---|
| Overfishing & Ocean Stock Depletion Narrative | +2.5% | EU, North America, APAC coastal economies | Short term (≤ 2 years) |
| Health Consciousness & Contaminant Avoidance | +2.1% | North America, Japan, ANZ, urban EU | Short term (≤ 2 years) |
| Flexitarian Dietary Shift | +2.8% | North America core, EU, urban APAC | Short term (≤ 2 years) |
| Food Technology Innovation (Texture & Flavor R&D) | +1.9% | North America, EU, Israel, Singapore | Medium term (2–4 years) |
| Rising Institutional ESG & Sustainability Procurement | +1.6% | EU (regulatory core), North America | Medium term (2–4 years) |
| Retail Channel Expansion & Distribution Depth | +1.4% | North America, EU, APAC urban corridors | Short term (≤ 2 years) |
Restraints
Persistent Price Premium vs. Conventional Seafood
The continuing price premium over conventional seafood remains one of the strongest barriers to mainstream adoption. In 2025, most plant-based meat and seafood alternatives were still priced between one and three times above comparable animal-based products. Although average plant-based retail prices increased by only 1%, the narrowing observed in some categories largely reflected rising conventional-protein prices rather than meaningful reductions in alternative-protein production costs.
The underlying problem remains the high cost of specialized ingredients and limited manufacturing scale. Inputs such as microalgae biomass, konjac, and high-purity soy protein isolate can cost USD 8–22 per kilogram, while conventional fishmeal generally ranges from USD 1.5–4 per kilogram. Smaller extrusion runs also prevent manufacturers from achieving the EUR 0.15–0.35 per-unit efficiencies available at production volumes exceeding 50,000 tonnes annually.
Suppliers remain concentrated in premium retail and specialty channels, limiting accessible demand to approximately 12–18% of seafood-purchasing households in developed economies and below 3–5% in emerging markets. Meaningful price parity will likely require raw-material cost reductions of 40–60%, larger manufacturing runs, and formulations that use fewer expensive functional ingredients.
| Restraint | (~) % Impact on CAGR Forecast | Geographic Relevance | Impact Timeline |
|---|---|---|---|
| Persistent Price Premium vs. Conventional Seafood | -3.2% | North America, EU, APAC emerging markets | Short term (≤ 2 years) |
| Taste & Texture Parity Gap | -2.6% | Global (all geographies) | Medium term (2–4 years) |
| EU & US Regulatory Labeling Constraints | -1.5% | EU (27 member states), North America | Short term (≤ 2 years) |
| Limited Raw Material & Ingredient Supply Scale | -1.8% | Global (APAC production corridors) | Medium term (2–4 years) |
| Waning Venture Capital & Investment Funding | -1.4% | North America, EU innovation hubs | Short term (≤ 2 years) |
| Low Consumer Awareness in Emerging Markets | -1.2% | India, SE Asia, Latin America | Medium term (2–4 years) |
Challenges
Cold Chain Infrastructure Complexity
Cold chain requirements create a significant operational challenge for plant-based seafood producers, particularly when frozen products are distributed across fragmented emerging-market networks. These systems increase capital requirements, extend delivery schedules, and expose products to temperature-related quality risks.
In India, establishing a cold-storage facility with a capacity of 10–20 tonnes can require an investment of ₹15–30 lakh, while a 50-tonne facility may cost ₹40–80 lakh. Facilities exceeding 100 tonnes can demand ₹1–3 crore or more. Distribution assets add further expense, with refrigerated vans costing around ₹10–18 lakh and larger reefer trucks requiring more than ₹35 lakh. These investment levels make direct distribution difficult in smaller cities without specialist third-party logistics support.
Cold-chain handling can also add three to five days to delivery buffers, while spoilage may reach 3–8% of shipped volume in fragmented networks, compared with 1–2% in integrated systems. Continuous temperature monitoring contributes an additional USD 0.15–0.35 per kilogram to logistics costs. Producers may need to adopt shared hub-and-spoke infrastructure, strengthen 3PL partnerships, or develop shelf-stable formats for selected markets.
| Challenge | (~) % CAGR Friction Drag | Geographic Relevance | Mitigation Horizon |
|---|---|---|---|
| Cold Chain Infrastructure Complexity | -1.5% | APAC logistics corridors, India, SE Asia, Latin America | Medium term (2–4 years) |
| Talent Scarcity in Food Science & Fermentation | -0.9% | Global (North America, EU R&D hubs, Singapore) | Long term (≥ 4 years) |
| Ingredient Yield Variability & Standardization | -1.1% | Global (primarily APAC & EU production facilities) | Medium term (2–4 years) |
| Consumer Repeat Purchase & Habit Formation Gap | -1.3% | North America core, EU, urban APAC | Short term (≤ 2 years) |
| Multi-Jurisdictional Regulatory Navigation | -0.8% | EU regulatory hubs, North America, APAC | Long term (≥ 4 years) |
| Manufacturing Scale-Up Execution Risk | -1.2% | North America, EU, APAC scale-up facilities | Medium term (2–4 years) |
Geopolitical Impact Analysis
Food Security Concerns and Supply Chain Resilience Accelerating Adoption of Plant-Based Seafood Alternatives.
Food security concerns and supply chain resilience are becoming important geopolitical factors in the plant-based seafood market. Trade disputes, regional conflicts, shipping route disruptions, and changing import policies can affect the availability and pricing of conventional seafood in several markets.
These risks are increasing interest in alternative food systems that depend less on wild-capture seafood and long international seafood supply chains. As concerns over overfishing, marine resource pressure, and import dependence grow, plant-based seafood is gaining attention as a more stable and sustainable protein option.
At the same time, plant-based seafood manufacturers are also exposed to geopolitical risks through agricultural raw materials such as soy, peas, wheat, algae, seaweed, and other plant proteins. Tariffs, crop shortages, export controls, and freight disruptions can increase input costs and affect product pricing.
However, these challenges are also encouraging governments, food companies, and investors to support domestic food innovation and alternative protein development. In the long term, geopolitical uncertainty may strengthen investment in resilient food systems, creating new opportunities for plant-based seafood as part of the broader alternative protein market.
Regional Analysis
North America Held the Largest Share of the Global Plant-based Seafood Market.
In 2025, North America topped the global plant-based seafood industry, with 36.8% of the total share. The region’s leadership is primarily motivated by widespread consumer knowledge of sustainability, animal welfare, and environmental concerns linked with traditional fish farming. The increased popularity of vegan, vegetarian, and flexitarian diets, combined with high demand for alternative protein products, drives market expansion.
The existence of prominent plant-based food manufacturers, large retail distribution networks, and rising availability of plant-based seafood items in supermarkets, specialty stores, and foodservice channels help to boost the region’s market position. Continuous product innovation and investment in alternative protein technologies help North America dominate the worldwide plant-based seafood business.
Europe is another big market, bolstered by strong sustainability programs, rising consumer preference for plant-based diets, and positive governmental backing for alternative protein sources. Asia Pacific is emerging as a high-growth market as a result of expanding health consciousness, fast urbanization, rising disposable incomes, and heightened understanding of sustainable food options.
Latin America is experiencing modest growth as plant-based food consumption increases and dietary preferences shift. The Middle East and Africa market is still in its early stages, but it is likely to gain traction as awareness of alternative proteins grows and food diversification plans emerge throughout the area.
Key Regions and Countries
- North America
- The US
- Canada
- Europe
- Germany
- France
- The UK
- Spain
- Italy
- Russia & CIS
- Rest of Europe
- APAC
- China
- Japan
- South Korea
- India
- ASEAN
- Rest of APAC
- Latin America
- Brazil
- Mexico
- Rest of Latin America
- Middle East & Africa
- GCC
- South Africa
- Rest of MEA
Key Players Analysis
The global plant-based seafood market is characterized by a moderately consolidated competitive landscape, with a mix of established alternative protein innovators and emerging startups actively competing for market share. Leading players have built strong positions through extensive product portfolios, well-developed distribution networks, and continuous investment in product development.
As consumer interest in sustainable and seafood-free alternatives continues to grow, companies are focusing on expanding their presence across retail stores, supermarkets, online platforms, and foodservice channels. Competition in the market is largely driven by product quality, taste, texture, nutritional value, and brand visibility.
Manufacturers are investing heavily in research and development to create seafood alternatives that closely resemble conventional fish and shellfish products while meeting consumer demand for clean-label and environmentally friendly foods.
New product launches, strategic partnerships, expansion into new markets, and improvements in manufacturing capabilities remain common strategies adopted by market participants. As awareness of sustainable food choices increases worldwide, the market is expected to witness stronger competition and continued innovation in the coming years.
The Major Players in the Industry
- Good Catch Foods
- New Wave Foods
- Sophie’s Kitchen
- Ocean Hugger Foods
- The Plant-Based Seafood Co.
- Aqua Cultured Foods
- BlueNalu
- Shiok Meats
- Future Farm
- Prime Roots
- Revo Foods
- Gardein
- Vegefarm
- Thai Union Group
- Conagra Brands
- Other Key Players
Key Development
- In Nov 2024, Aqua Cultured Foods transitioned from its fungi-based platform to a cellulose-based production platform to improve scalability and manufacturing efficiency. The company stated that the new approach can reduce production costs and support its goal of achieving price parity with conventional seafood, strengthening the commercial potential of its alternative seafood products.
- In June 2025, Good Catch expanded its plant-based fish fillet and tuna portfolio with new frozen retail formats, enabling broader placement in supermarket frozen seafood aisles and improving product accessibility for consumers. The launch strengthened the company’s presence in the retail channel while expanding its range of ready-to-cook seafood alternatives designed to replicate conventional fish products.
Report Scope
| Report Features | Description |
|---|---|
| Market Value (2025) | USD 0.32 Bn |
| Forecast Revenue (2035) | USD 2.90 Bn |
| CAGR (2026-2035) | 24.7% |
| Base Year for Estimation | 2025 |
| Historic Period | 2020-2024 |
| Forecast Period | 2026-2035 |
| Report Coverage | Revenue Forecast, Market Dynamics, Competitive Landscape, Recent Developments |
| Segments Covered | By Type (Fish, Prawn & Shrimp, Crab, and Others), By Source Type (Soy Protein, Pea Protein, Wheat Protein, Fava Bean Protein, Chickpea Protein, Algae & Seaweed-Based, Mycoprotein, and Others), By Distribution Channel (Online Retail and Offline Retail) |
| Regional Analysis | North America – The US & Canada; Europe – Germany, France, The UK, Spain, Italy, Russia & CIS, Rest of Europe; APAC- China, Japan, South Korea, India, ASEAN & Rest of APAC; Latin America- Brazil, Mexico & Rest of Latin America; Middle East & Africa- GCC, South Africa, & Rest of MEA |
| Competitive Landscape | Good Catch Foods, New Wave Foods, Sophie’s Kitchen, Ocean Hugger Foods, The Plant-Based Seafood Co., Aqua Cultured Foods, BlueNalu, Shiok Meats, Future Farm, Prime Roots, Revo Foods, Gardein, Vegefarm, Thai Union Group, Conagra Brands, and Other Key Players. |
| Customization Scope | Customization for segments and region/country-level will be provided. Moreover, we can provide further customization to meet your requirements. |
| Purchase Options | We have three licenses to opt for: Single User License, Multi-User License (Up to 5 Users), Corporate Use License (Unlimited Users and Printable PDF) |





































